
Markets Report: will the pullback continue?
Stocks pulled back this week. What's next?

Stocks pulled back and volatility jumped this week. This was to be expected. Prior to this week, VIX fell 6 straight weeks while stocks rallied non-stop.

In today’s Markets Report I’ll share my outlook for stocks, Bitcoin, gold, energy, bonds, and currencies.
U.S. Equities
Stocks fell from Tuesday-Friday, with Trump threatening new tariffs on the EU. While it’s not possible to consistently and accurately predict the news, the key point is that when markets become over-extended, any news can act as a catalyst for mean reversion. Focus on Risk/Reward instead. News is just the trigger.
Options
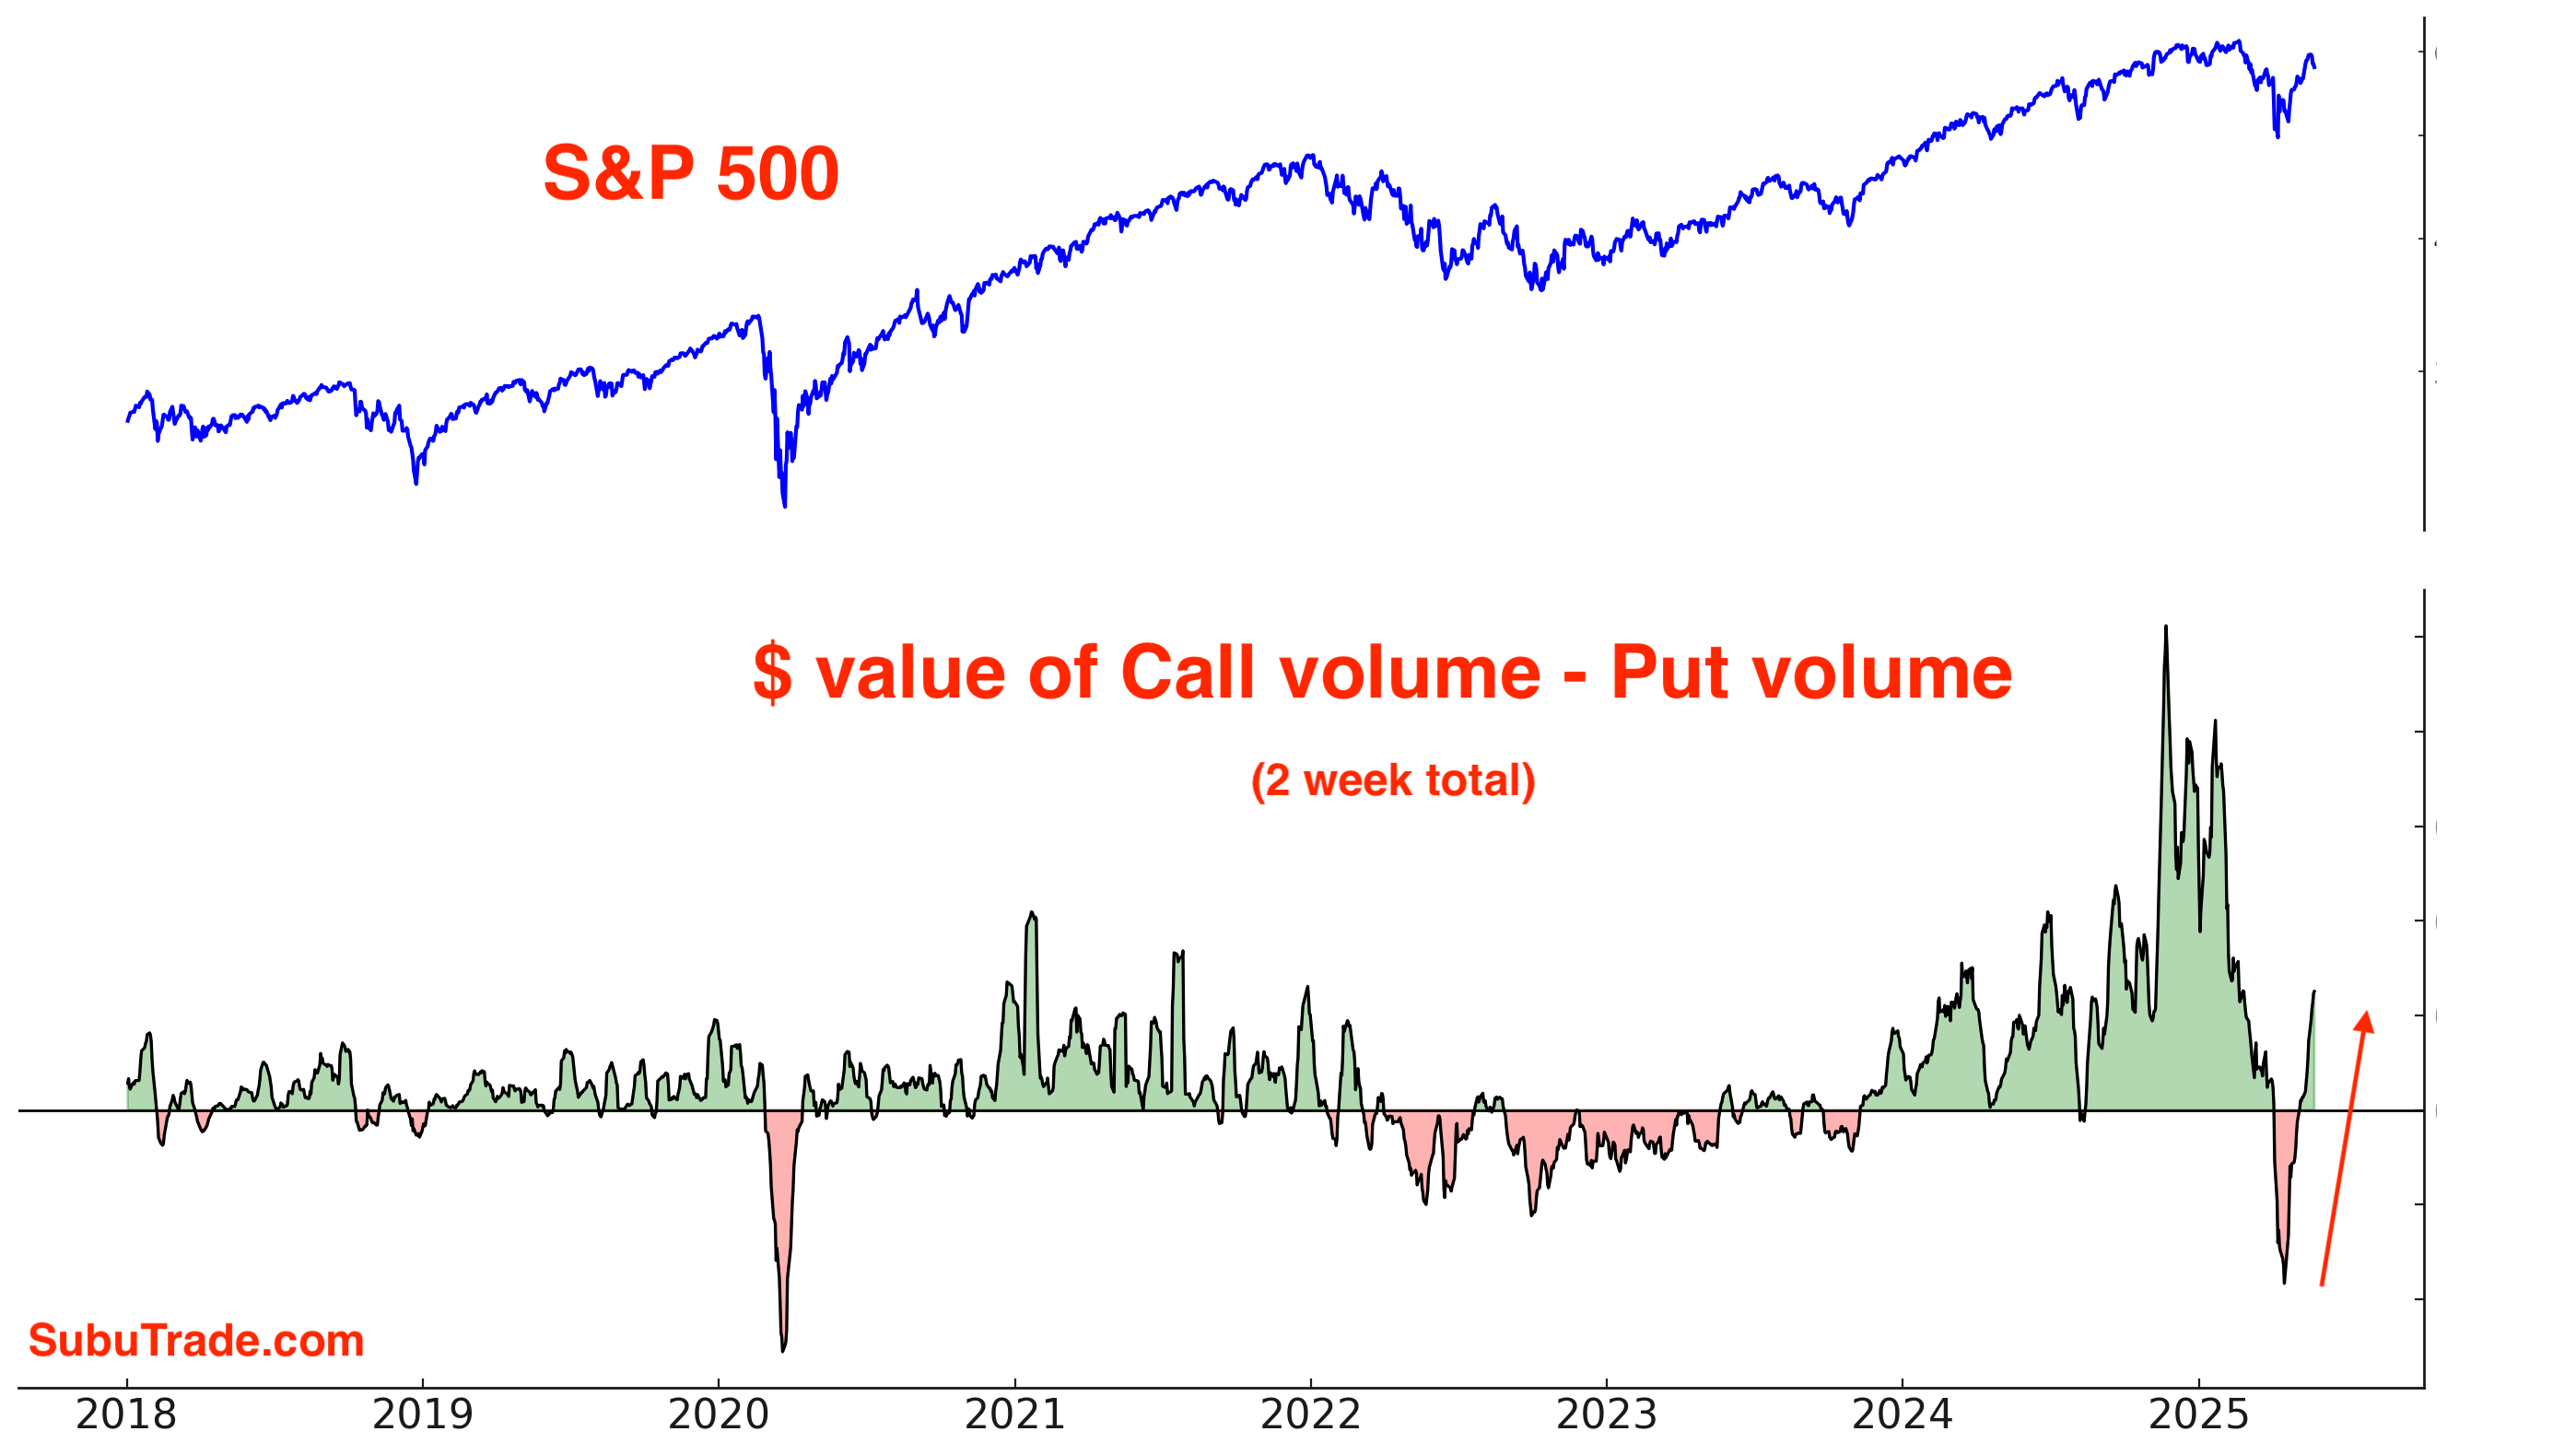
Before the pullback began in earnest on Wednesday, options traders were bulled up. Even if we exclude the 0DTE frenzy, the $ value of all Call volume - the $ value of all Put volume has jumped higher:

This is reflected in the S&P 500 options as well:
The stock market’s pullback was to be expected, after the CBOE’s Total Put/Call ratio became quite low:

Gamma Exposure fell this week as stocks pulled back:

Momentum & quick recoveries
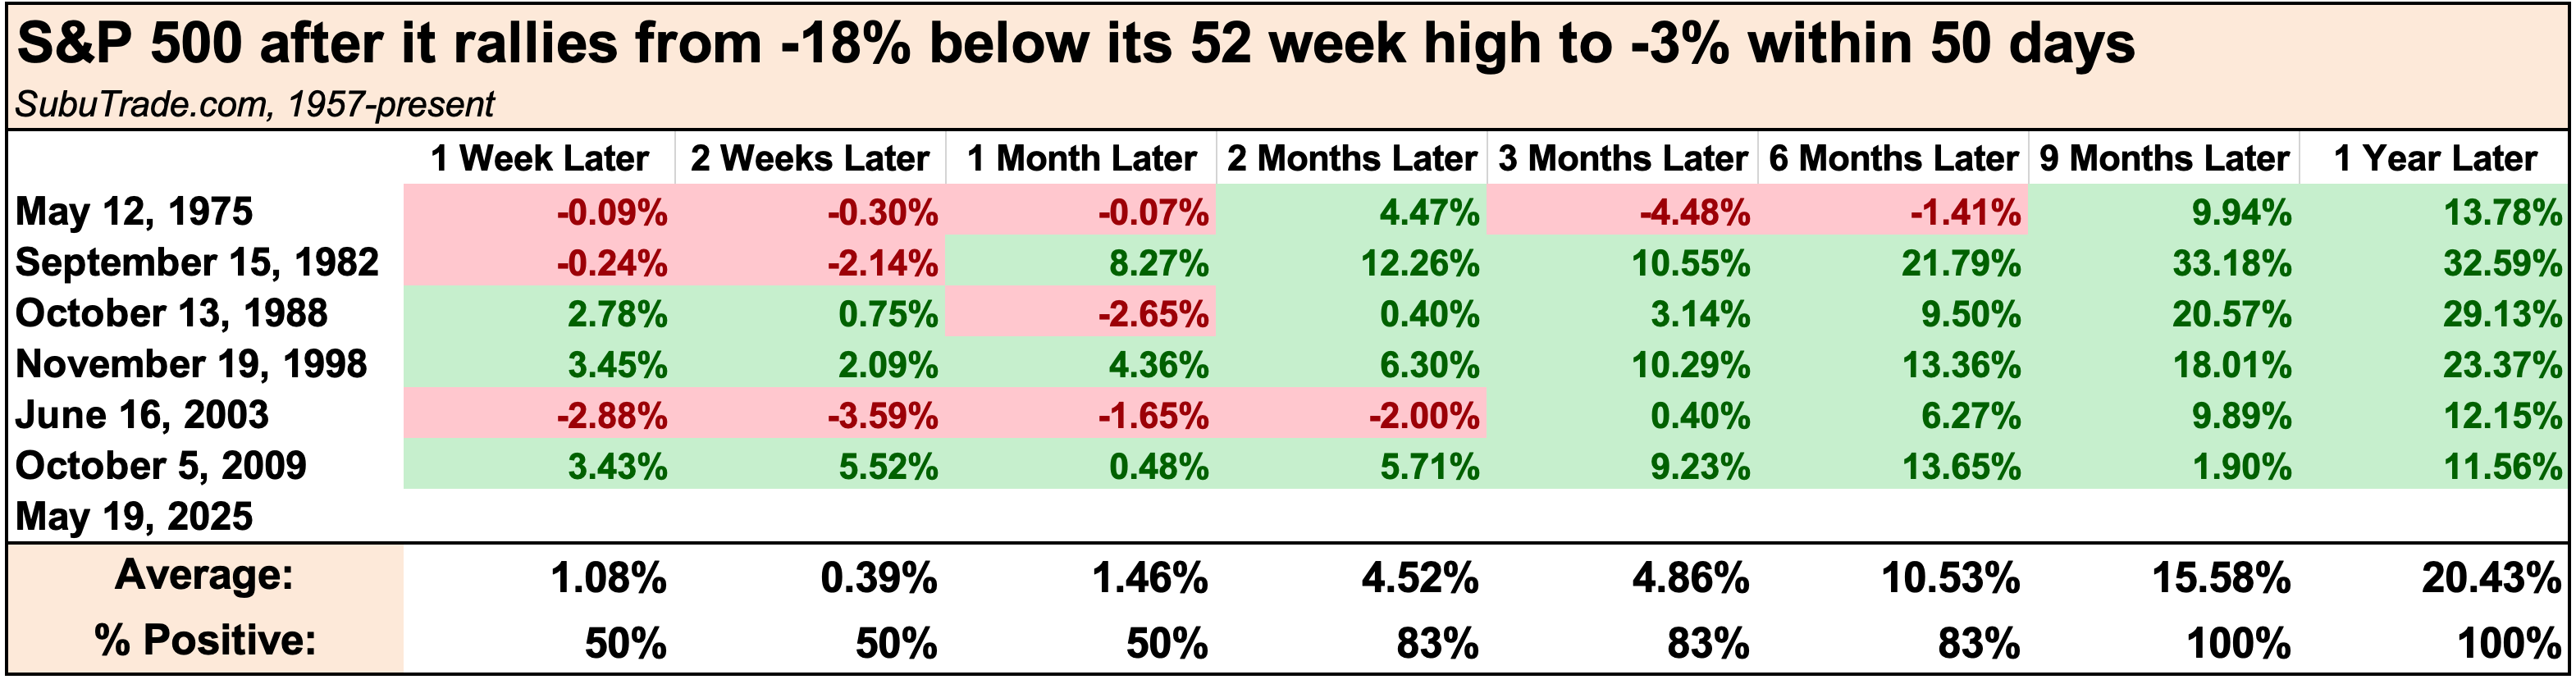
The market’s momentum was strong before this pullback. Last month, the S&P was more than -18% below its all-time high. This Monday, the S&P was within -3% of its all-time high!

These quick recoveries are signs of strong momentum and tend to be bullish for stocks over the next 3-12 months:
Sentiment Surveys
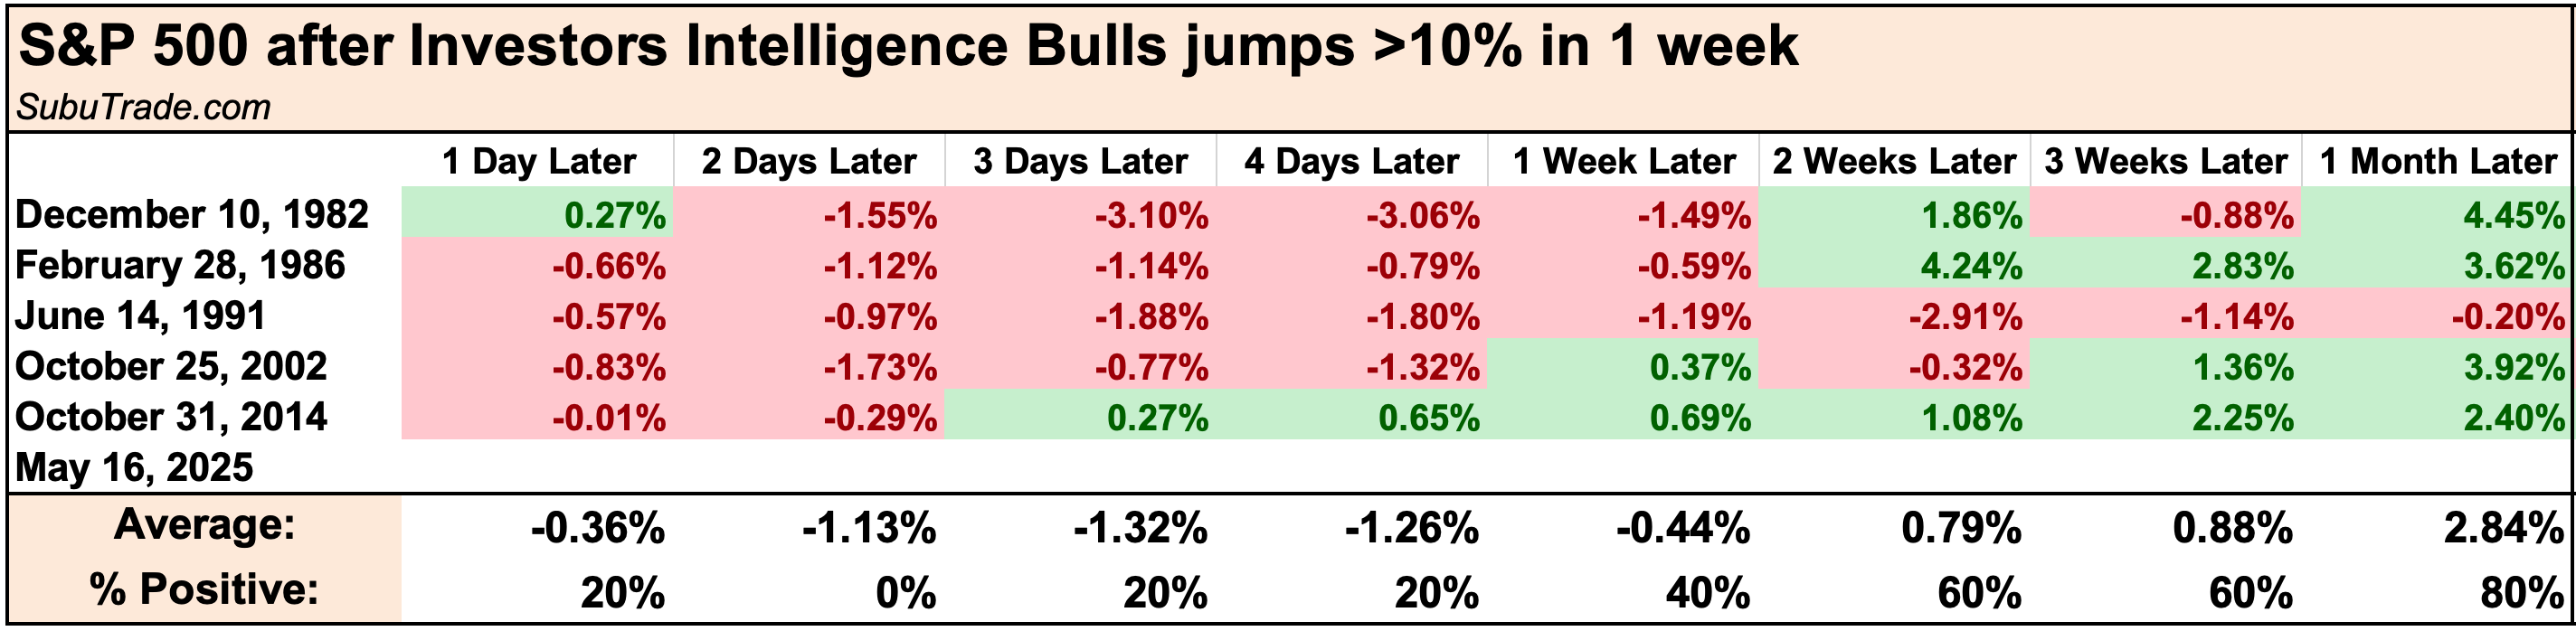
Sentiment mostly moves along with price. The latest reading for Investors Intelligence Bulls jumped by more than +10%:

This tends to be short term bearish for stocks. The problem with Investors Intelligence is that the data is released with a delay. By the time the data is released, the pullback has already occurred!
AAII Bulls finally exceeded Bears this week:

This is the first time in 15 weeks in which Bulls exceeded Bears. This is a bullish sign for stocks over the next 2 months:

The NAAIM Exposure Index increased. Asset Managers are slowly becoming more bullish:

Other Sentiment
The S&P 500’s Daily Sentiment Index dipped this week as stocks pulled back.

VIX went up, along with its Daily Sentiment Index:

The CNN Fear & Greed indicator fell a little as stocks pulled back:

Breadth
Here are the % of S&P 500 stocks above their 200 and 50 day moving averages.
*These popular breadth indicators closely track the S&P’s distance from its 200 and 50 day moving averages. The logic is simple: the more stocks above the 200-DMA, the more the S&P will be above its 200-DMA. The more stocks below the 200-DMA, the more the S&P will be below its 200-DMA.

Here are the % of NASDAQ 100 stocks above their 200 and 50 day moving averages:

Fund Flows
Before this week’s stock market pullback, VIX ETFs saw inflows. Traders were betting on VIX to jump, which it did:

TQQQ traders are contrarian: they buy the dip and sell the rip.
TQQQ has seen massive outflows over the past month, implying that these contrarian traders were taking profits as stocks rallied:

Corporate Insiders
The corporate insider buy/sell ratio is trending down. Corporate insiders were using the recent rally to unload shares!

Here’s the same chart, using a log scale:

Trend
The trend is your friend, until it ends. Despite this week’s pullback, the stock market is still trending Up:

Why does this matter? Because at least from a trend following perspective, it’s better to buy when the market is trending Up (e.g. above its 200-DMA) than when the market is trending Down (e.g. below its 200-DMA).
*There is nothing “special” about the 200 day moving average, except the fact that it’s popular. It is not significantly different from the 195, 190, 185, 180, 205, 210, 215, or 220 moving averages.

Earnings & Valuations
Many traders say that valuations and fundamentals are useless, and that “only price matters”. While this is true for day traders (valuations have zero impact on the market’s short term direction), fundamentals matter for traders and investors with longer term horizons.
Valuations for large cap stocks (S&P 500) remain elevated compared to their 10 year average:

Here’s the S&P 500’s forward earnings expectations. In the long run, earnings and stock prices move in the same direction:

My Outlook
Trump’s EU tariff threats illustrate a Black Swan risk for equities:
Any setbacks or negative headlines around trade talks could trigger a quick market selloff.
While the probability of major disruptions to trade negotiations may seem low, it is higher than what the market currently anticipates. This represents a mis-pricing of risk that traders should monitor.
The key question is not “will the pullback continue?”. That’s anyone’s 50/50 guess. You can easily point to 5 reasons why stocks will pullback more, and 5 reasons why the pullback is over.
The key point: looking at the bigger picture, Risk/Reward favors neither bulls nor bears right now. So be patient: the right setup will come to those who wait!
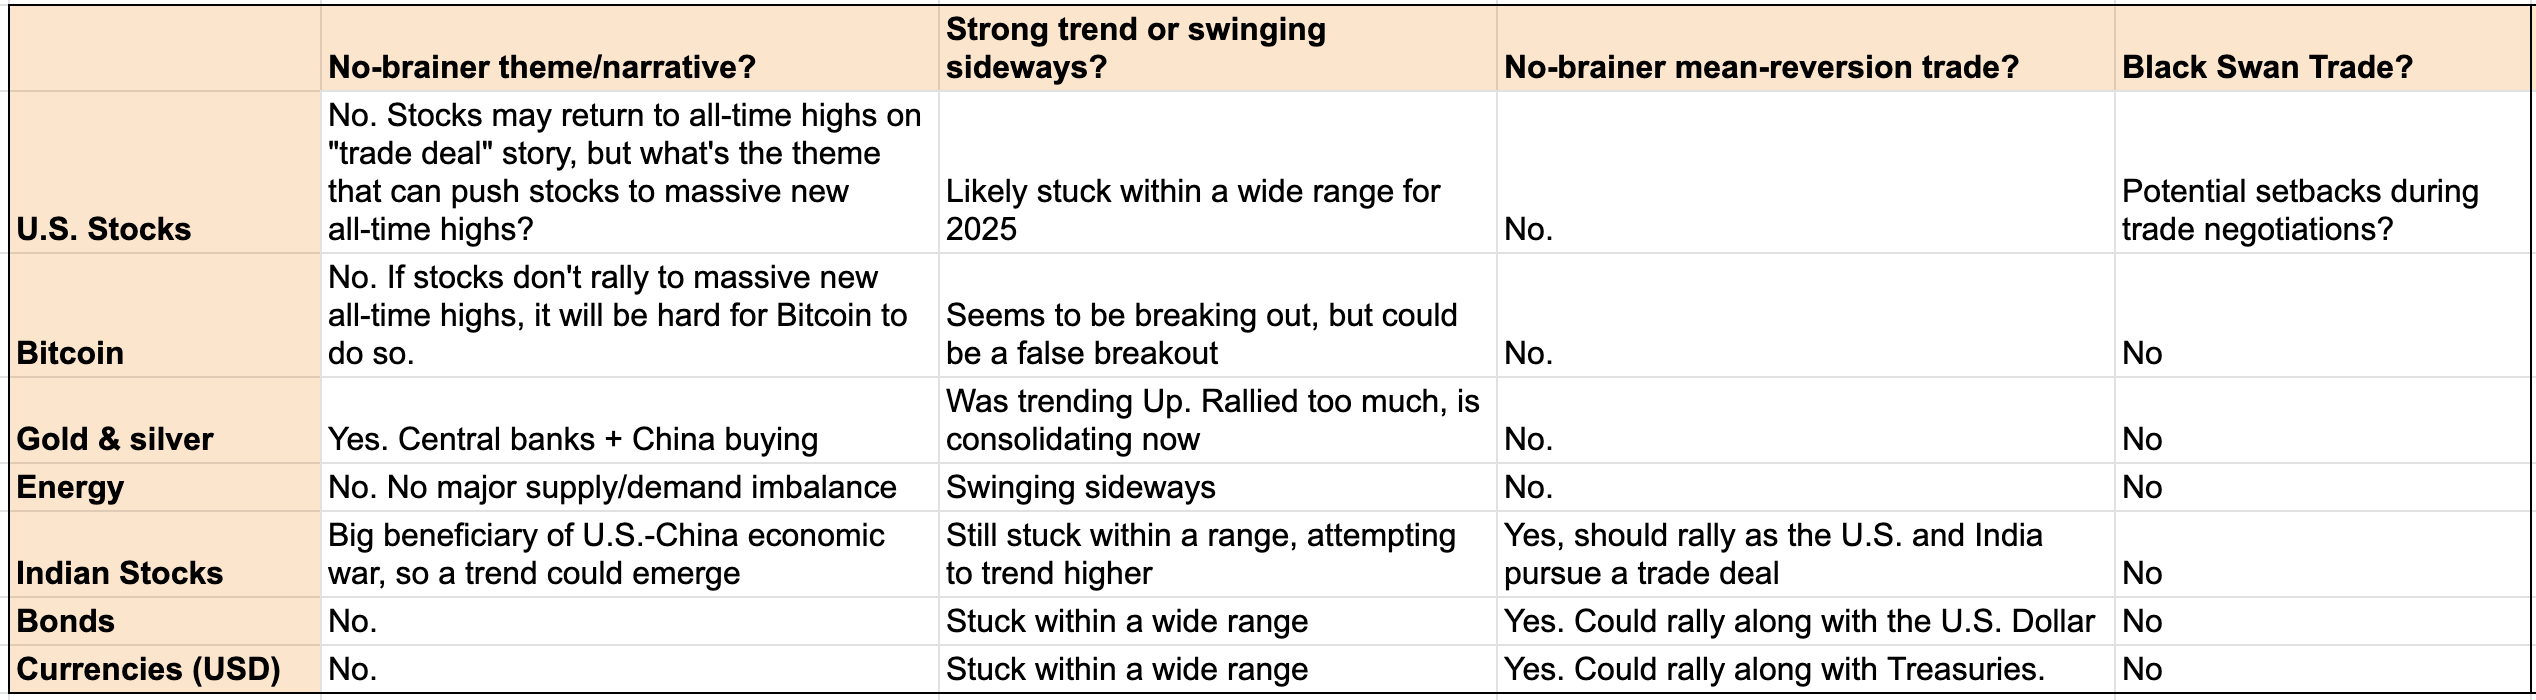
What’s the theme/narrative that can push stocks to massive new all-time highs like in 2023-2024? Even if Trump strikes trade deals with other nations, that is not a net positive for the U.S. economy & corporate earnings. It simply fixes some of the self-inflicted harm from trade wars.
What’s the theme/narrative that can push equities massively lower (e.g. re-test the bottom)? The U.S. economy and corporate earnings have been hurt by these trade wars. But the pain is not disastrous, and nor is it un-fixable. Absent a rapidly escalating trade war, there is no theme right now that can push stocks massively lower (i.e. re-test the April lows).
I expect stocks to trade in a wide and volatile range throughout 2025, swinging Up and Down, with the S&P 500 perhaps making marginal all-time highs.
When Risk/Reward favors neither bulls nor bears, it’s important to remember that equities exhibit a slow upwards bias over time. This long-term trend is driven by the growth of corporate earnings in a dynamic, innovation-driven economy like the U.S.
My Portfolio
*Click here to understand how I trade
Long SPY (S&P 500 ETF). Still the largest position in my portfolio, but is a medium-sized position.
*Bitcoin and U.S. equities move in the same direction.
No position in Gold. Gold could correct/consolidate for weeks/months to work off the recent excess.
Mean-Reversion Position (Non-Core): long energy stocks. Small position size, will increase position if energy stocks fall.
Mean-Reversion Position (Non-Core) - Long Indian Equities: Small position size.
Mean-Reversion Position (Non-Core) – Long U.S. Treasury Bonds: Small position size. Reduced position on Monday’s intraday bounce.

Markets Report continued….
Bitcoin
Bitcoin is a high-beta, risk-on asset that generally rallies when stocks rally and struggles when stocks fall. While its directional correlation with stocks is clear, its price action is different—less wave-like, more staircase: sharp moves followed by prolonged consolidations.
Breakout?
Bitcoin tried to breakout:

Trend
Bitcoin is trending higher:

Sentiment
Sentiment is elevated, which is no surprise considering Bitcoin’s rally since early-April:

Robinhood and Bitcoin
The poster child of the past 2 years’ options & crypto boom is Robinhood. Robinhood has an army of retail traders who love trading anything that’s volatile or leveraged: options, crypto, etc.
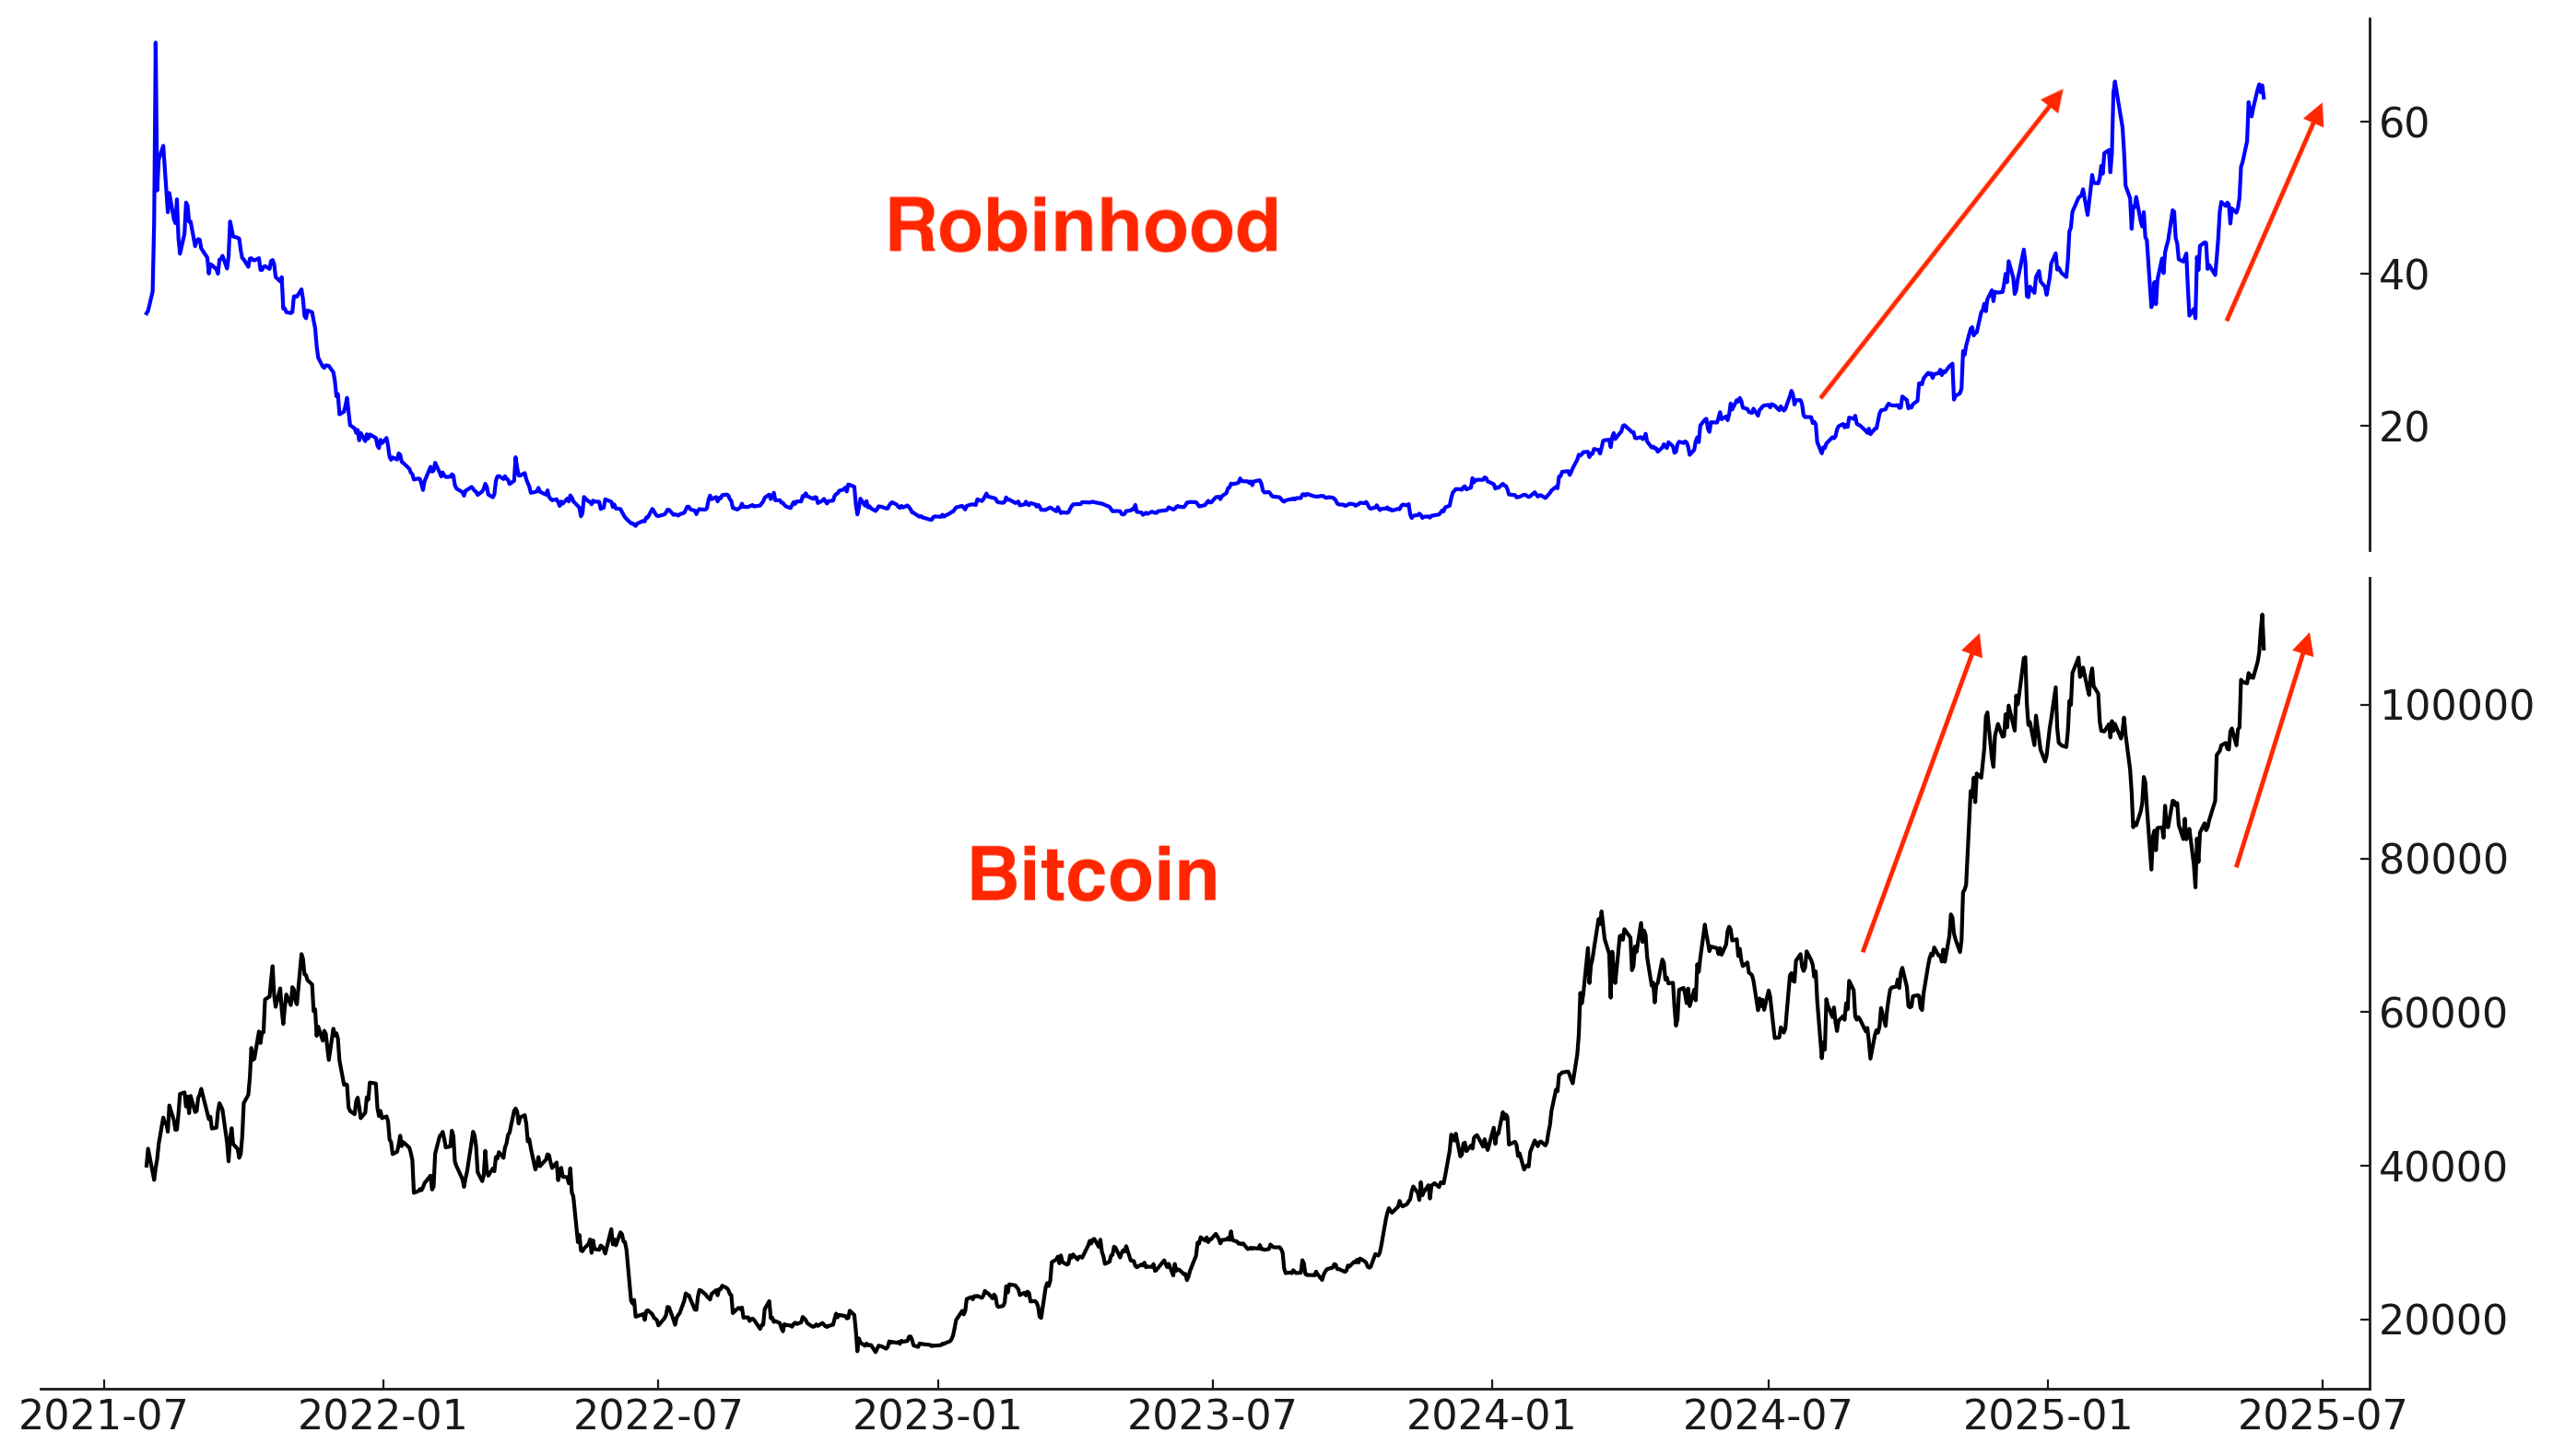
Robinhood surged since early-2024, when Bitcoin took off. Robinhood’s rally is related to its jump in Crypto-transactions revenue:
Options traders betting on Robinhood are bulled up:

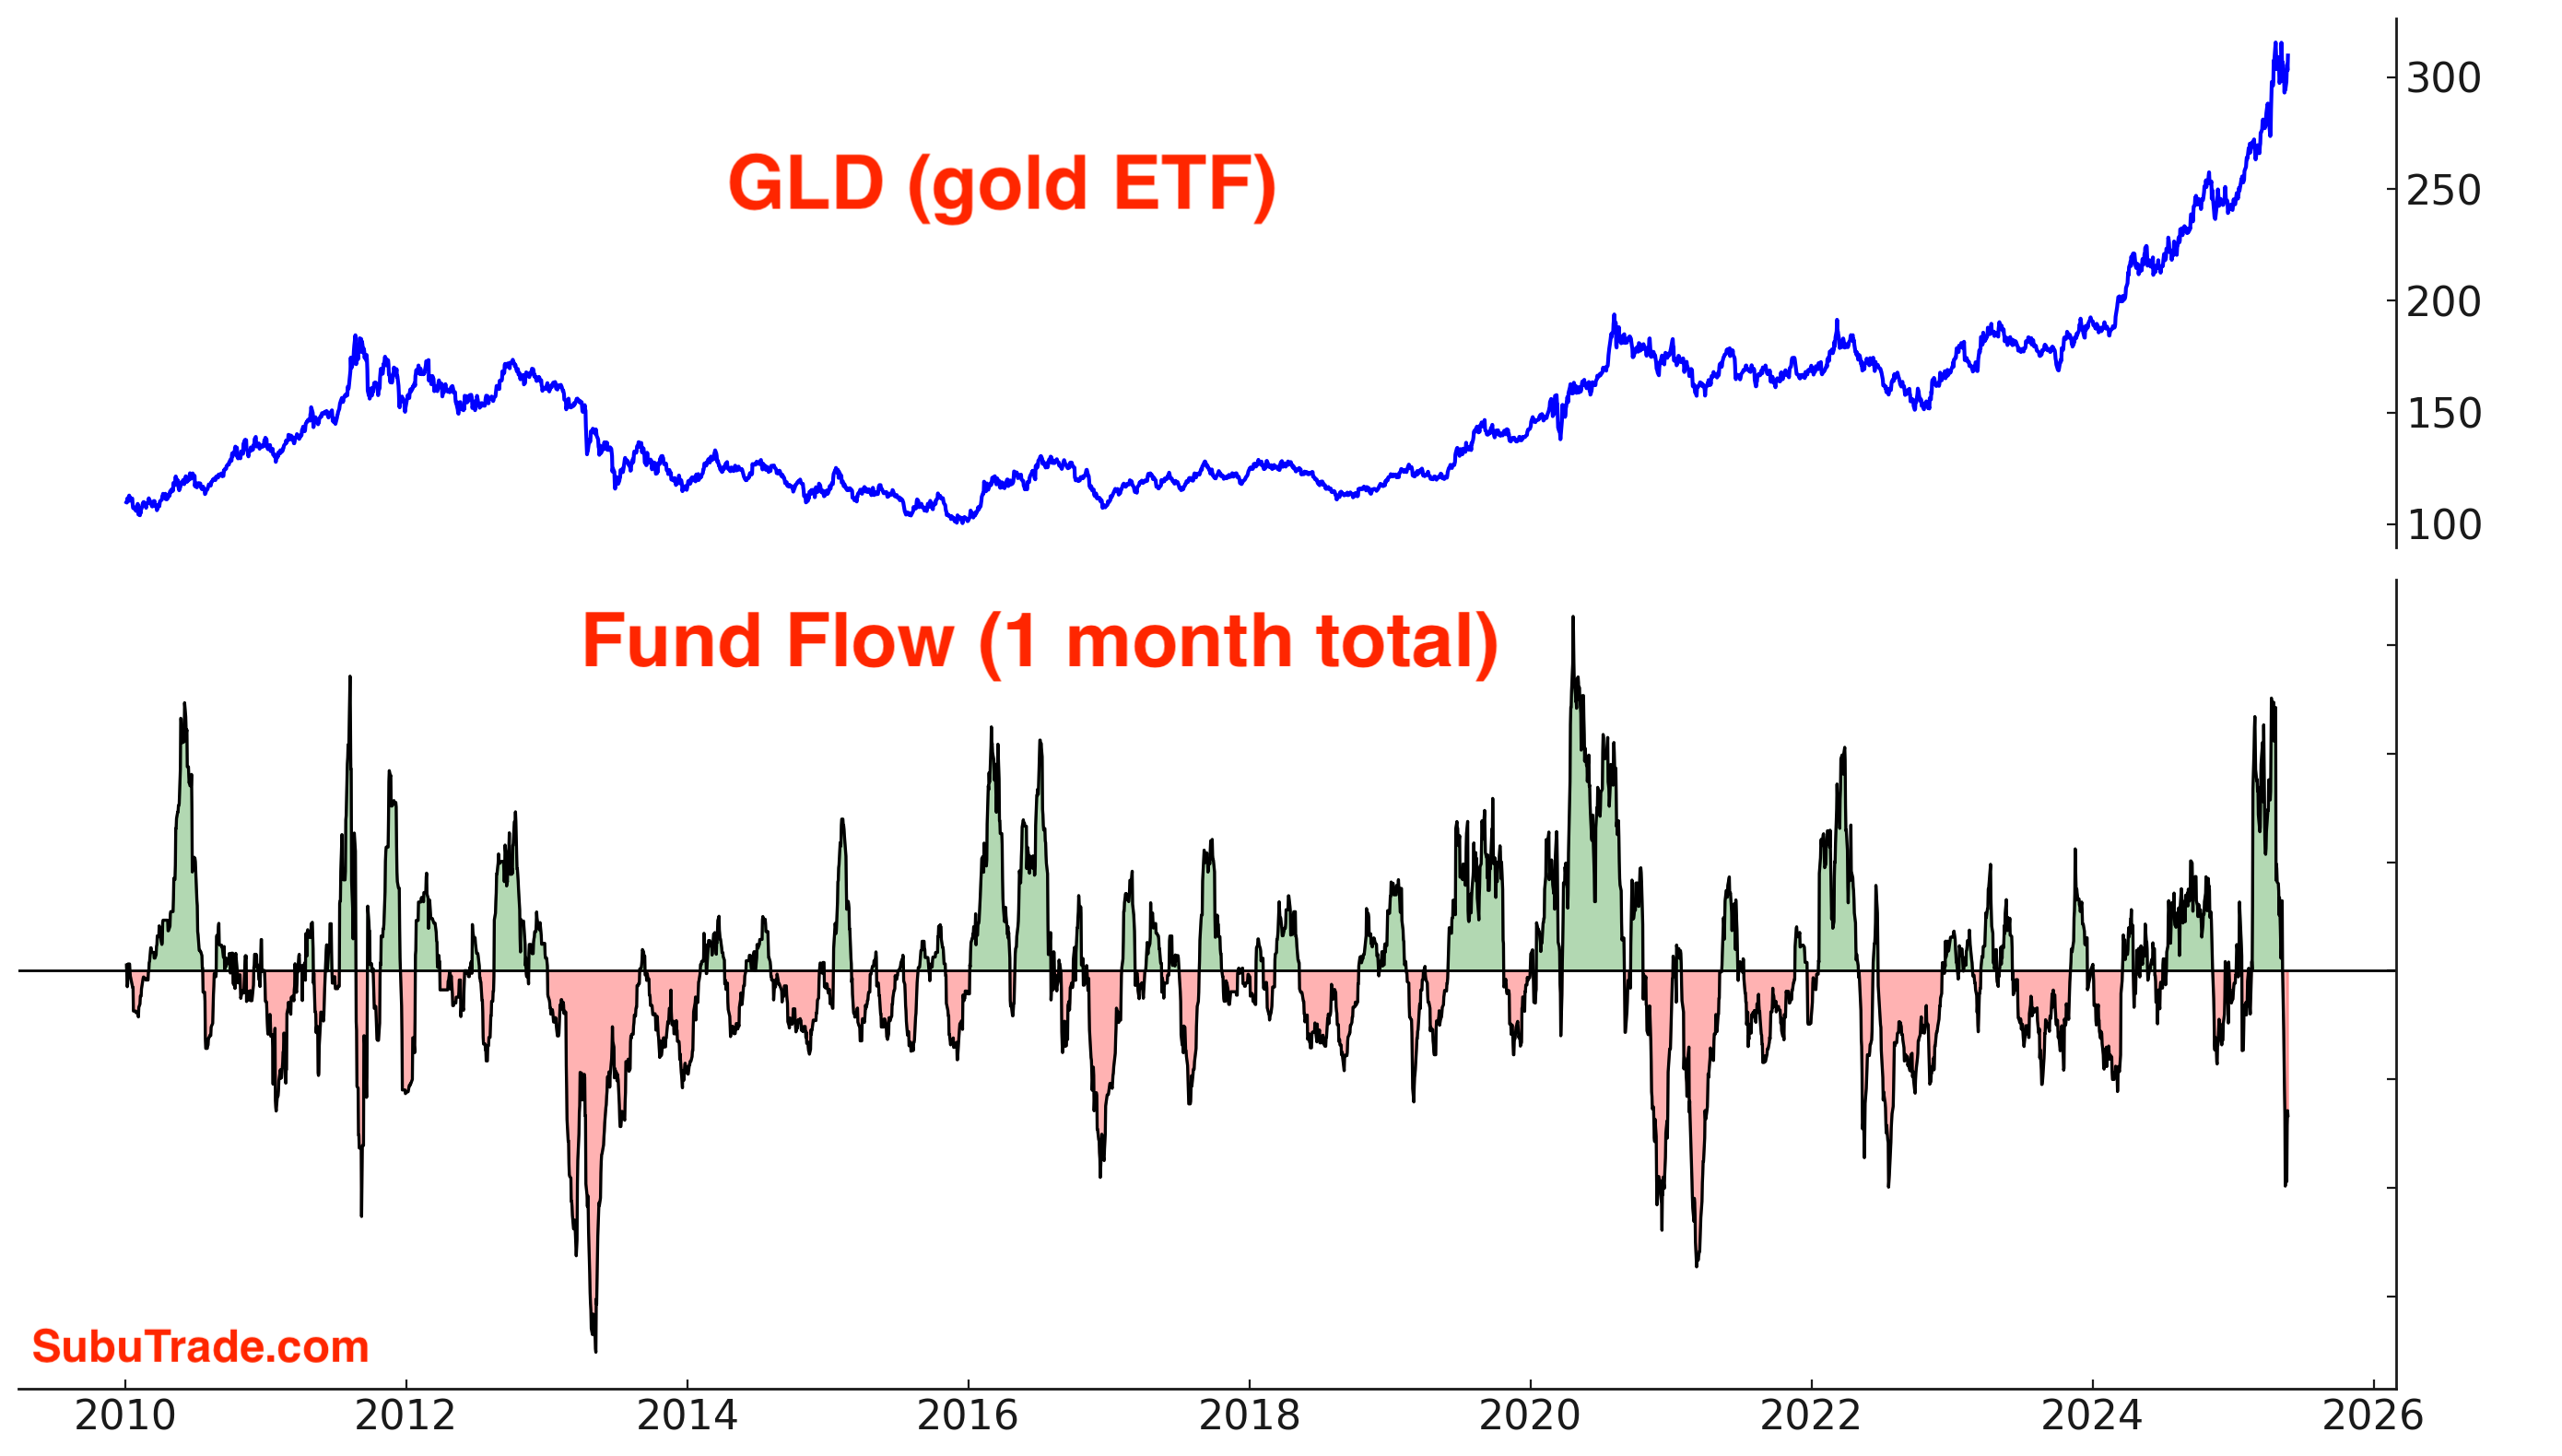
Gold
Gold spiked while stocks crashed last month. Now that stocks are trending higher, gold is struggling. Gold’s consolidation/correction could last weeks, if not months.
Trend
Gold is trending sideways:

Options
After a massive spike, the $ value of GLD calls - puts fell:

Specifically, the $ value of GLD puts spiked before this week’s gold rally:

Fund Flows
GLD’s outflows are slowing down:
Sentiment
Sentiment is in neutral territory.

Energy
Oil prices were hurt this week on fears of rising oil production.
COT Report
Asset Managers are record short energy, while Dealers are extremely long. The last time this happened was during the COVID crash:
XLE Fund Flows
XLE’s outflows have stabilized.

India
I’m bullish on India and believe that this is India’s Century. Trump’s tariffs may bring back some high-end manufacturing to the U.S., but they won’t revive labor-intensive manufacturing. Labor-intensive manufacturing for textiles, electronics etc. will likely move from China to India. India will become a “triple-engined” economy, relying on service exports (office jobs outsourced to India), manufacturing exports, and foreign remittances to grow its economy.
Trend
Indian equities are slowly trending Up. Emphasis on the word “slow”:

Breadth
Here are the % of Nifty 50 stocks above their 200 and 50 day moving averages:

Fund Flows
Indian ETFs are witnessing inflows:

Bonds
Bonds fell this week along with the U.S. Dollar. I continue to believe that bonds will swing in a wide range, as they’ve done since 2023.

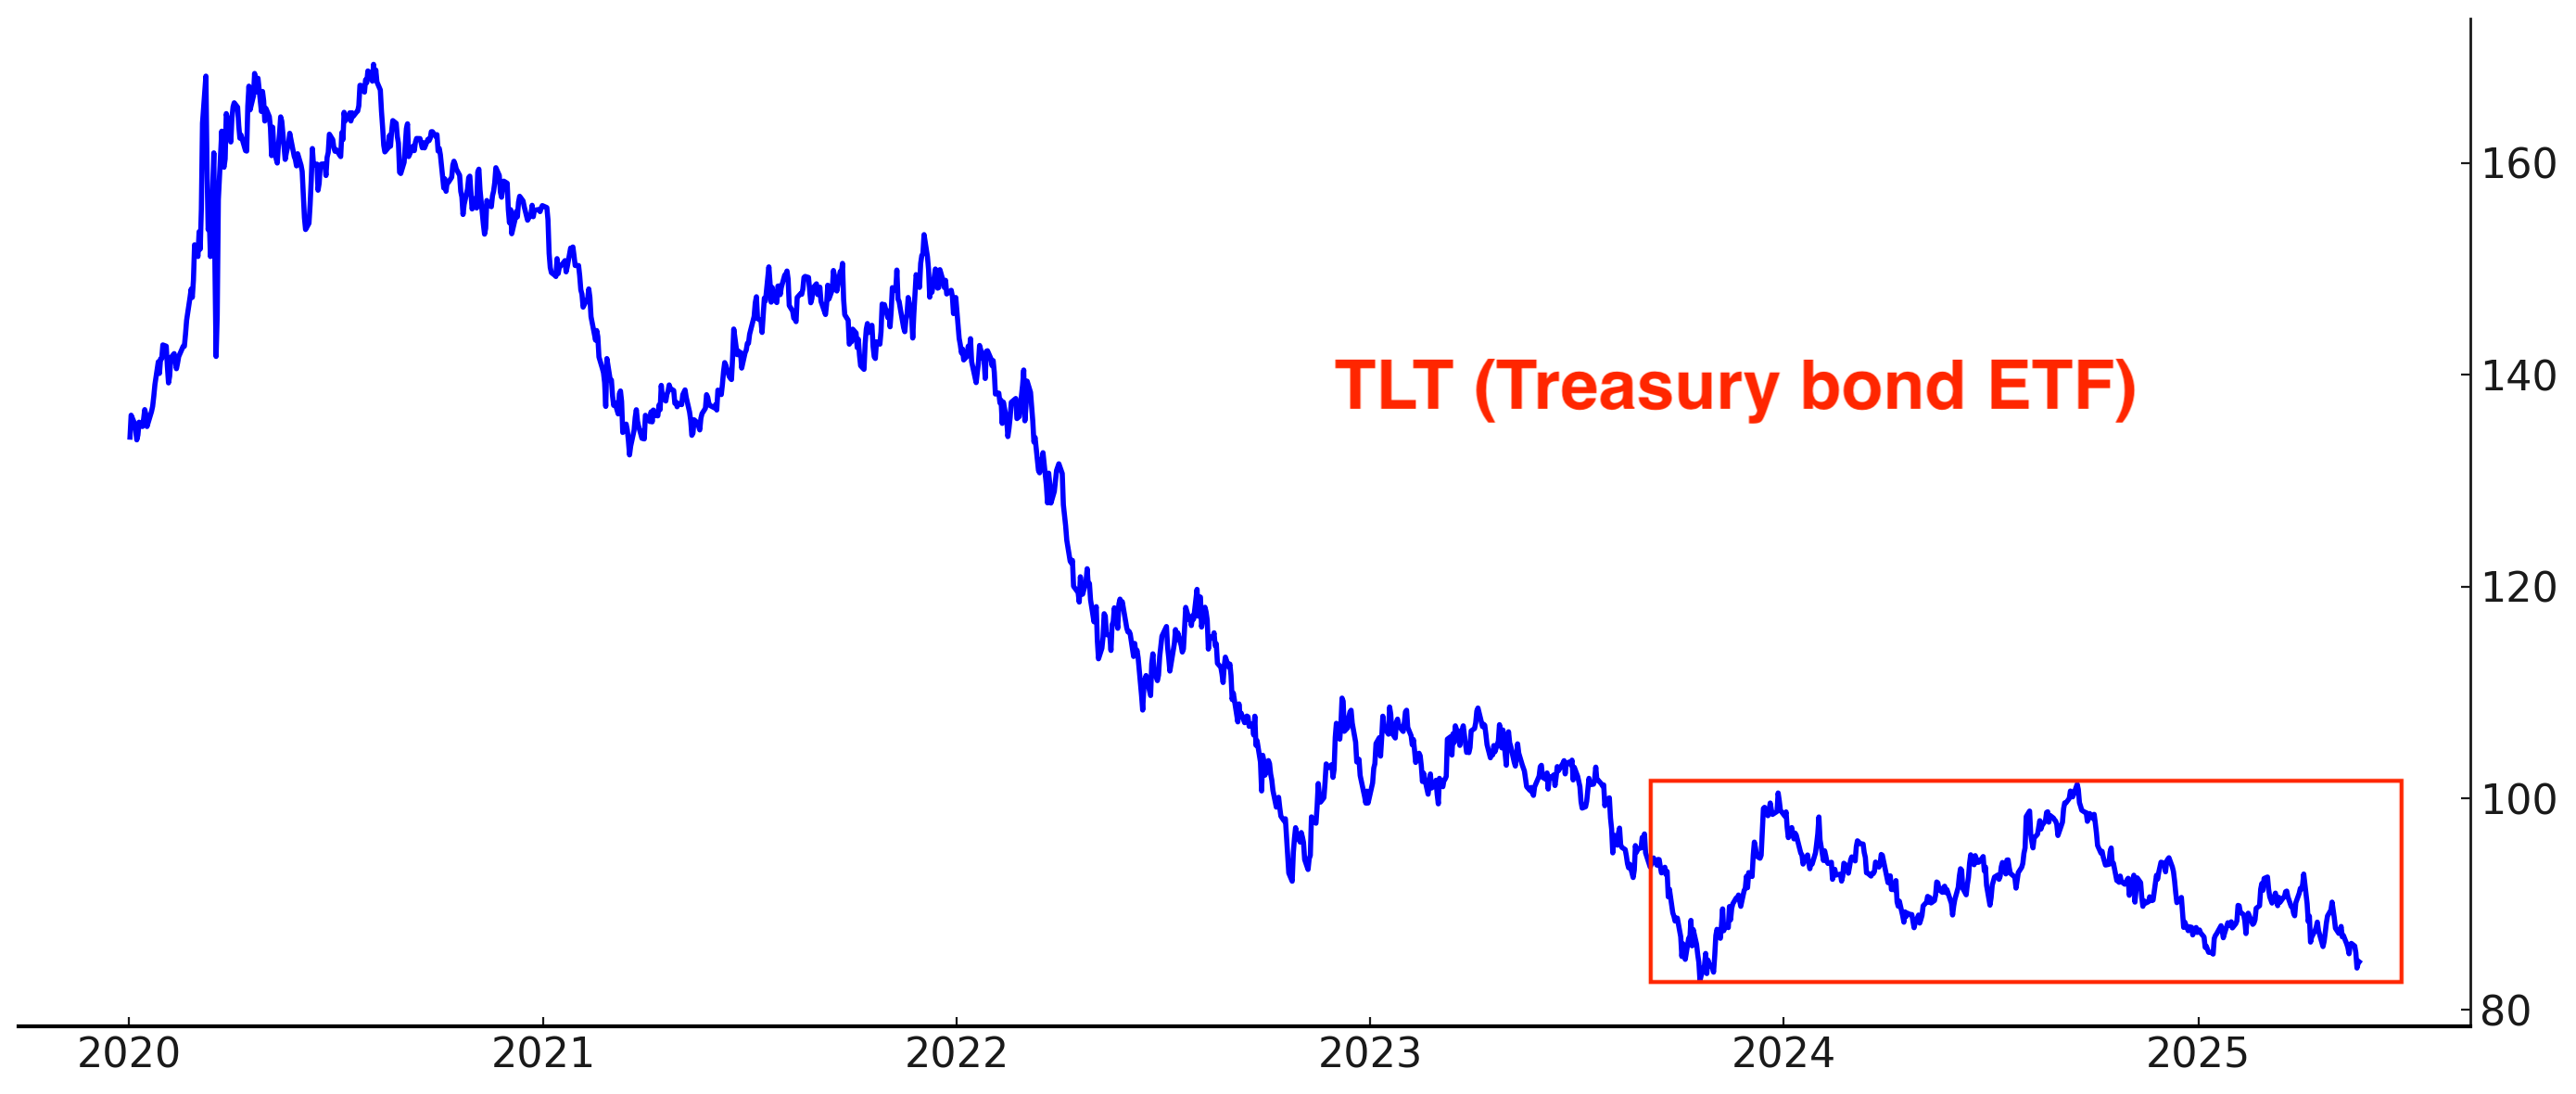
IF bonds break down and yields break out, they will do so in a choppy manner. I.e. if bonds break down, I don’t think it’s a good idea to short them. The price action will not be conducive to shorts!
The theme for rising interest rates is simple: inflationary tariffs + concerns about U.S. borrowing needs. However, this is not enough of a bearish factor that it would cause rates to soar and bonds to crash.
Outside of short-term traders seeking a mean-reversion bounce, I believe that the bond market is best avoided for now. Neither bulls nor bears have an edge here.
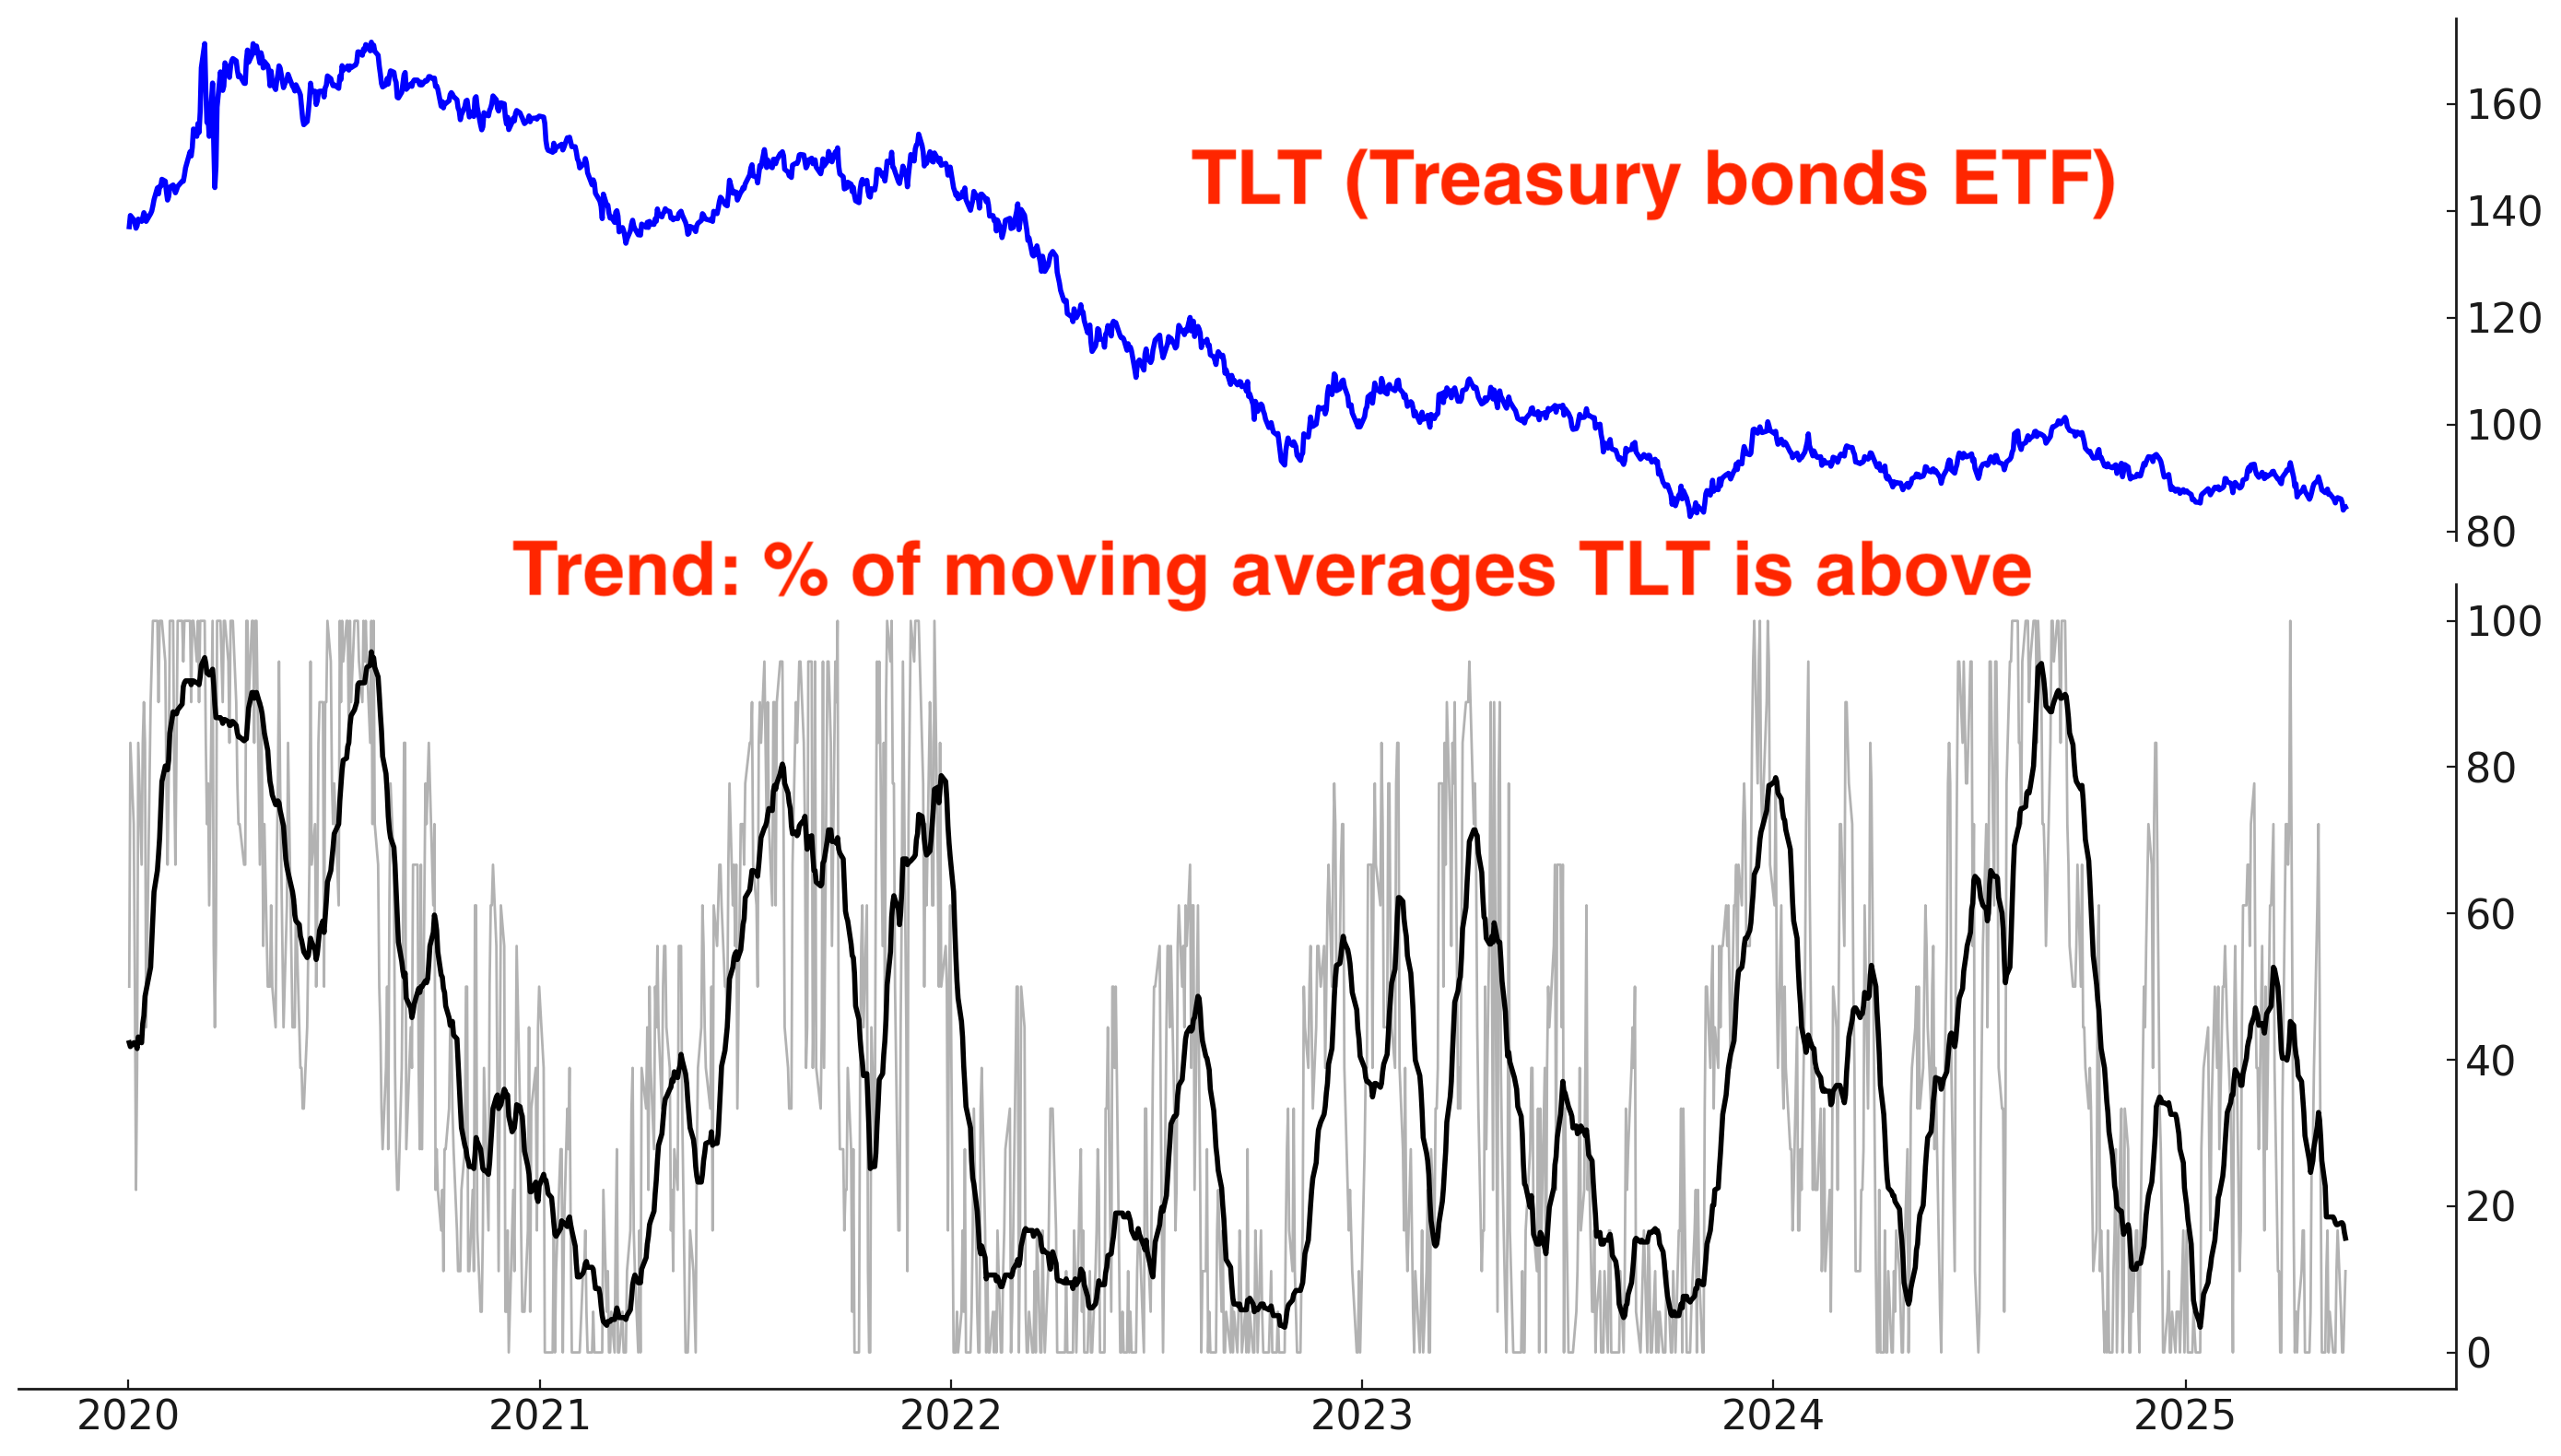
Trend
Sentiment
Sentiment remains in neutral territory:

Fund Flows
The past 2 weeks have seen large inflows into TLT. It seems that a lot of traders are betting on a bond market rally.
*Fund flows aren’t automatically contrarian. It depends on what type of trader is buying/selling and why. Many ETFs—like TLT—are small relative to the underlying market, so fund flows don’t always reflect broad sentiment towards that market.

Currencies
The U.S. Dollar’s rally has been difficult. Despite bottoming in late-April, the Dollar has not rallied significantly along with U.S. equities. This is why I usually do not trade currencies—there are far easier markets to trade!
Trend
The U.S. Dollar tried to trend upwards, but has failed so far:

COT Report
Asset Managers are short the Dollar:

Sentiment
Sentiment leans towards “pessimism”:

I am bullish on the U.S. Dollar (mean-reversion rally), but I do not have a currencies position.
If the U.S. Dollar rallies, will it hurt ETFs of foreign equities priced in U.S. Dollars?
Germany
Massive inflows into EWG (Germany ETF). A rally in the U.S. Dollar will hurt EWG:

Brazil
Massive inflows into Brazil:

Portfolio
Long SPY (S&P 500 ETF). Still the largest position in my portfolio, but is a medium-sized position.
*Bitcoin and U.S. equities move in the same direction.
No position in Gold. Gold could correct/consolidate for weeks/months to work off the recent excess.
Mean-Reversion Position (Non-Core): long energy stocks. Small position size, will increase position if energy stocks fall.
Mean-Reversion Position (Non-Core) - Long Indian Equities: Small position size.
Mean-Reversion Position (Non-Core) – Long U.S. Treasury Bonds: Small position size. Reduced position on Monday’s intraday bounce.
This content is for informational purposes only and is not financial or investment advice. I am not a licensed financial advisor. Trading involves risk, and past performance does not guarantee future results. You are responsible for your own financial decisions, and I am not liable for your decisions.
your focus on mean re version trade somehow down plays risks of regime changes, where deviations may not necessarily lead to mean re version.