
Markets Report: pullback ahead?
Stocks are approaching all-time highs. Is a pullback ahead?

Stocks pushed higher this week, with the S&P 500 just a few percent below its all-time high. Is a pullback ahead?

In this Markets Report I’ll share my outlook for stocks, Bitcoin, gold, energy, bonds, and currencies.
U.S. Equities
Stocks gapped up on Monday, with the S&P 500 and NASDAQ 100 finishing the session above their 200-day moving averages. Notably, this marks the NASDAQ 100's first close above this key moving average since early March—a development that has historically signaled a positive outlook for equities in the months ahead.


Breadth Thrusts
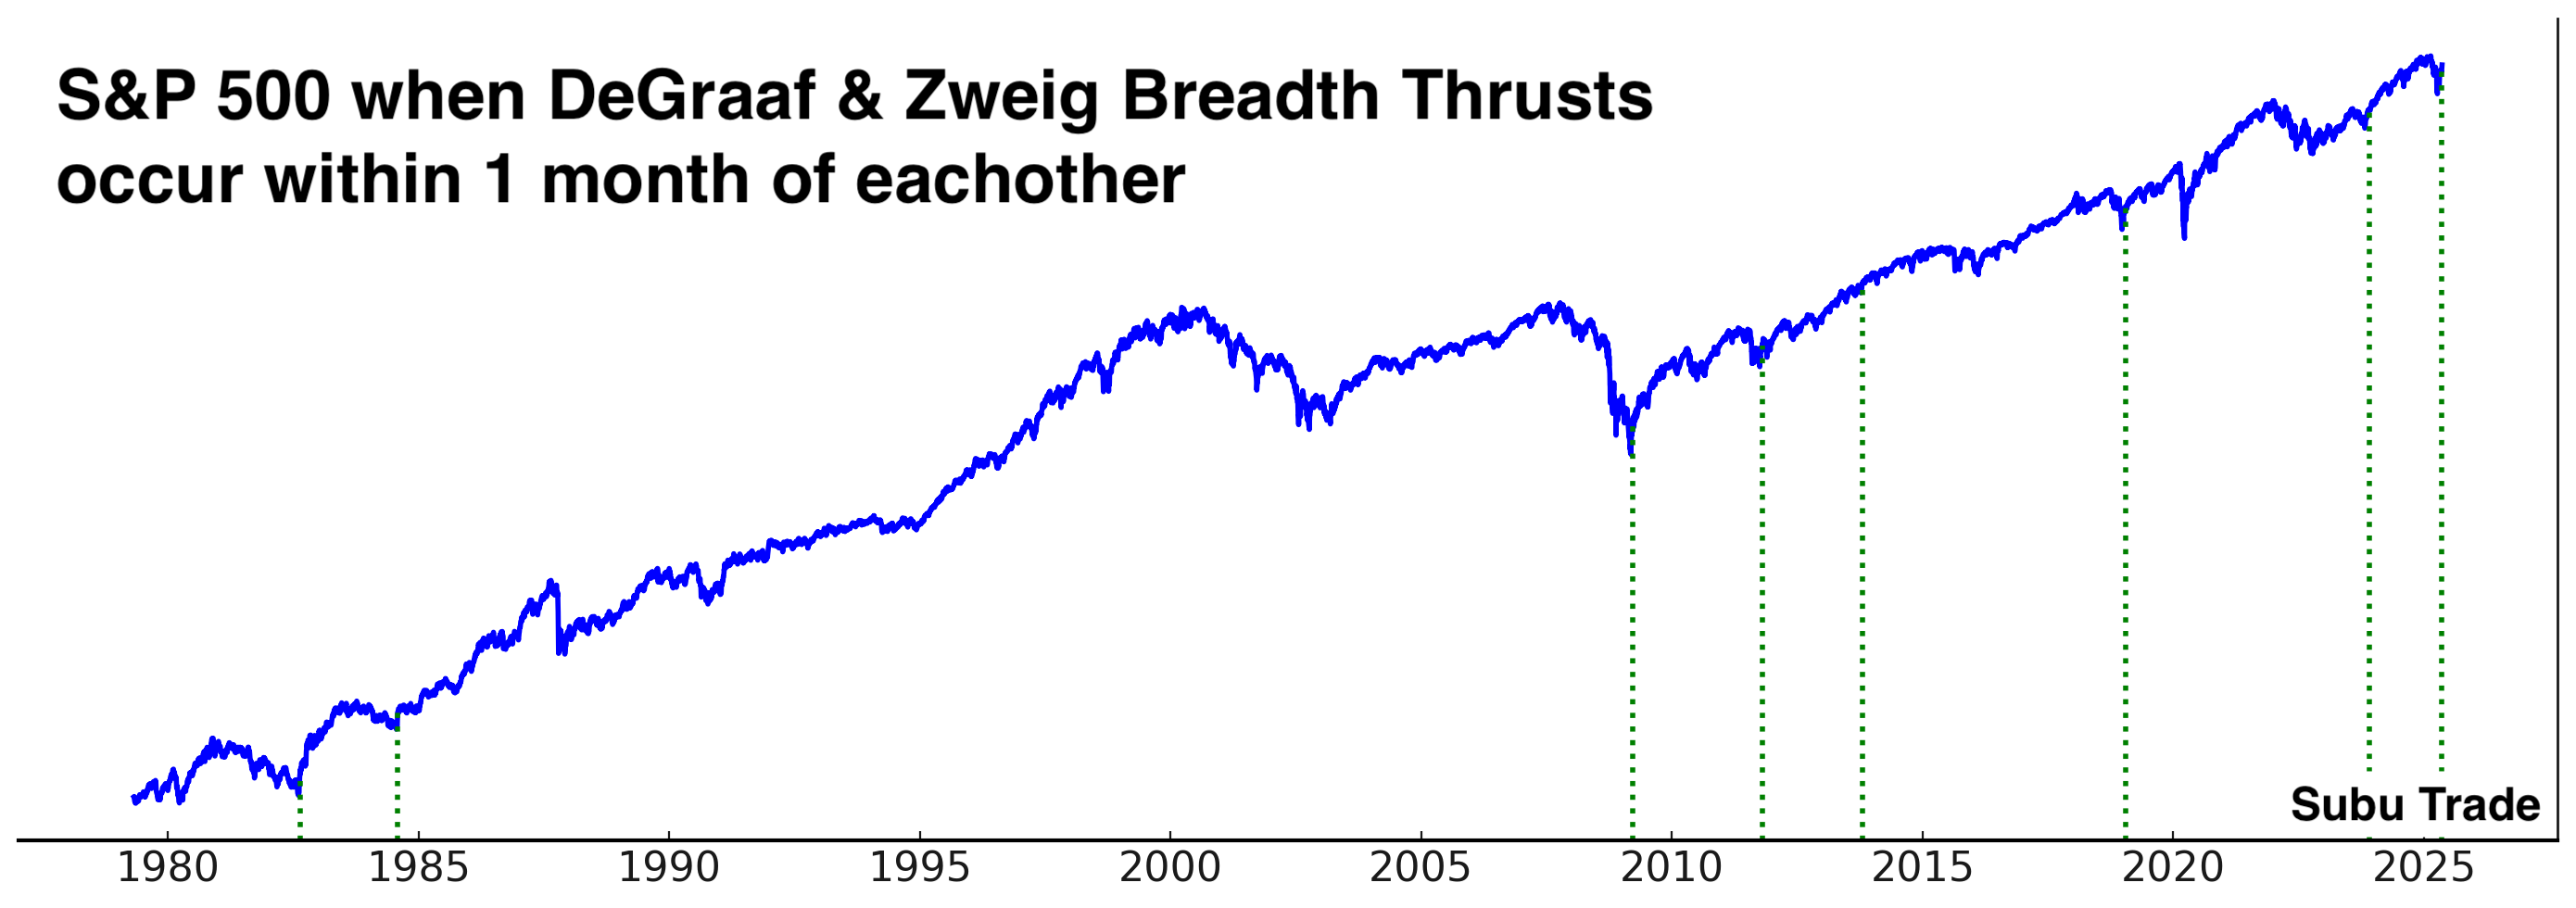
Monday’s gap up saw 58% of S&P 500 stocks close at a 20 day high. When more than 55% of S&P 500 stocks close at a 20 day high, that’s known as a “DeGraaf Breadth Thrust”.


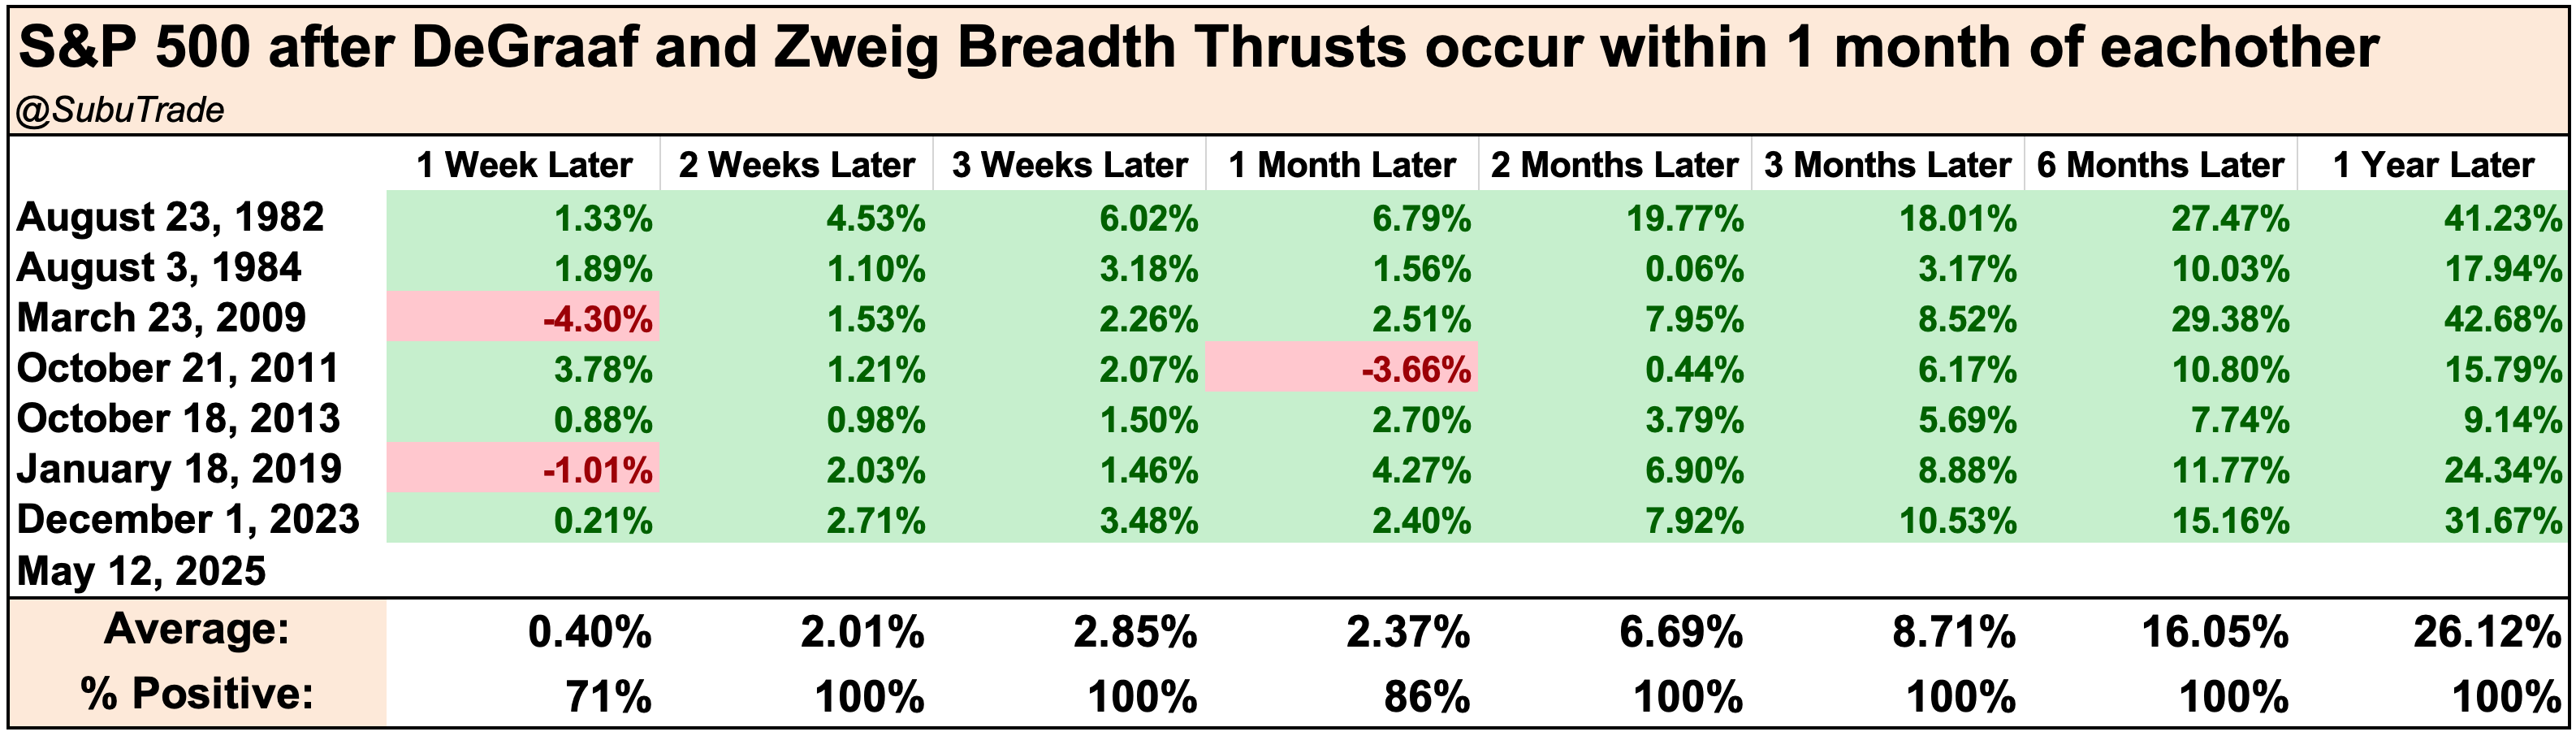
We got a Zweig Breadth Thrust 3 weeks ago. Here’s what happens when a DeGraaf + Zweig Breadth Thrust occur within a month of eachother:
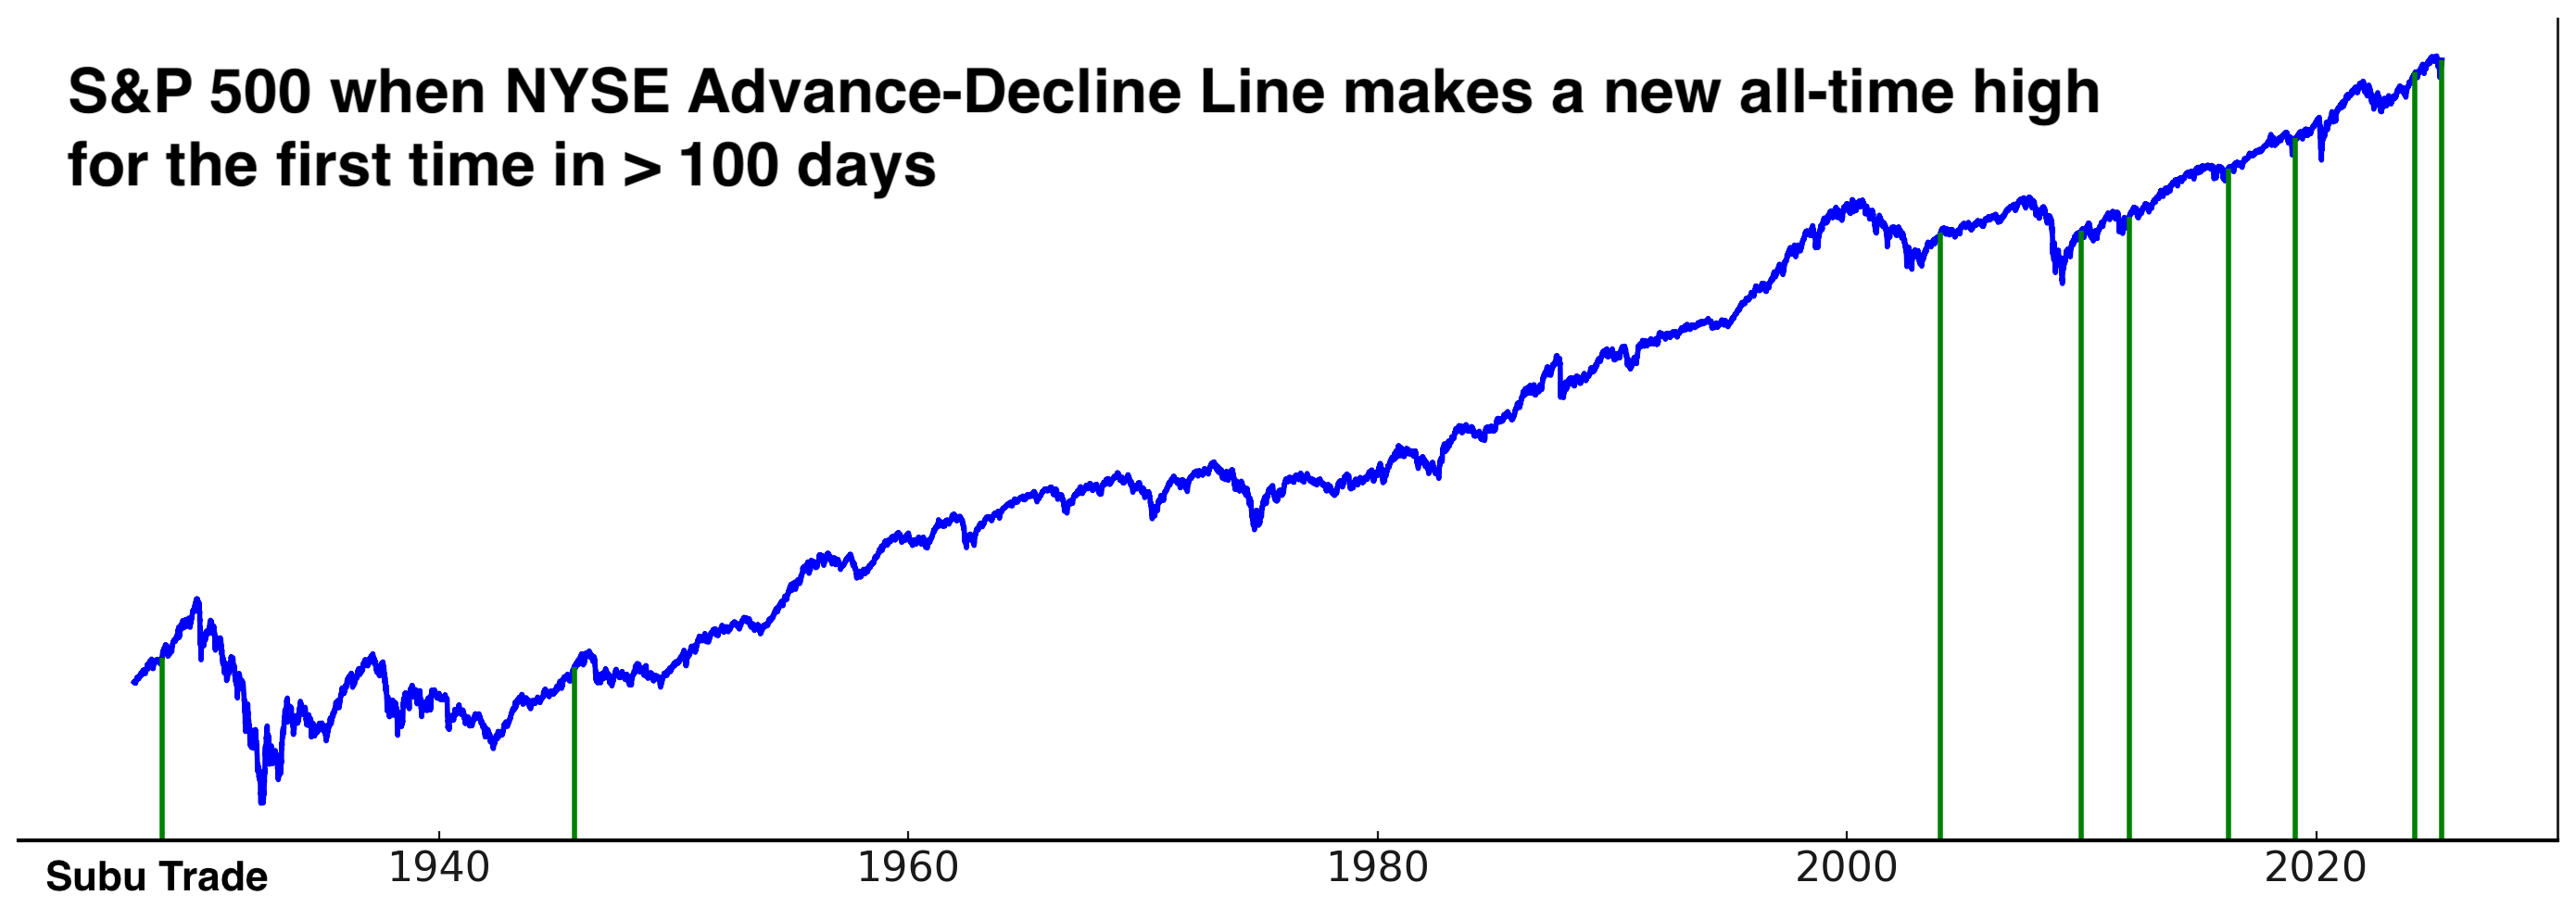
This week’s rally saw the NYSE Advance-Decline Line make a new all-time high on Tuesday. The Advance-Decline Line has been leading stocks higher:


Volatility falling & the case for a stock market pullback
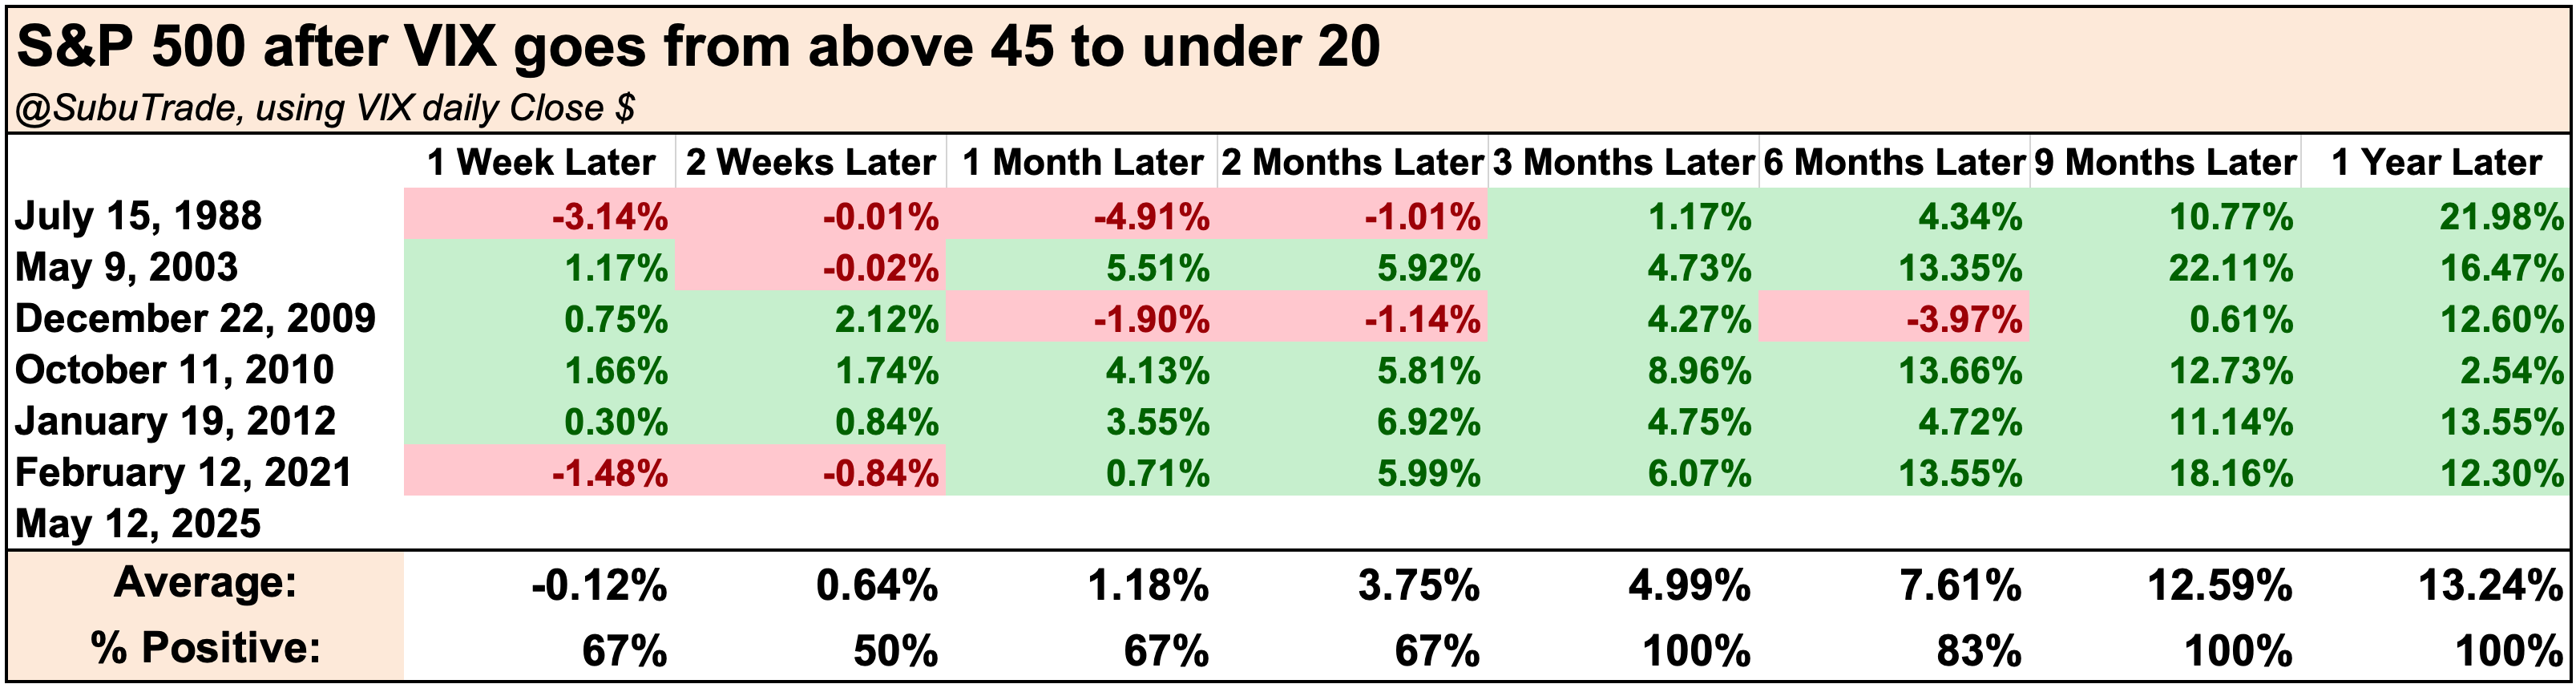
While stocks are rallying, volatility is falling. VIX fell below 20 on Monday. This tends to be bullish for stocks over the coming months.
However, the case can be made for a quick pullback. VIX is down 6 weeks in a row:


Moreover, breadth has been so strong that Tuesday saw more than 24% of NASDAQ 100 stocks in overbought territory (14 day RSI > 70).

This has been short term bearish for tech stocks, particularly since COVID:

Predicting short-term pullbacks is difficult. Traders frequently call for a “3% pullback,” only to see the market rally 5% first and then decline by 3%. By the time the pullback occurs, prices are still higher than when the original prediction was made!
Other breadth
Here are the % of S&P 500 stocks above their 200 and 50 day moving averages:

Here are the % of NASDAQ 100 stocks above their 200 and 50 day moving averages:

Options
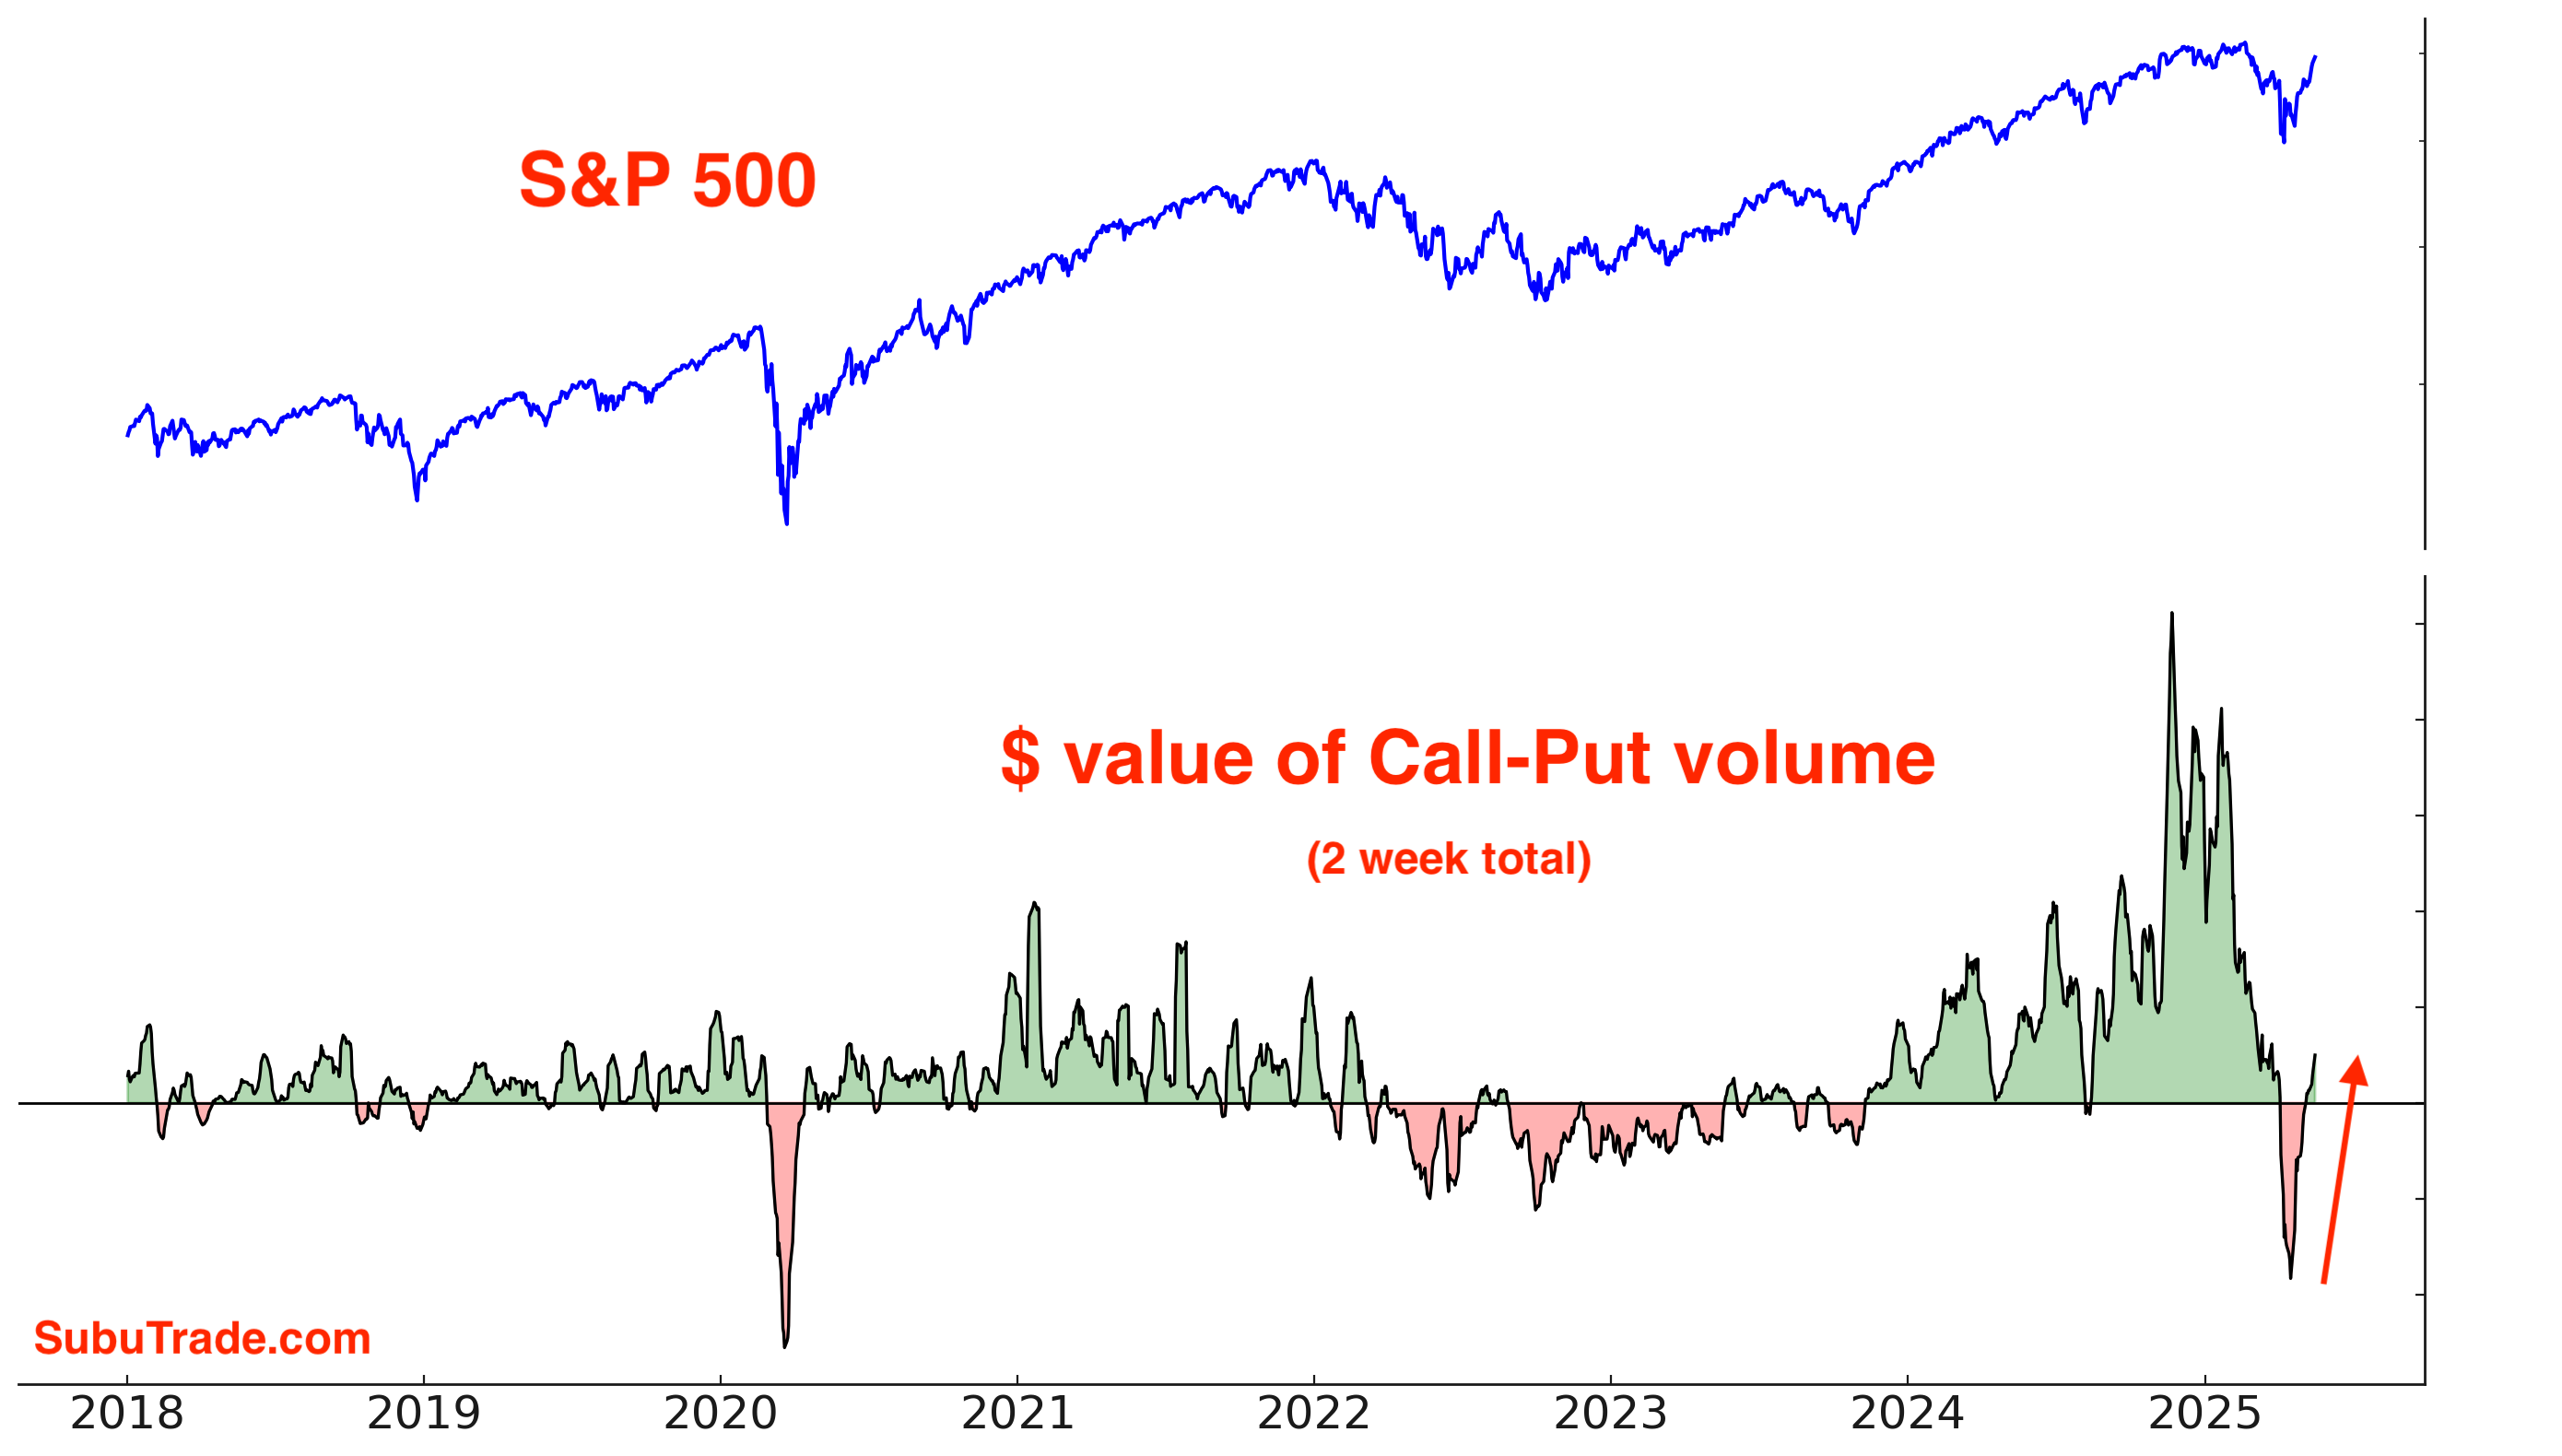
Bullish options traders are making a comeback. The $ value of SPX Call volume - Put volume is once again positive:
The CBOE’s Total Put/Call Ratio is falling:

Gamma Exposure (from SqueezeMetrics) is up:

Fund Flows
VIX ETF traders tend to be contrarian: they sell and take profits when VIX spikes, and buy when VIX falls (in anticipation of a VIX spike).
VIX ETFs are seeing inflows as these contrarian traders bet on a stock market pullback + jump in volatility:

Sentiment Surveys
Sentiment is rebounding from extreme pessimism.
Investors Intelligence Bulls-Bears has finally climbed above 0%:

For the first time after 11 weeks, AAII Bears fell below 50%. Bearish sentiment is falling:

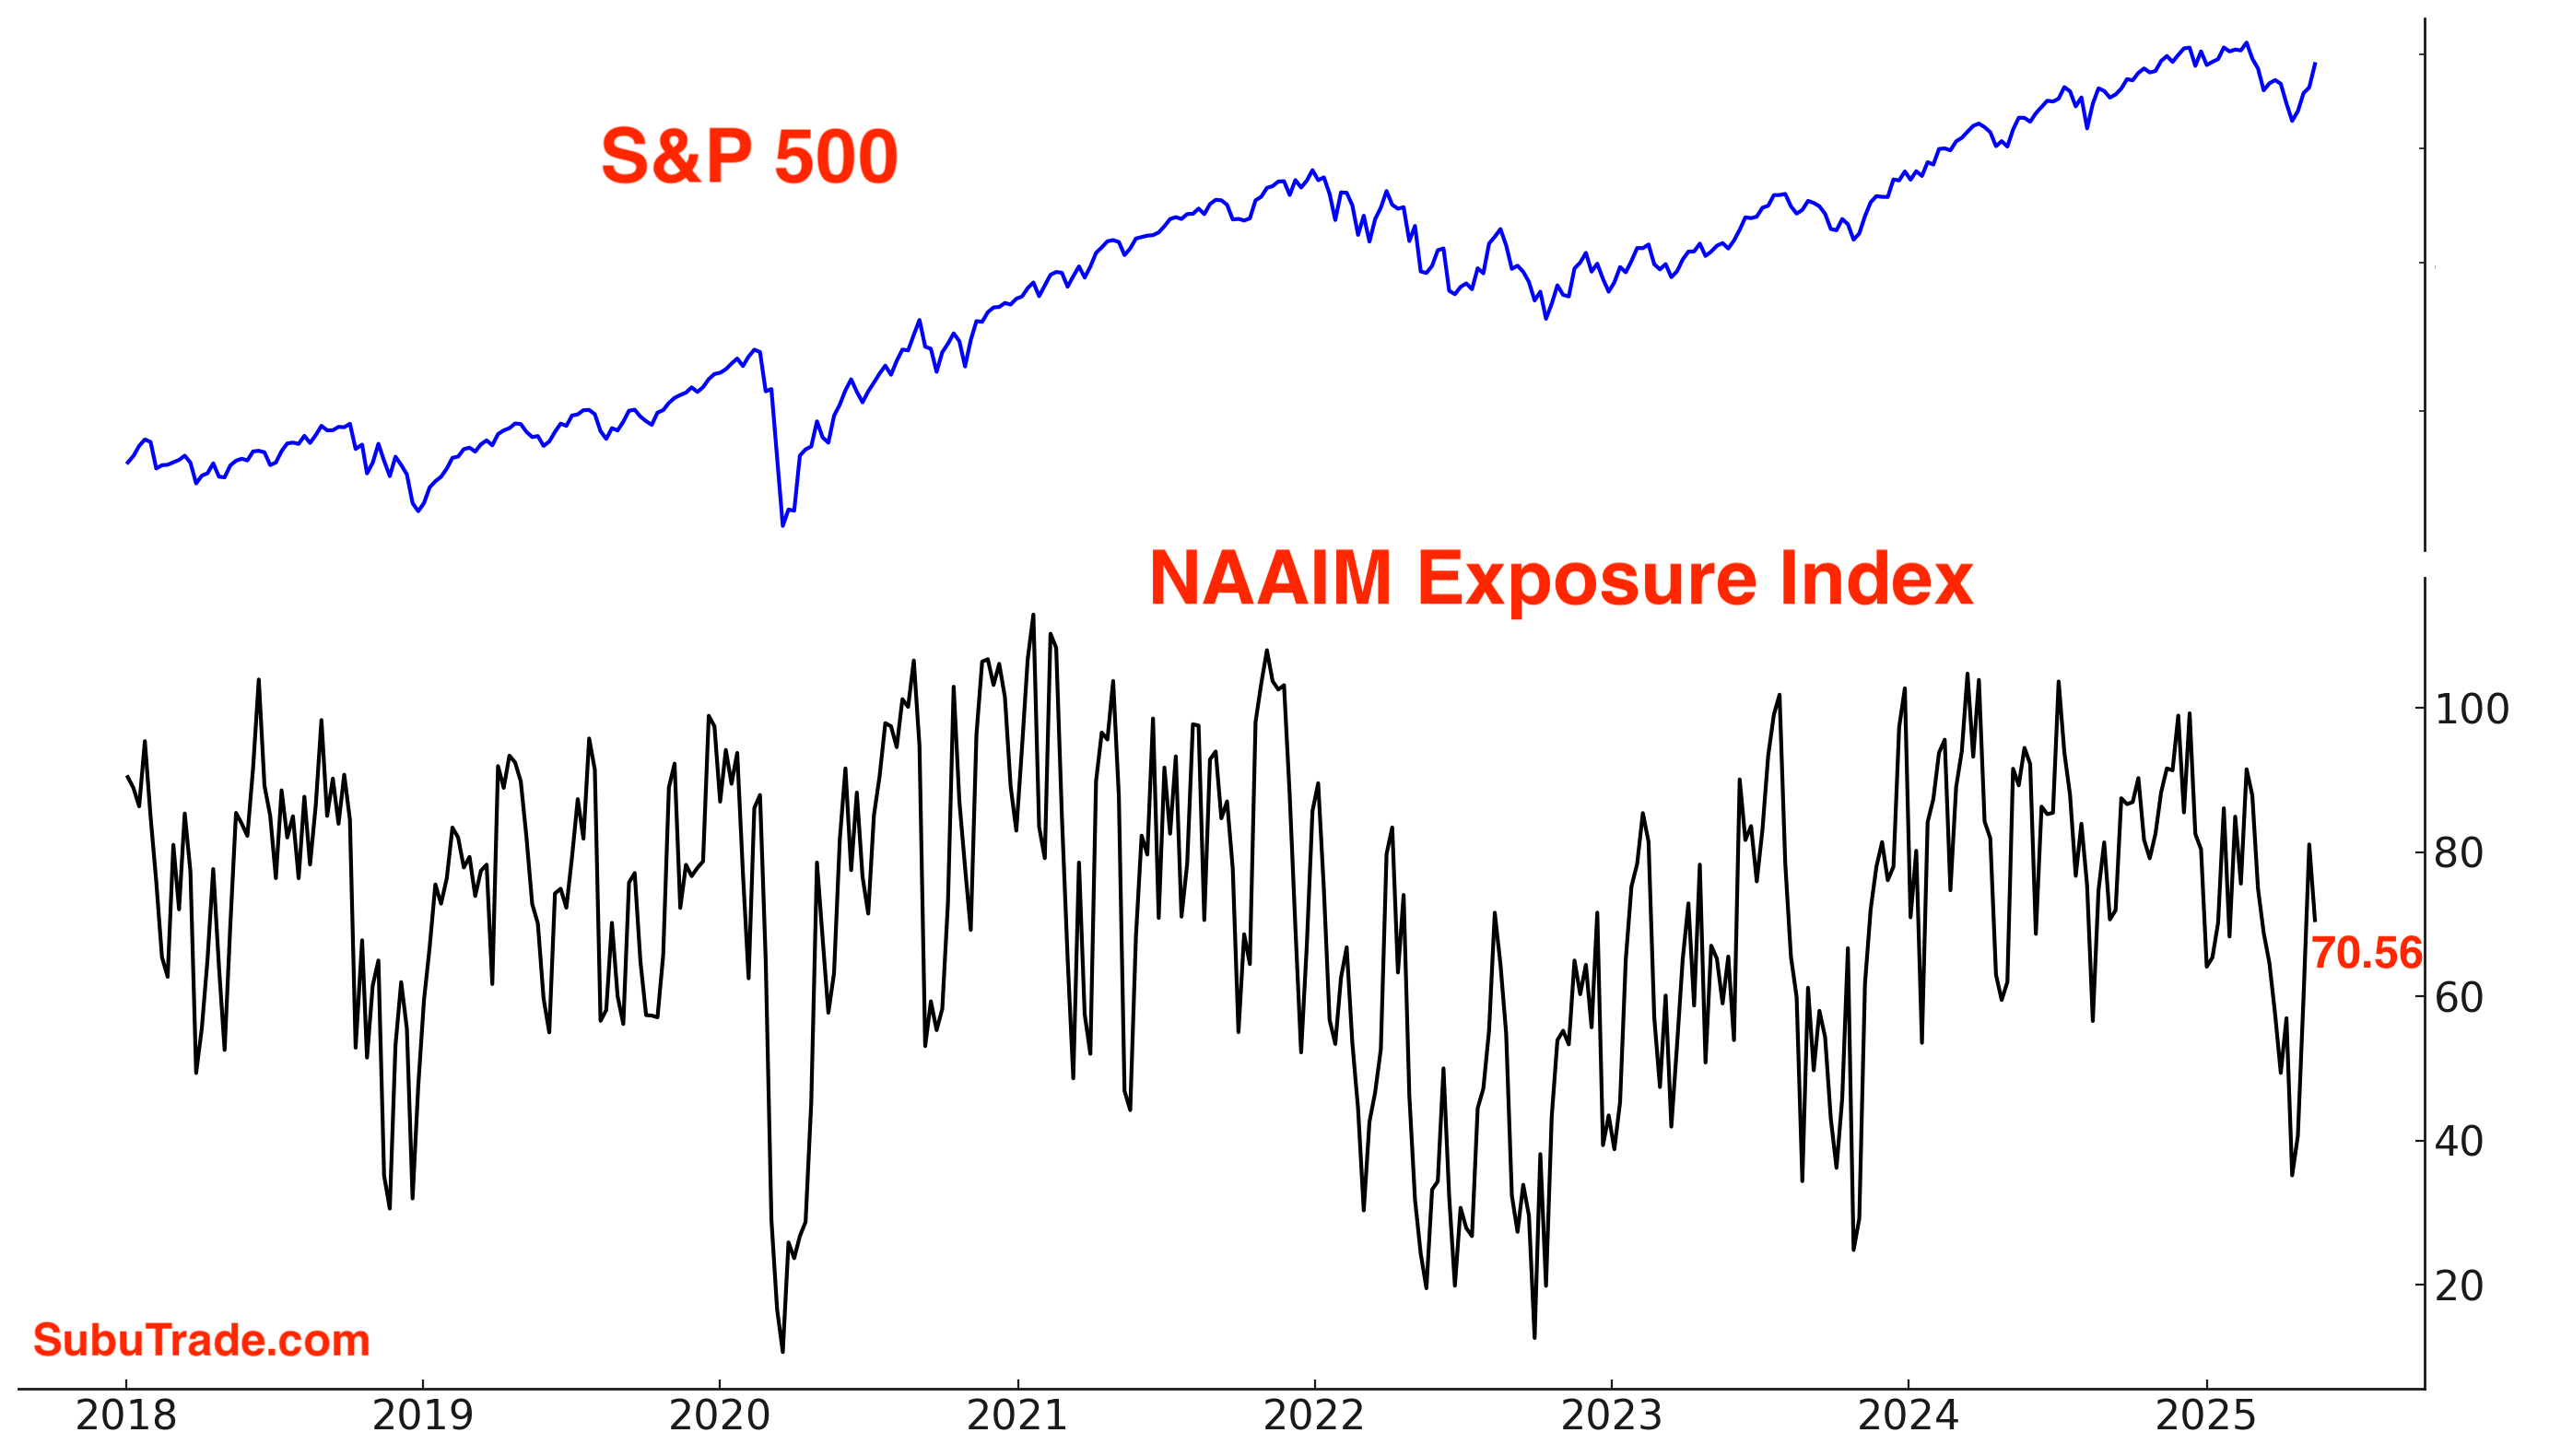
It’s surprising to see that the NAAIM Exposure Index fell a little this week. Active Investment Managers are less bullish than retail investors. The past month saw retail aggressively buy the dip, while institutional investors were more cautious.
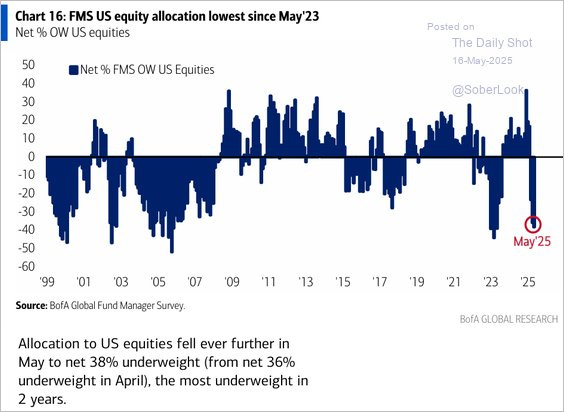
Here’s another interest chart to illustrate this point. Fund Managers remain extremely underweight equities:
Other sentiment
CNN Fear & Greed is in “greed” territory:

S&P 500 Daily Sentiment Index:

NASDAQ Daily Sentiment Index:

COT Report
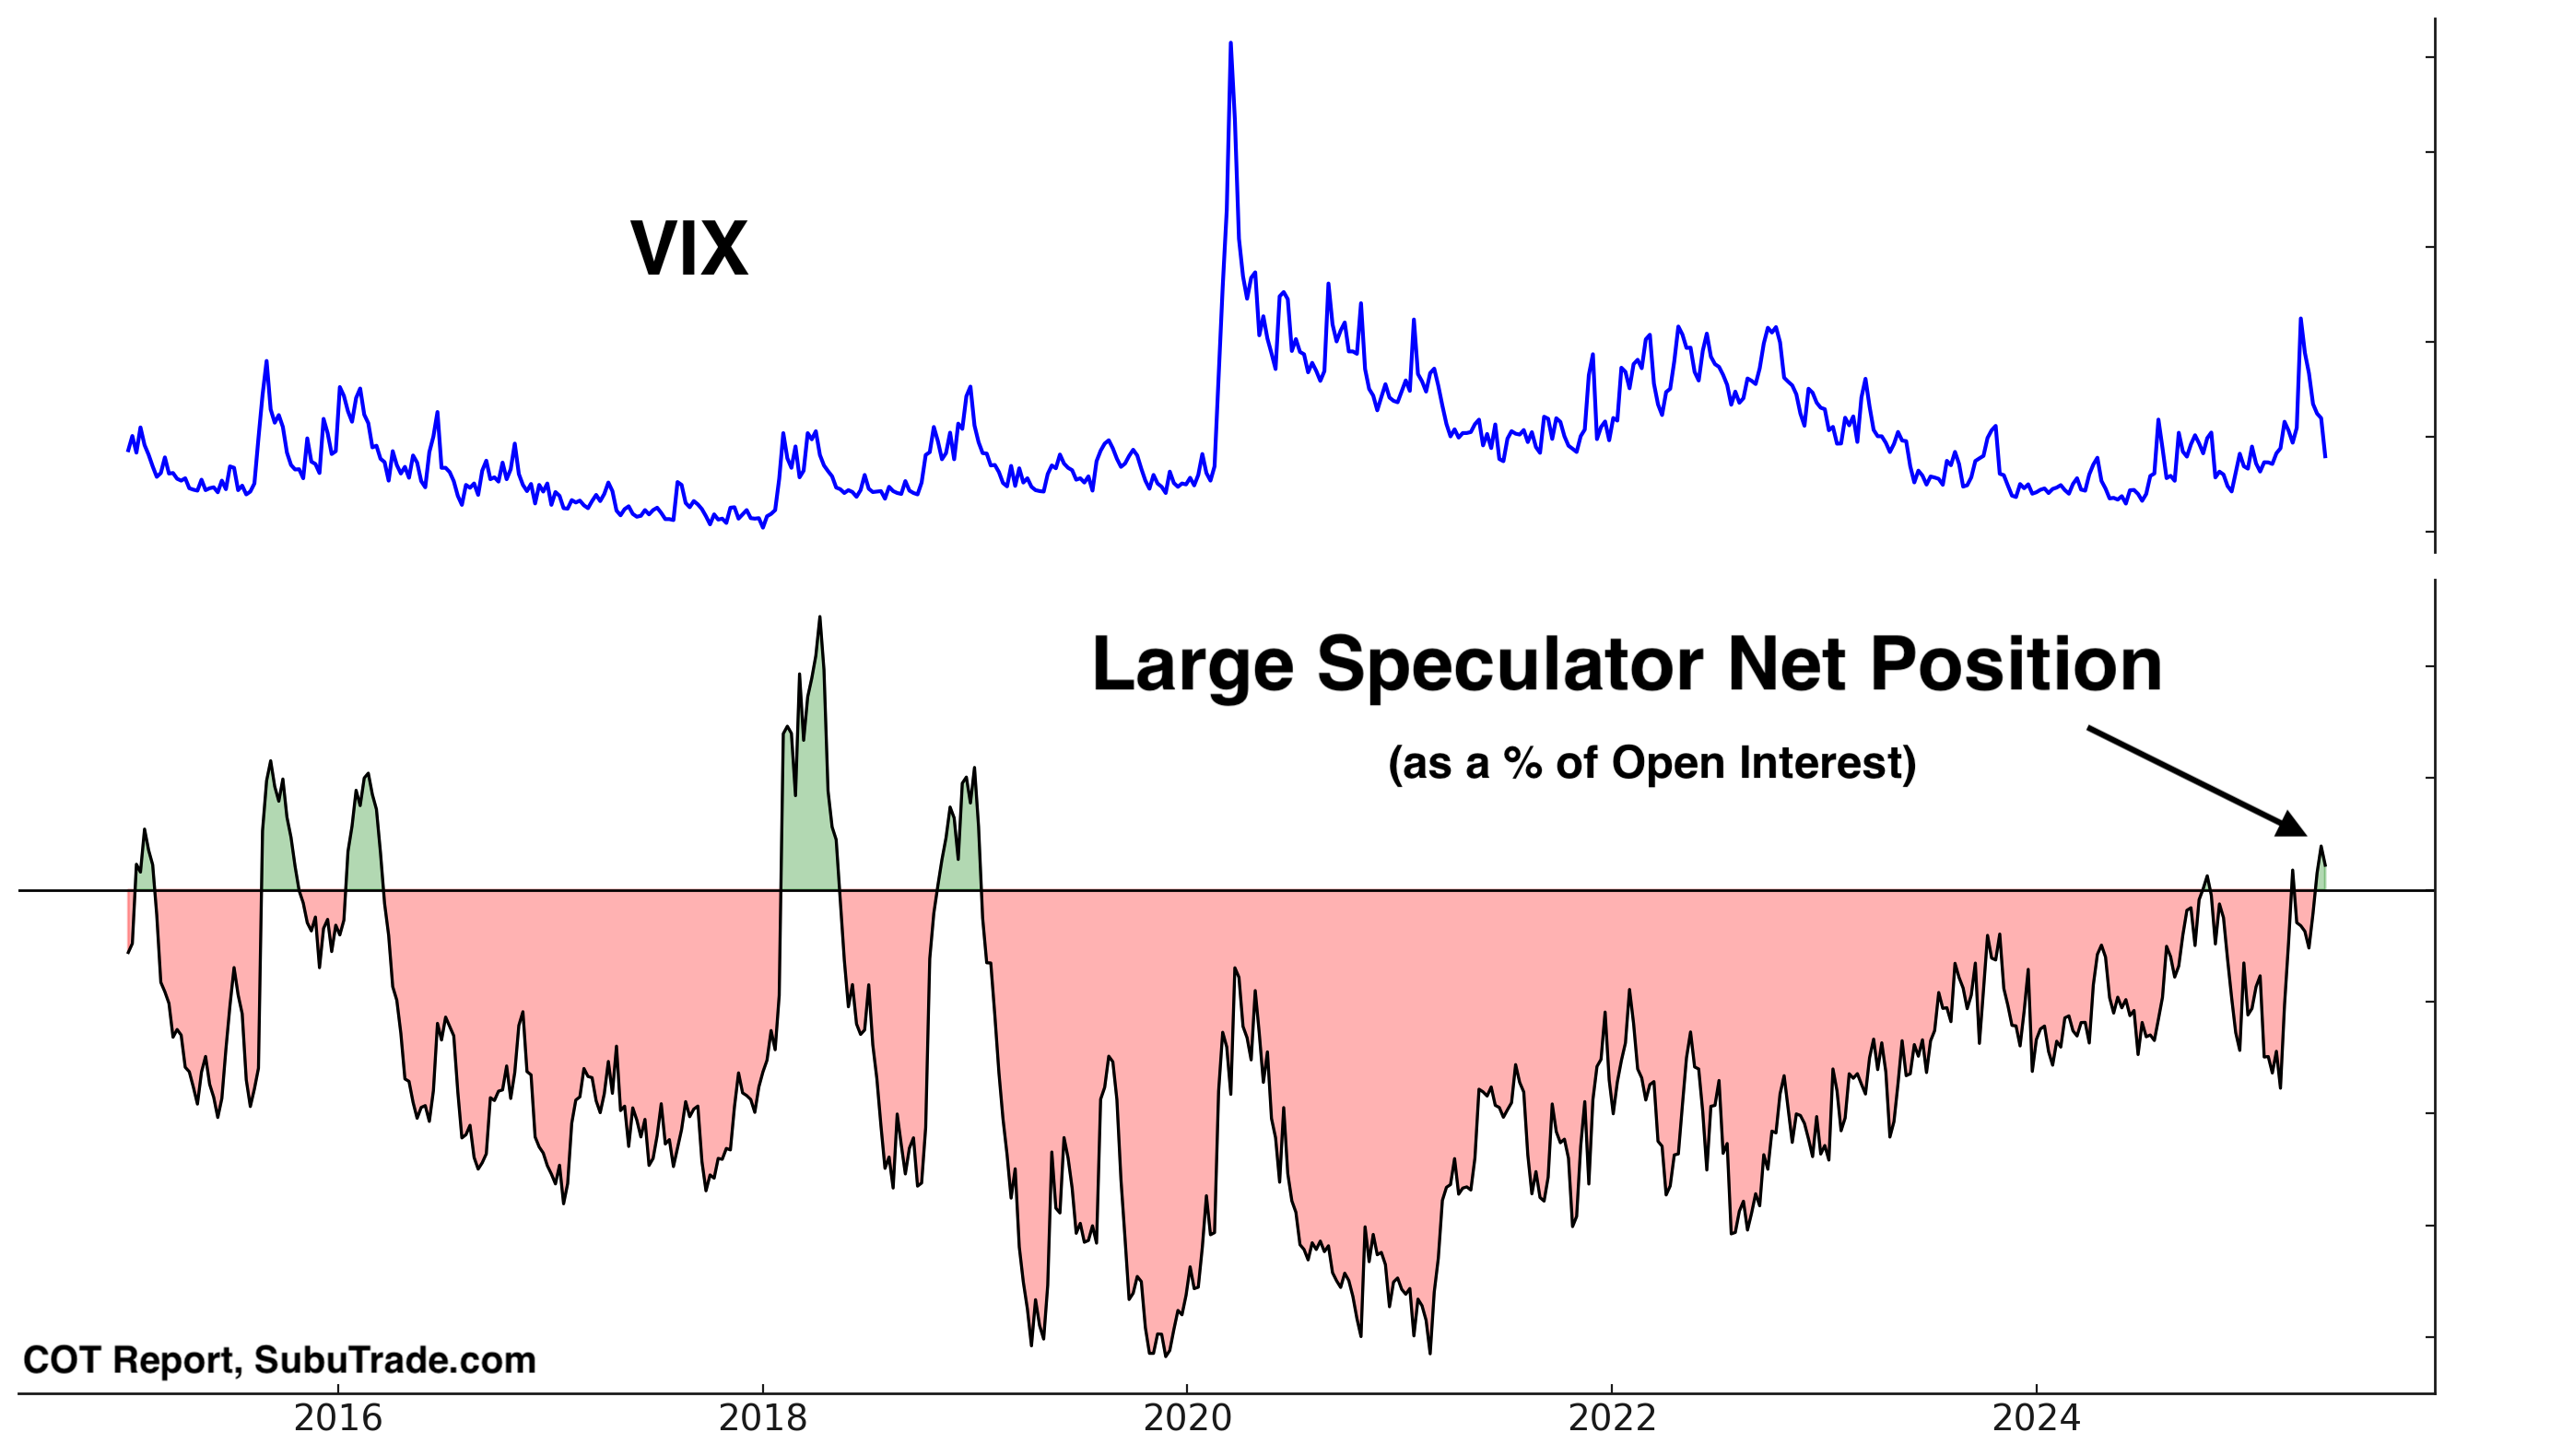
The latest COT Report demonstrates that Large Speculators are still net long VIX futures:
While Commercials are still net short:

Corporate Insiders
After pausing sales during April’s market decline, corporate insiders have resumed selling as equities approach all-time highs. The Corporate Insider Buy/Sell Ratio is falling:

Here’s the same chart, using a log scale for the Insider Buy/Sell Ratio:

Trend
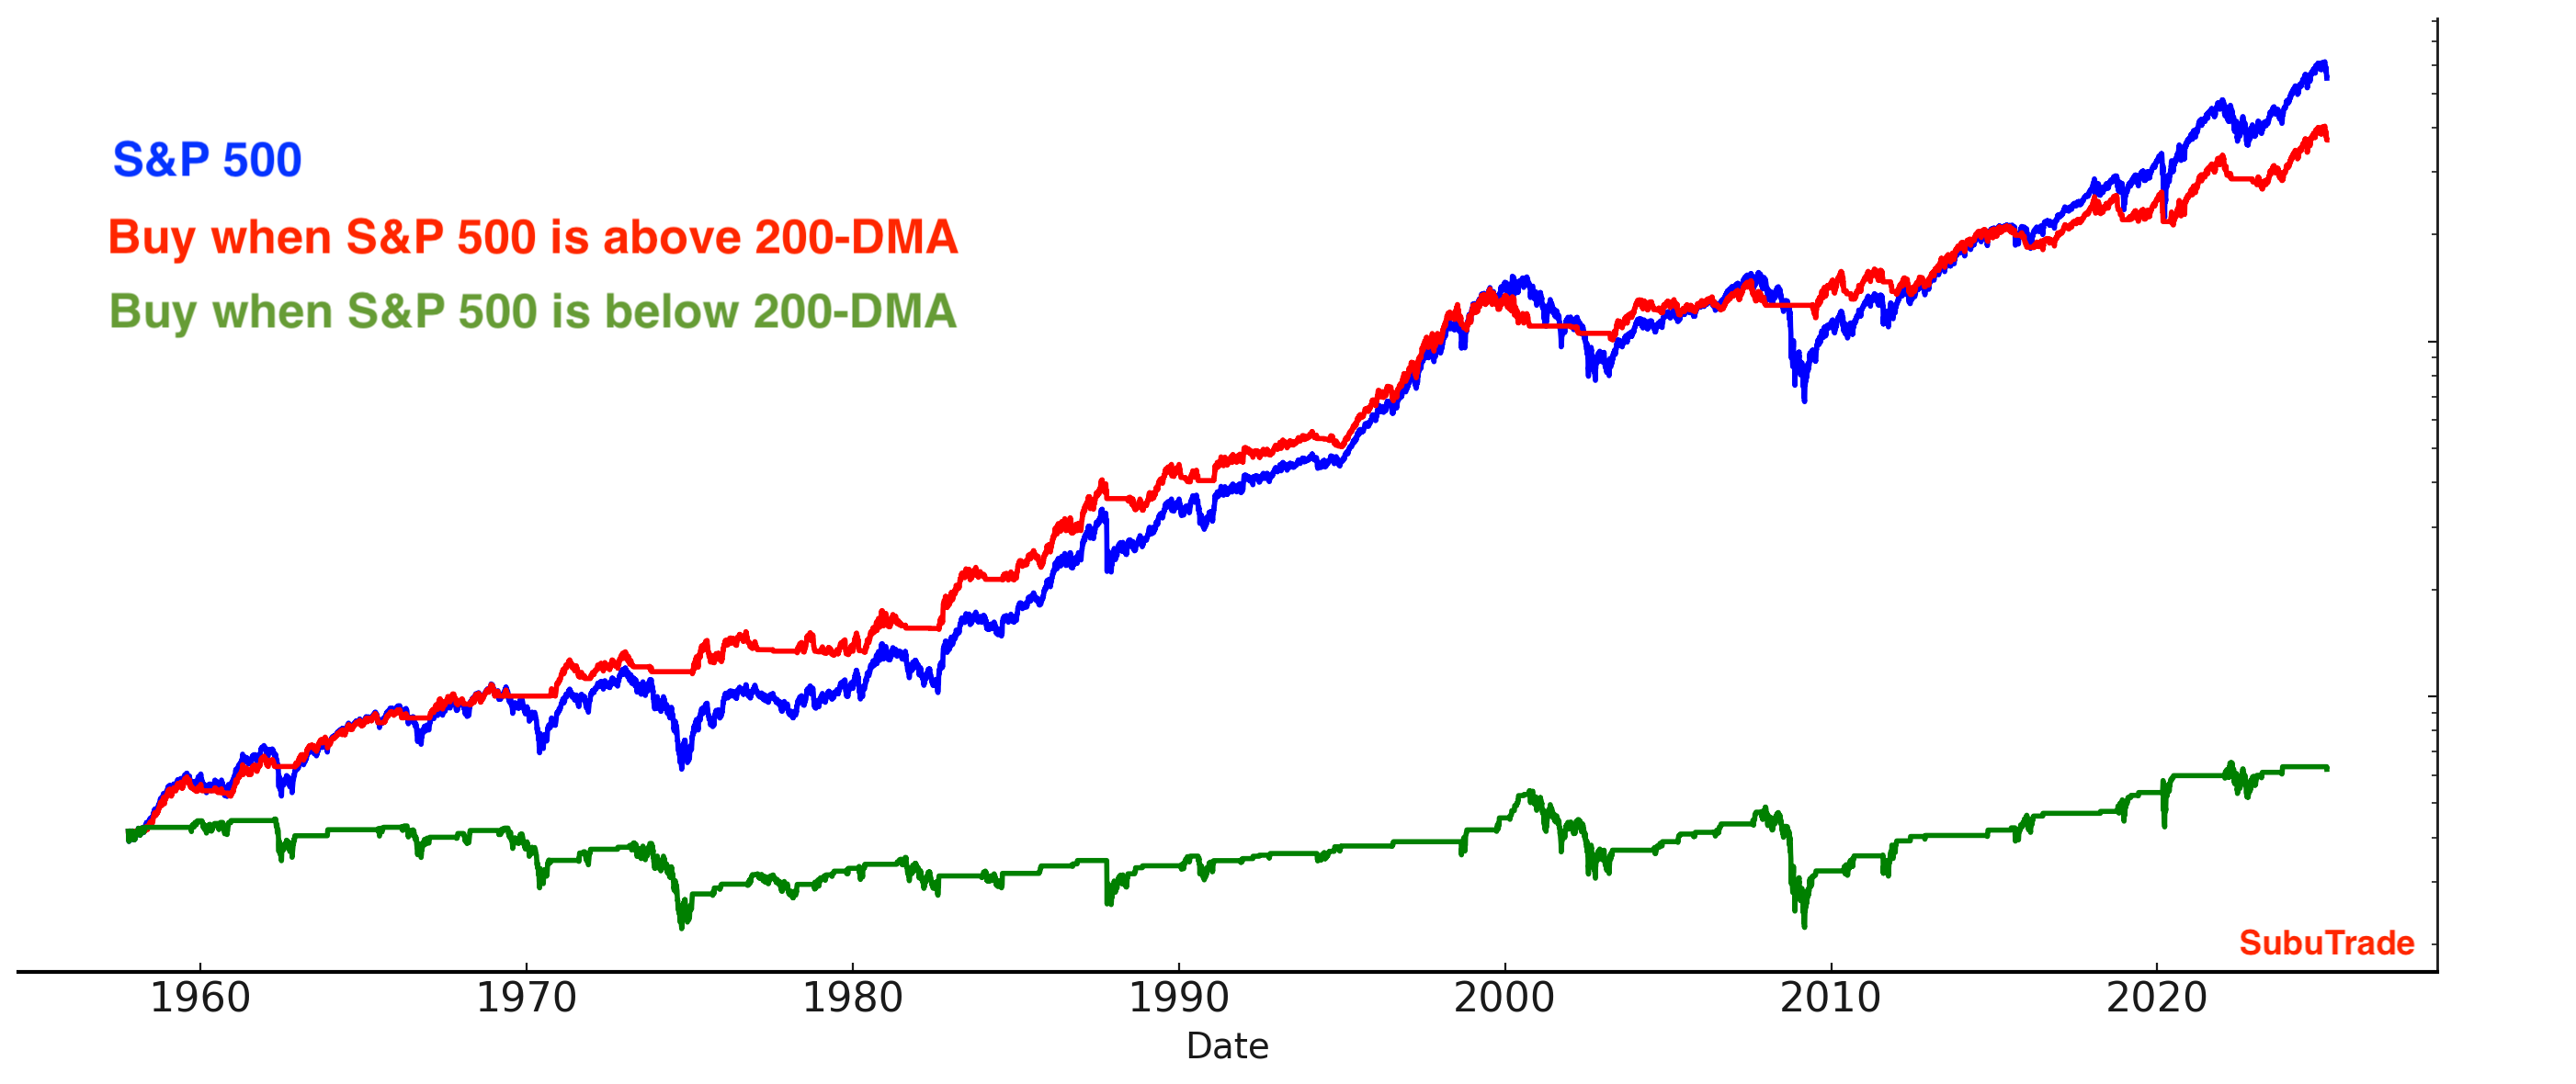
The trend is your friend, until it ends. The stock market is trending Up:

Why does this matter? Because at least from a trend following perspective, it’s better to buy when the market is trending Up (e.g. above its 200-DMA) than when the market is trending Down (e.g. below its 200-DMA).
Corporate Earnings
Many traders say that valuations and fundamentals are useless, and that “only price matters”. While this is true for day traders (valuations have zero impact on the market’s short term direction), fundamentals matter for traders and investors with a longer term horizon.
Earnings Revisions have finally turned positive after 6 months of negative readings:

Valuations for large cap stocks (S&P 500) remain somewhat elevated compared to its 10 year average:

Here is the S&P 500’s forward earnings expectations. In the long run, earnings and stock prices move in the same direction:

Conclusion
U.S. equities pushed higher this week. Putting aside the potential for a short term pullback, both bulls and bears face a key problem.
What’s the theme/narrative that can push equities to massive new all-time highs like in 2023-2024? Even if Trump strikes trade deals with other nations, that is not a net positive for the U.S. economy & corporate earnings. It’s simply not a negative factor for the economy & corporate earnings.
What’s the theme/narrative that can push equities massively lower (e.g. re-test the bottom)? The U.S. economy and corporate earnings have been hurt by these trade wars. But the pain is not disastrous, and nor is it un-fixable. Absent an escalating trade war, there is no theme right now that can push stocks massively lower (i.e. re-test the April lows).
I expect stocks to trade in a wide and volatile range throughout 2025, swinging Up and Down, with the S&P 500 perhaps making marginal all-time highs. The key point: Risk/Reward favors neither bulls nor bears right now.
When Risk/Reward favors neither bulls nor bears, it’s important to remember that equities exhibit an upwards bias over time. This long-term trend is driven by the growth of corporate earnings in a dynamic, innovation-driven economy like the U.S.
My Portfolio
*Click here to understand how I trade
Swapped my long tech stocks position for a long SPY position (S&P 500 ETF). Still the largest position in my portfolio. Pullback ahead?
*A rally in stocks could also push Bitcoin higher.
No position in Gold. Gold could correct/consolidate for weeks/months to work off the recent excess.
Mean-Reversion Position (Non-Core): long energy stocks. Small position size, will increase position if energy stocks fall.
Mean-Reversion Position (Non-Core) - Long Indian Equities: Reduced position size.
Mean-Reversion Position (Non-Core) – Long U.S. Treasury Bonds: Increased position size, still small.

Markets Report continued….
Bitcoin
Bitcoin is a high-beta, risk-on asset that generally rallies when stocks rally and struggles when stocks fall. While its directional correlation with stocks is clear, its price action is different—less wave-like, more staircase: sharp moves followed by prolonged consolidations.
Bitcoin has been trending higher along with stocks over the past month. But while stocks pushed higher this week, Bitcoin stalled. This illustrates the key difficulty with trading Bitcoin: it does not move in a 1-to-1 relation with stocks. While the general direction is the same, Bitcoin often stalls when stocks rally, or Bitcoin may jump when stocks stall. This makes trading Bitcoin difficult because it’s hard to predict when Bitcoin will move.
Can we get a Bitcoin breakout to new all-time highs?

Trend
Despite this week’s consolidation, Bitcoin is still trending higher:

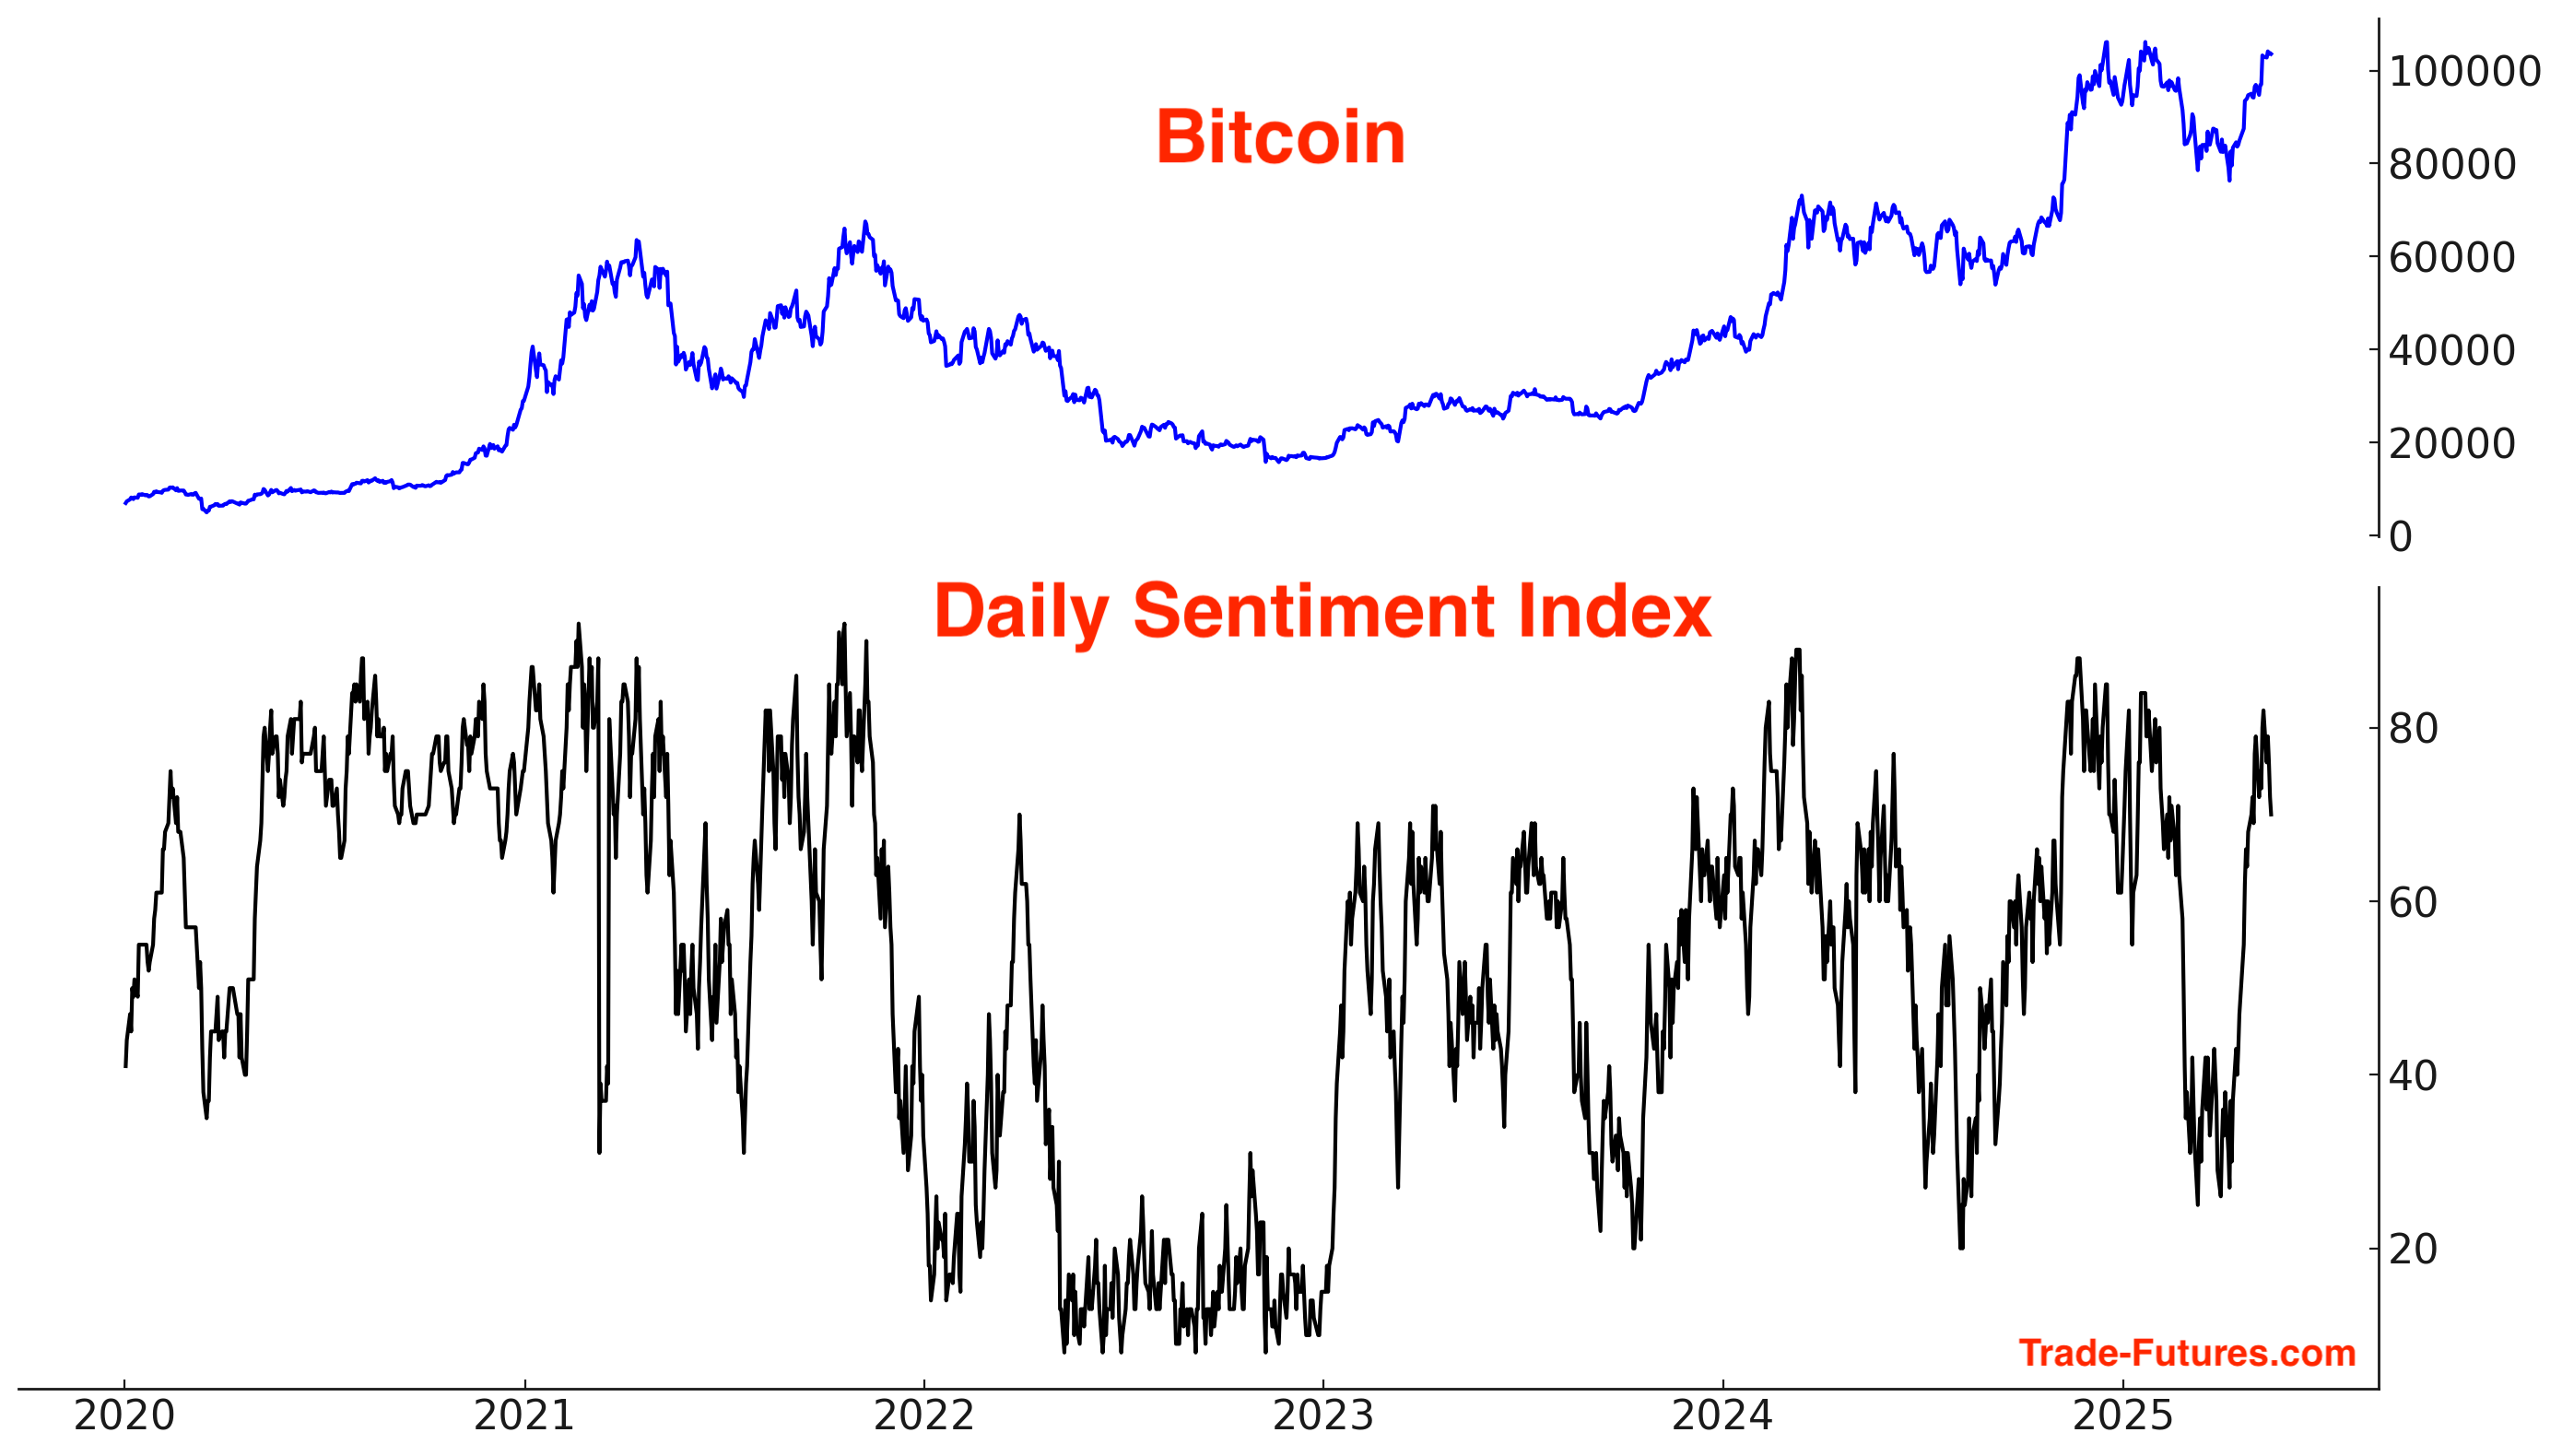
Sentiment
Sentiment remains elevated:
Gold and energy
Gold spiked while stocks crashed last month. Now that stocks are rallying, gold is struggling. Gold’s consolidation/correction could last weeks, if not months.

Trend
Gold is losing its Uptrend:

Options
After a massive spike, the $ value of GLD calls - puts is falling:

Fund Flows
Last month we saw large inflows into GLD. Now that gold is pulling back, we’re witnessing large outflows:

Sentiment
Sentiment is in neutral territory:

Energy
Oil is trying to bounce, with Trump’s trade deals lowering fears of a global recession.
Here’s a good chart from Bloomberg:


Sentiment
Sentiment is trying to recover:

COT Report
The COT Report demonstrates that Dealers (smart money) are historically long energy while Asset Managers are historically short:

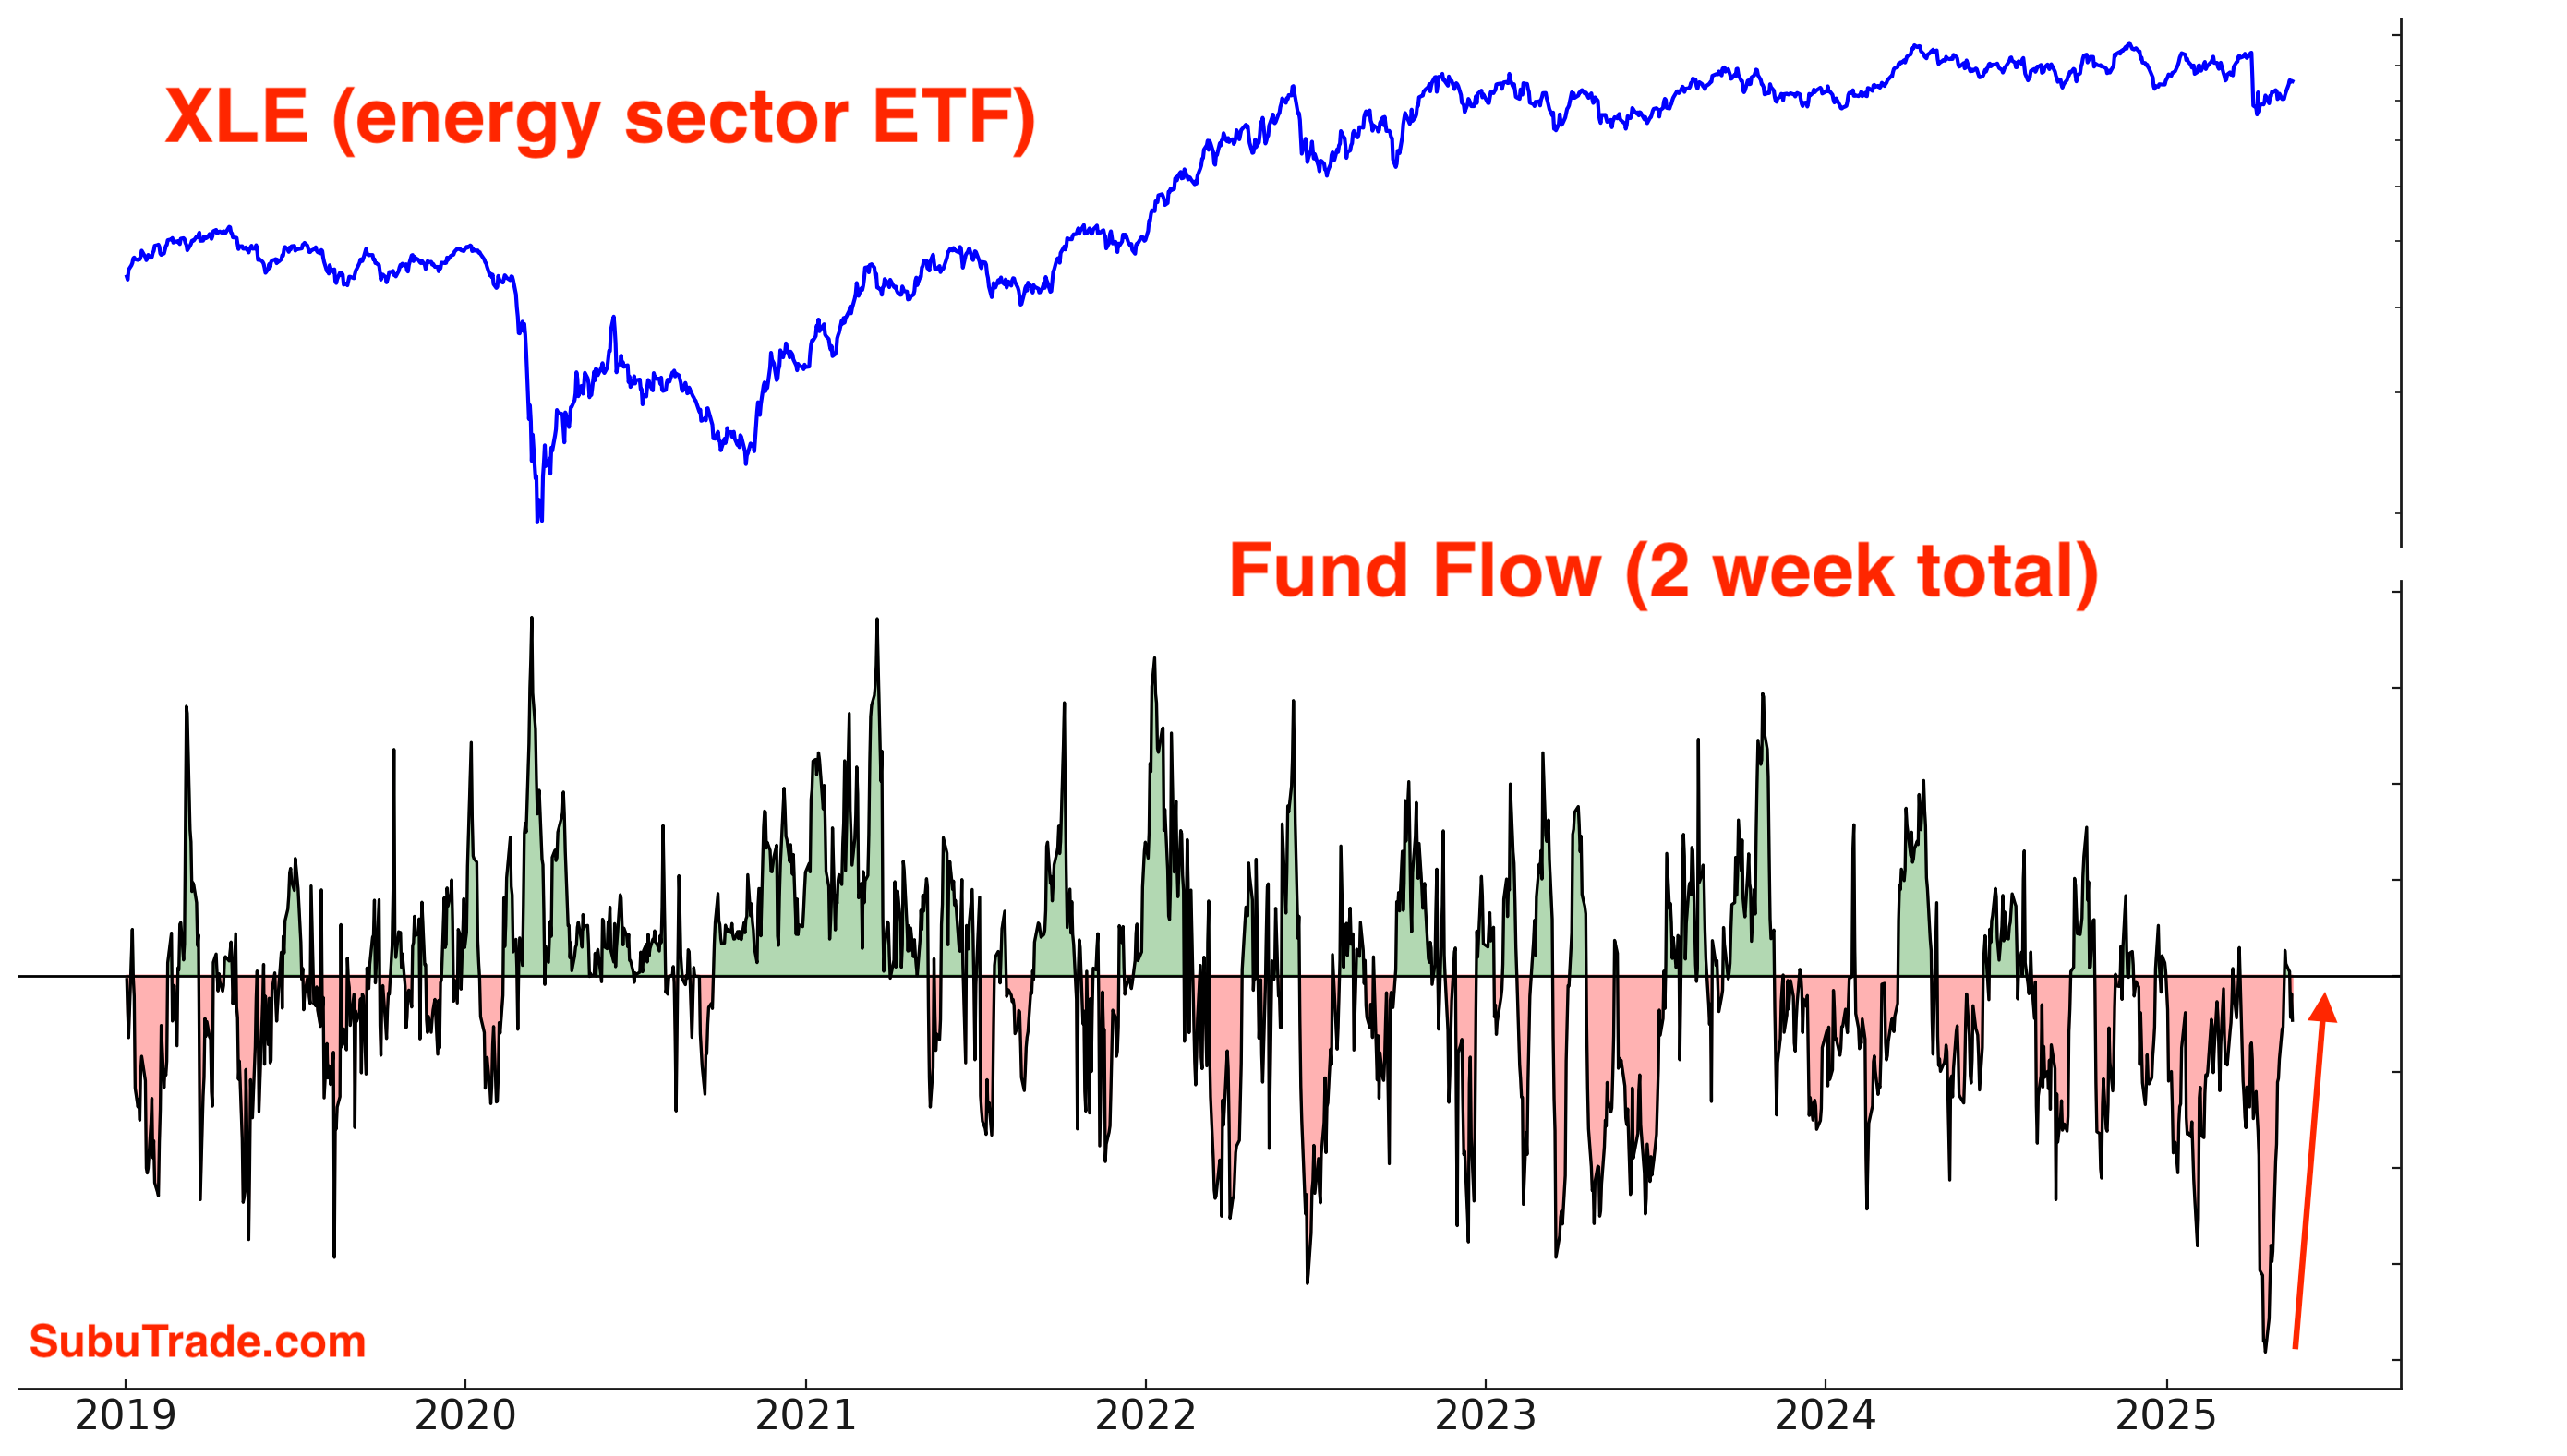
XLE Fund Flow
Outflows from XLE are stabilizing:
The main difficulty with the long energy trade: if the U.S. Dollar rallies, will that put downwards pressure on oil and energy stocks?
India
I’m bullish on India and believe that this is India’s Century. Trump’s tariffs may bring back some high-end manufacturing to the U.S., but they won’t revive labor-intensive manufacturing. Labor-intensive manufacturing for textiles, electronics etc. will likely move from China to India. India will become a “triple-engined” economy, relying on service exports (office jobs outsourced to India), manufacturing exports, and foreign remittances to grow its economy.
Indian stocks rebounded this week after pulling back last week on the India-Pakistan conflict.
I reduced my long exposure primarily due to the potential for a U.S. Dollar rally, which could weigh on Indian equities when viewed in USD terms. This is less relevant for investors holding Indian equities in local currency (Indian Rupee).
As the U.S. and India work towards a trade deal, perhaps Indian stocks will jump when that trade deal is announced.
Trend
Indian stocks are trending Up:

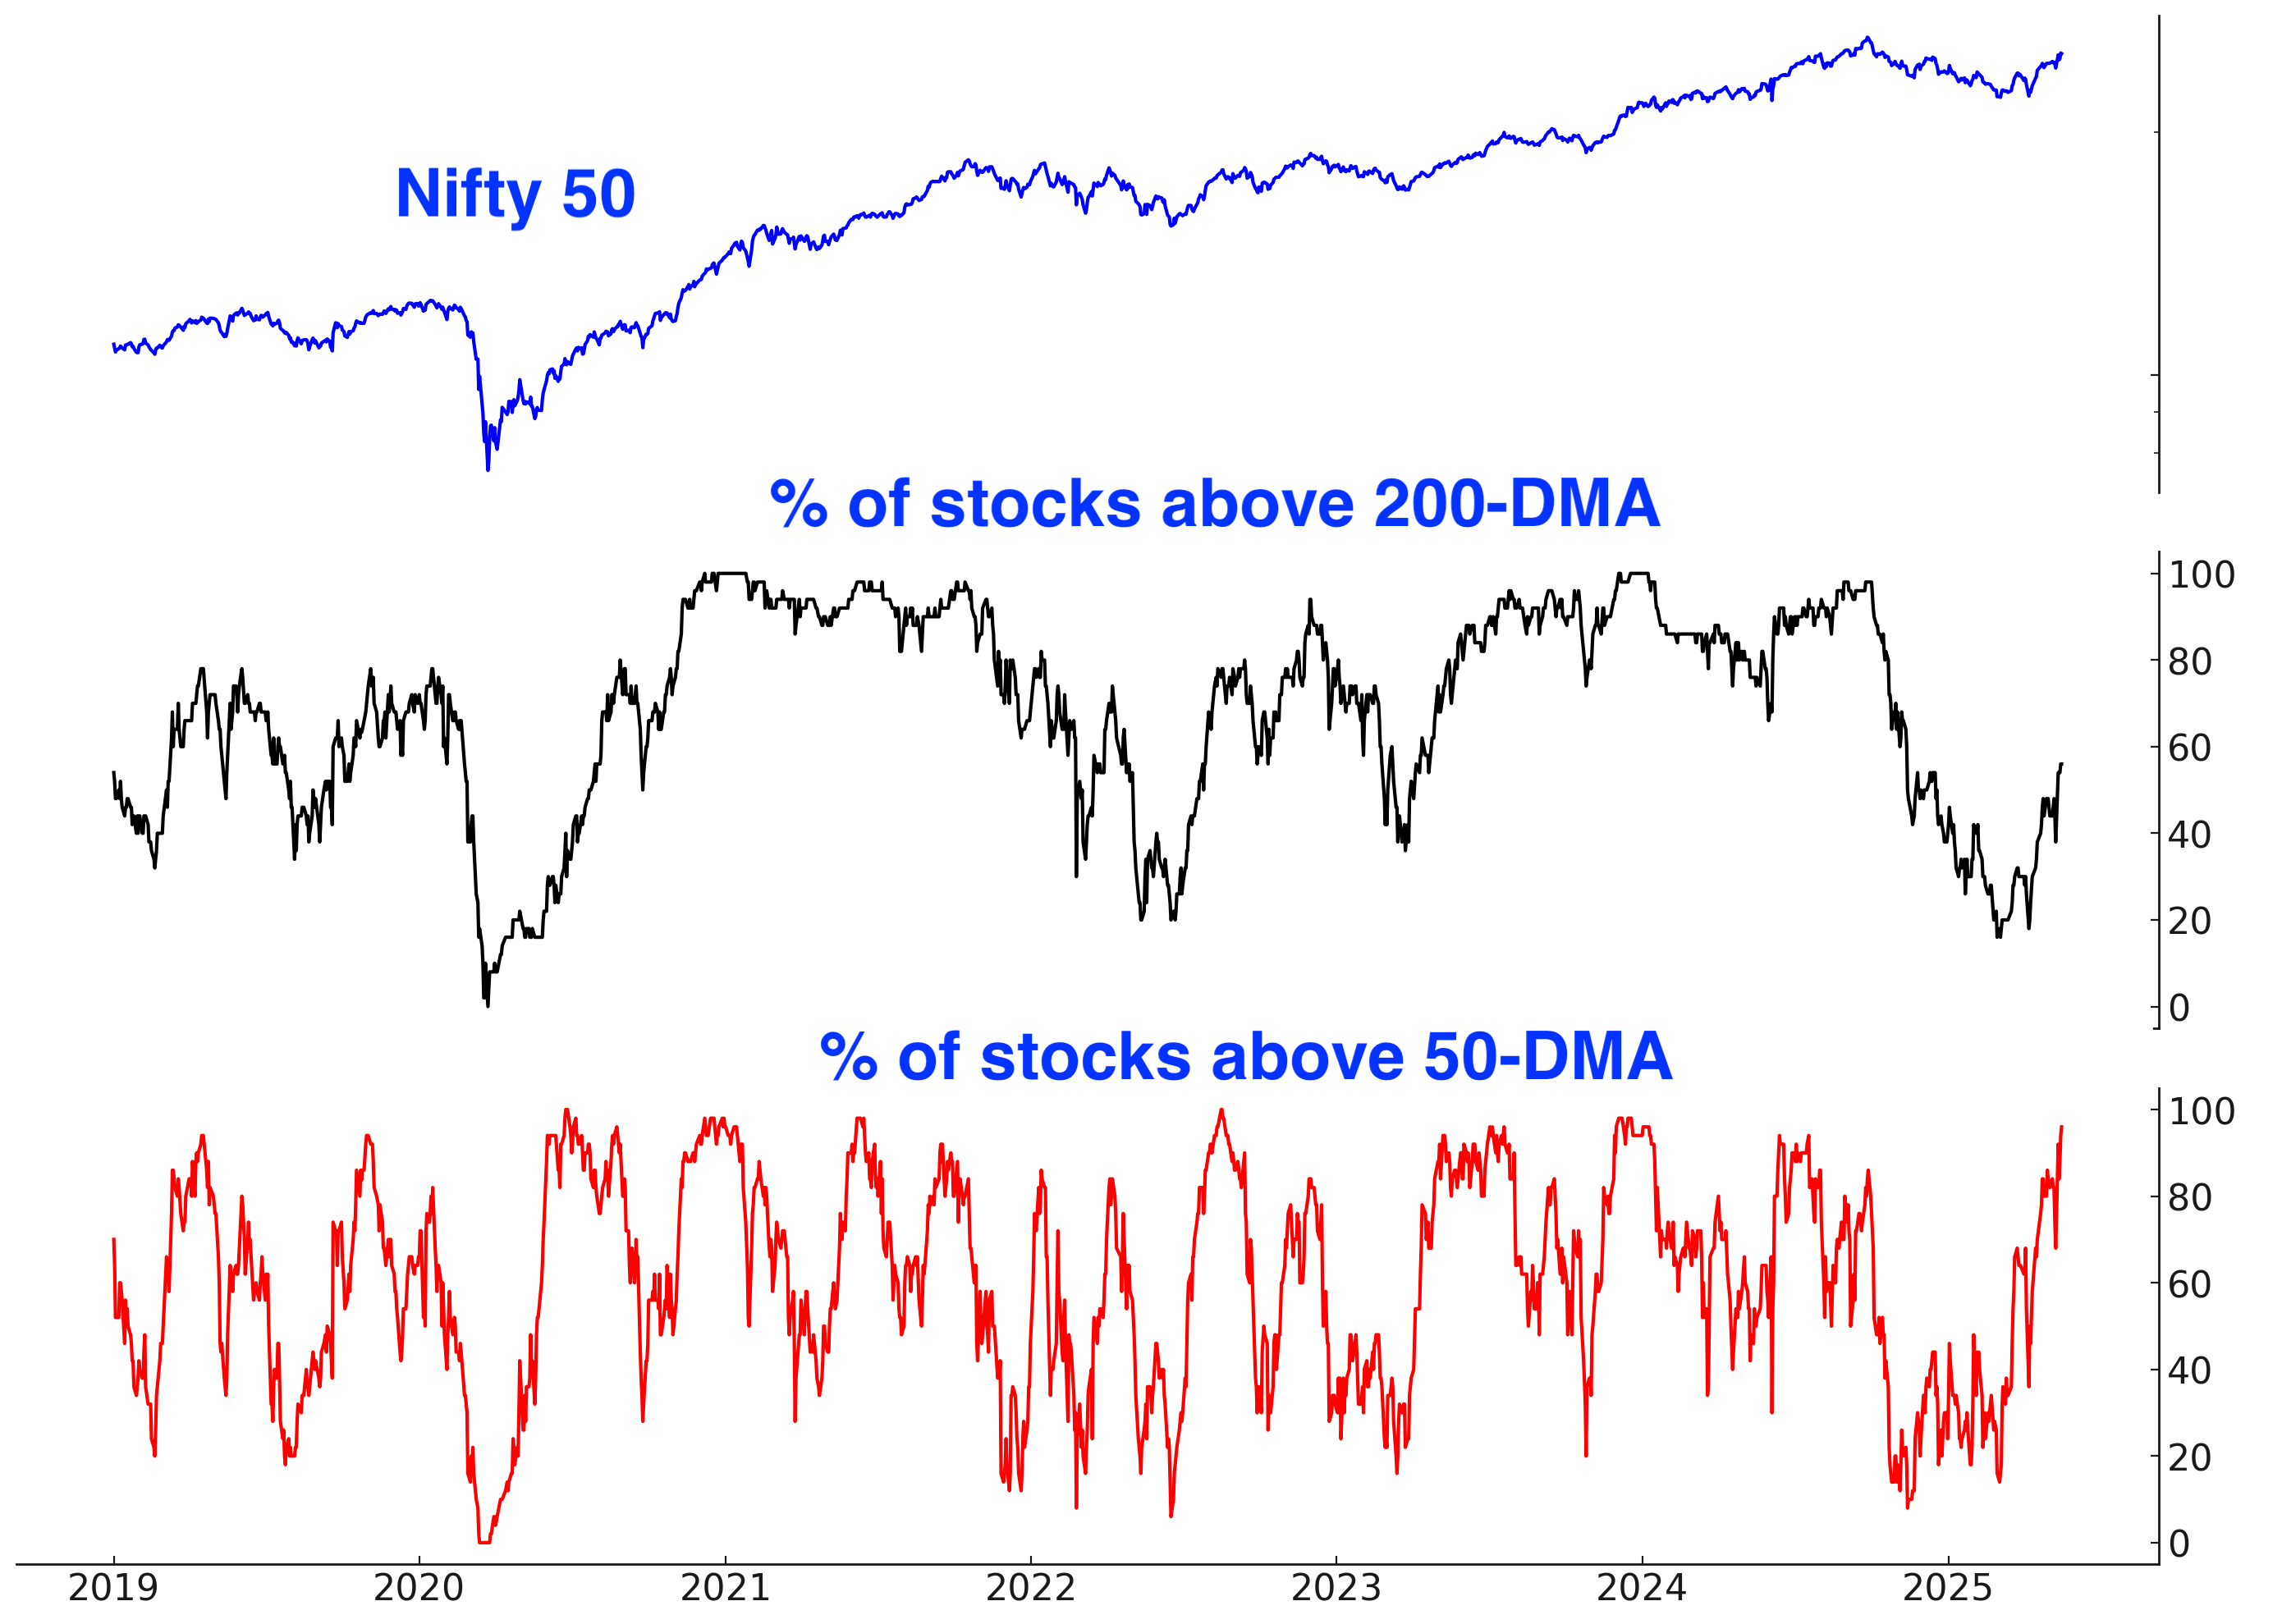
Breadth
Here are the % of Nifty 50 stocks above their 200 and 50 day moving averages:
Options
The India-Pakistan conflict caused a massive spike in INDA put volume. The last time this happened was during COVID!

Fund Flows
Indian ETFs are witnessing inflows:

INDA Short Interest

Bonds
Themes/narrative
The bond market is being pulled by conflicting forces, making a sustained trend unlikely. The most probable outcome is continued choppy price action within a broad range.
On one hand, inflationary tariffs could be bearish for bonds. However, this is not enough of a bearish factor that it would cause bonds to crash.
On the other hand, the U.S. Dollar and U.S. Treasuries are trying to mean-revert upwards after their recent crash.
The Fed is neither interested in rate cuts nor rate hikes right now. This is a neutral factor for bonds (neither bullish nor bearish).
Outside of short-term traders seeking a mean-reversion bounce, I believe that the bond market is best avoided for now. Neither bulls nor bears have an edge here.
Trend
No strong trend; bonds have been swinging sideways within a wide range since late-2022:

Sentiment
Sentiment remains in neutral territory:

Pessimism
TLT’s short interest jumped to a new all-time high:

Currencies
U.S. stocks and the U.S. Dollar sank in March-April when foreigners sold U.S. assets. With the Trump administration working on trade deals, U.S. equities and the U.S. Dollar effectively bottomed on April 21. Since then, stocks and the Dollar have rallied.
However, the equities rally has been notably stronger than the Dollar’s rally:

The U.S. Dollar could continue to rally. But this brings up a key question. If the U.S. Dollar rallies, does that imply that any stock market pullback will be small?

COT Report
Asset Managers are still short the U.S. Dollar. As I noted last week, they’ve never been right before.

Trend
The U.S. Dollar is trying to trend upwards:

Sentiment
Sentiment remains in neutral territory:
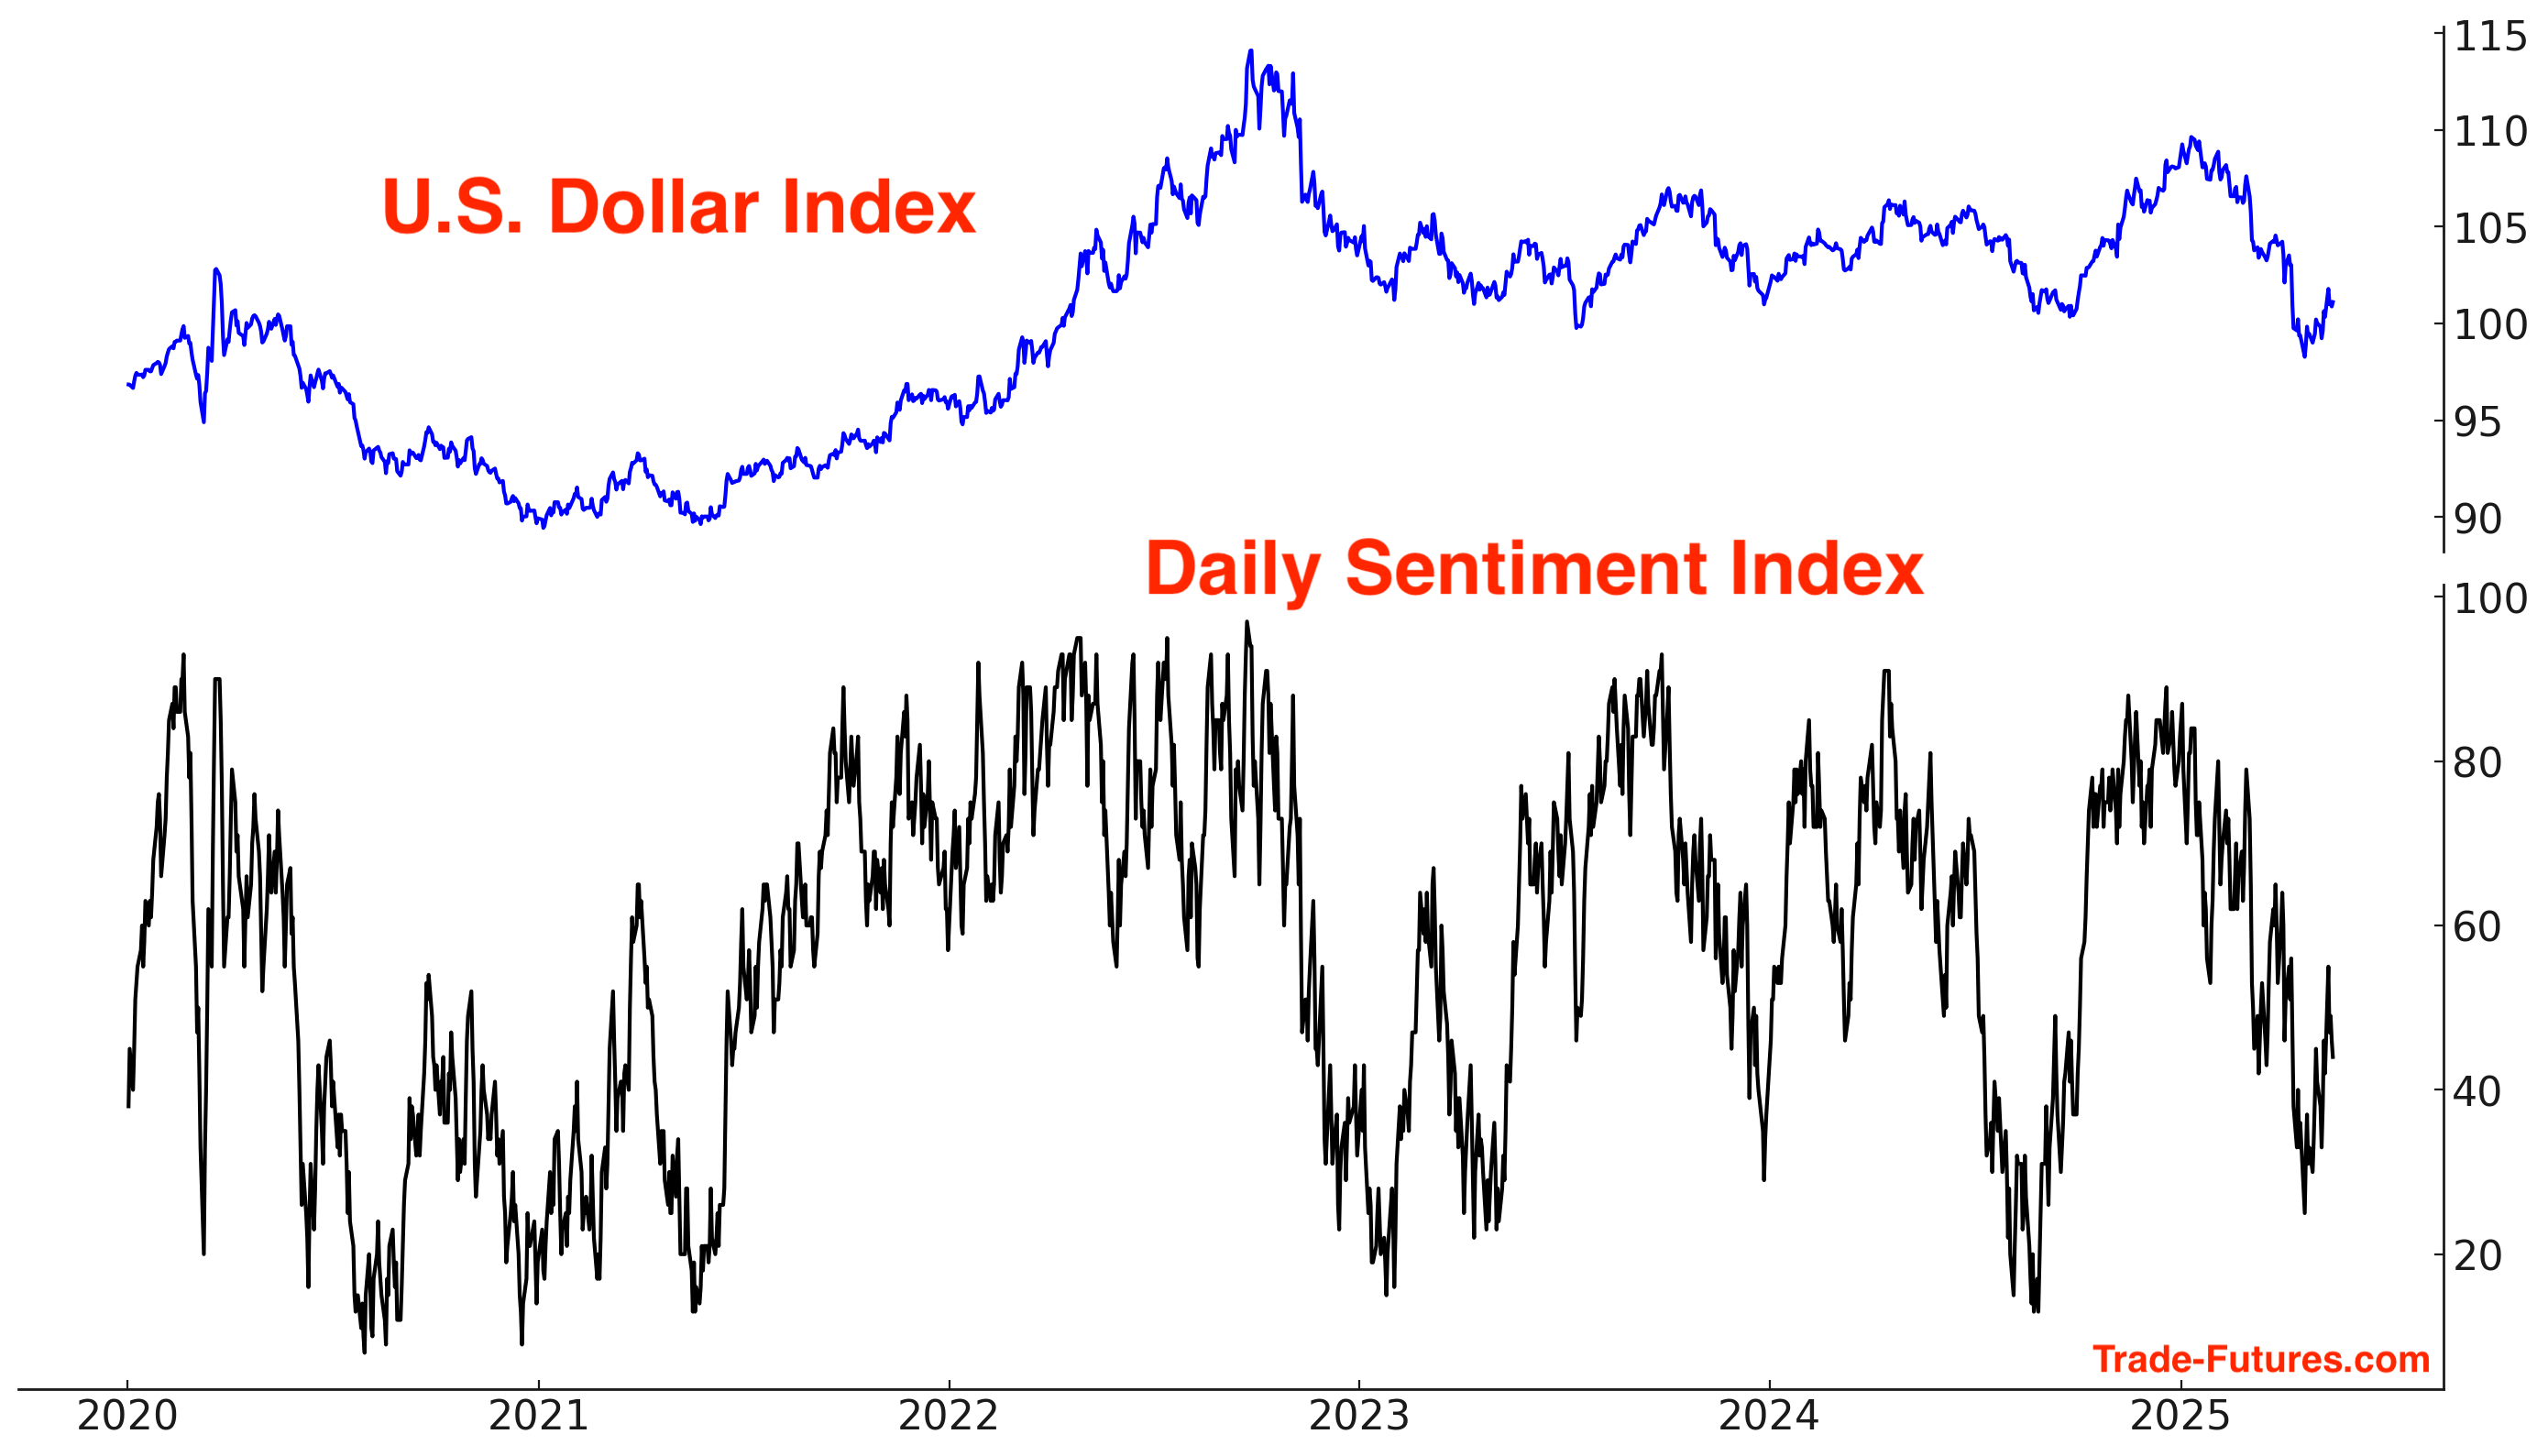
I do not have a currencies position, but I believe that the U.S. Dollar will continue to rally.
Summary & Portfolio
Swapped my long tech stocks position for a long SPY position (S&P 500 ETF). Still the largest position in my portfolio. Pullback ahead?
*A rally in stocks could also push Bitcoin higher.
No position in Gold. Gold could correct/consolidate for weeks/months to work off the recent excess.
Mean-Reversion Position (Non-Core): long energy stocks. Small position size, will increase position if energy stocks fall.
Mean-Reversion Position (Non-Core) - Long Indian Equities: Reduced position size.
Mean-Reversion Position (Non-Core) – Long U.S. Treasury Bonds: Increased position size, still small.

*Notes: charts I’m looking at
S&P 500 almost at all-time highs:

NASDAQ 100 almost at all-time highs, but notably weaker than the S&P on Friday:

Finance charging higher:

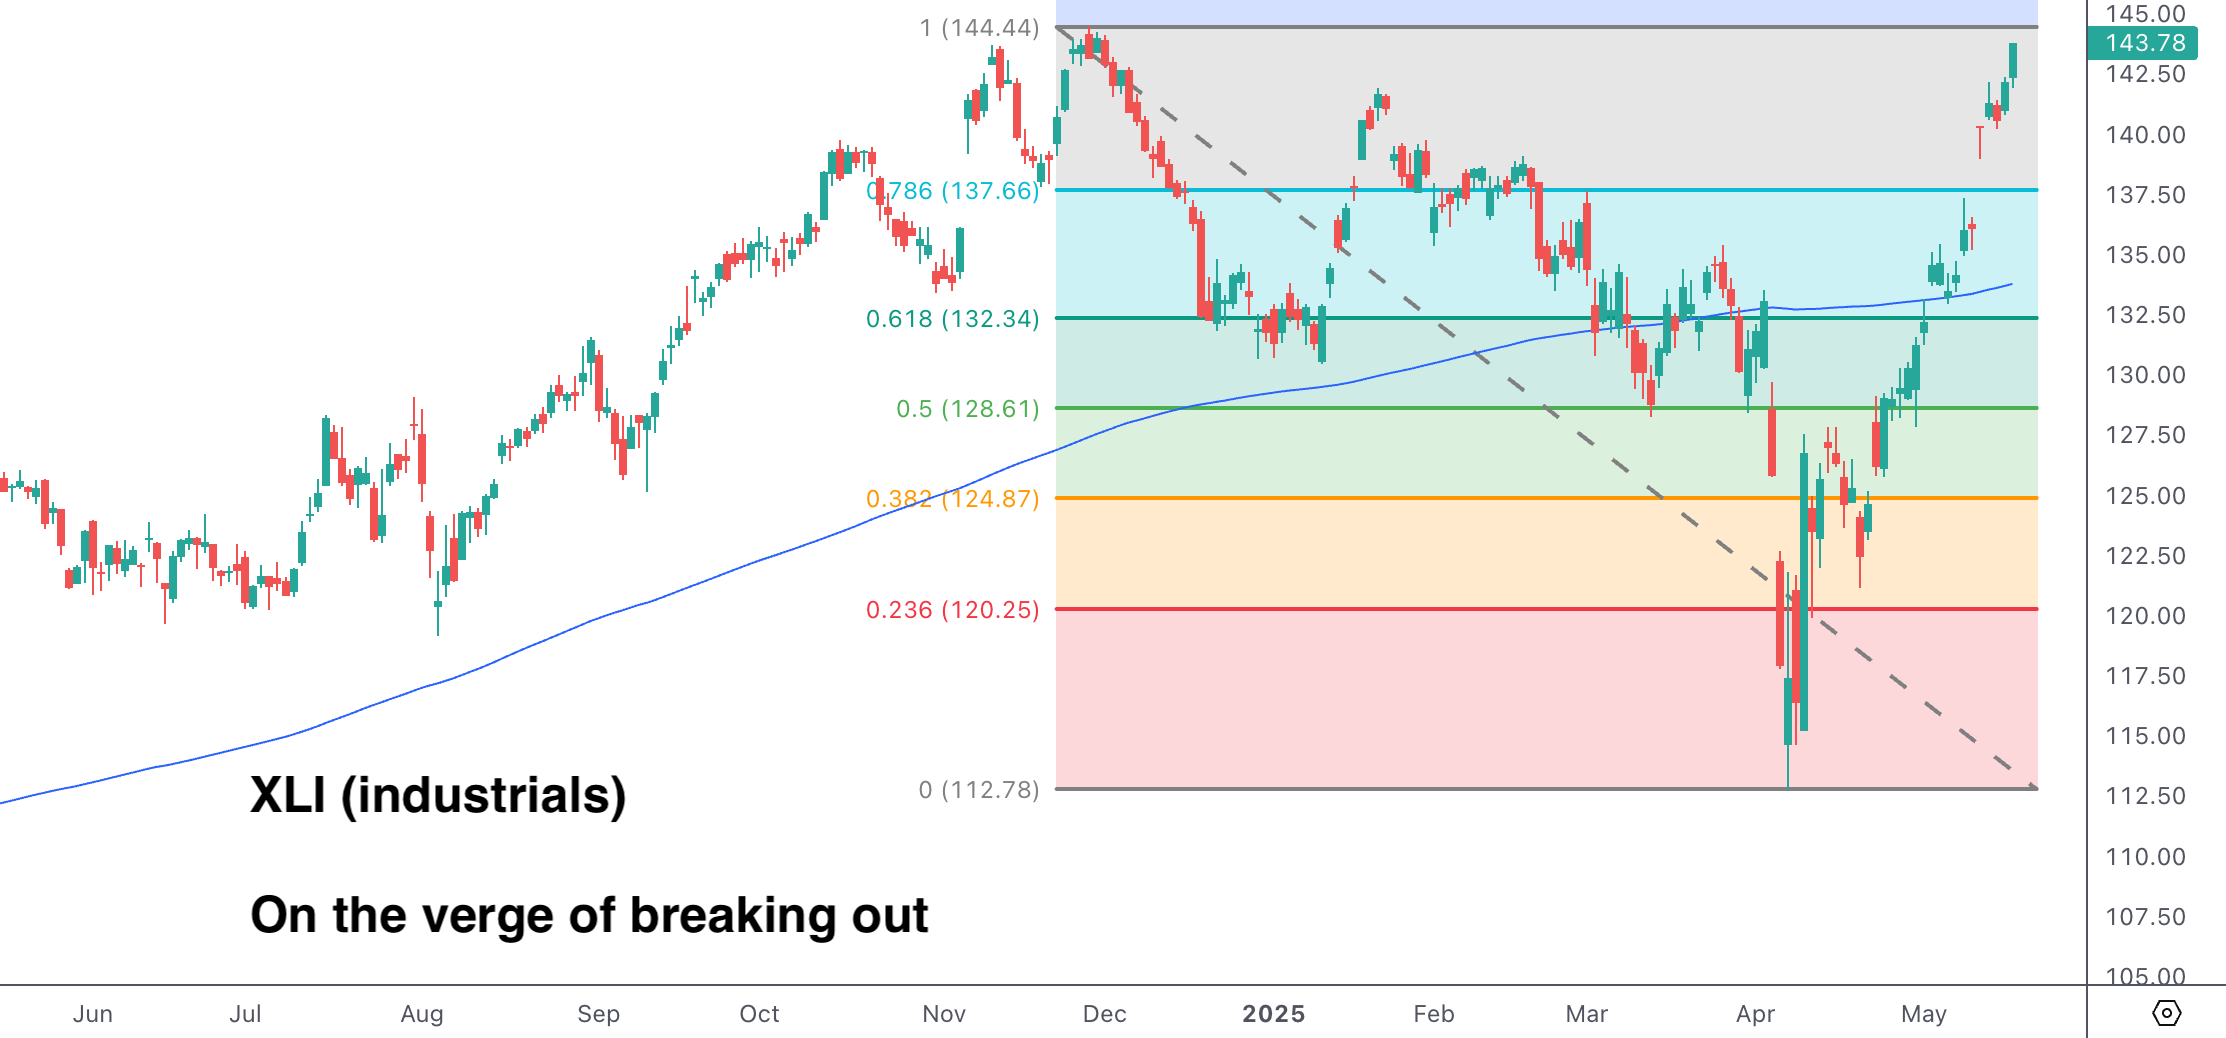
Industrials on the verge of making new all-time highs (chart below). Including dividends re-invested, XLI made a new all-time high on Friday:
Energy is one of the weaker sectors:

German equities made new all-time highs:

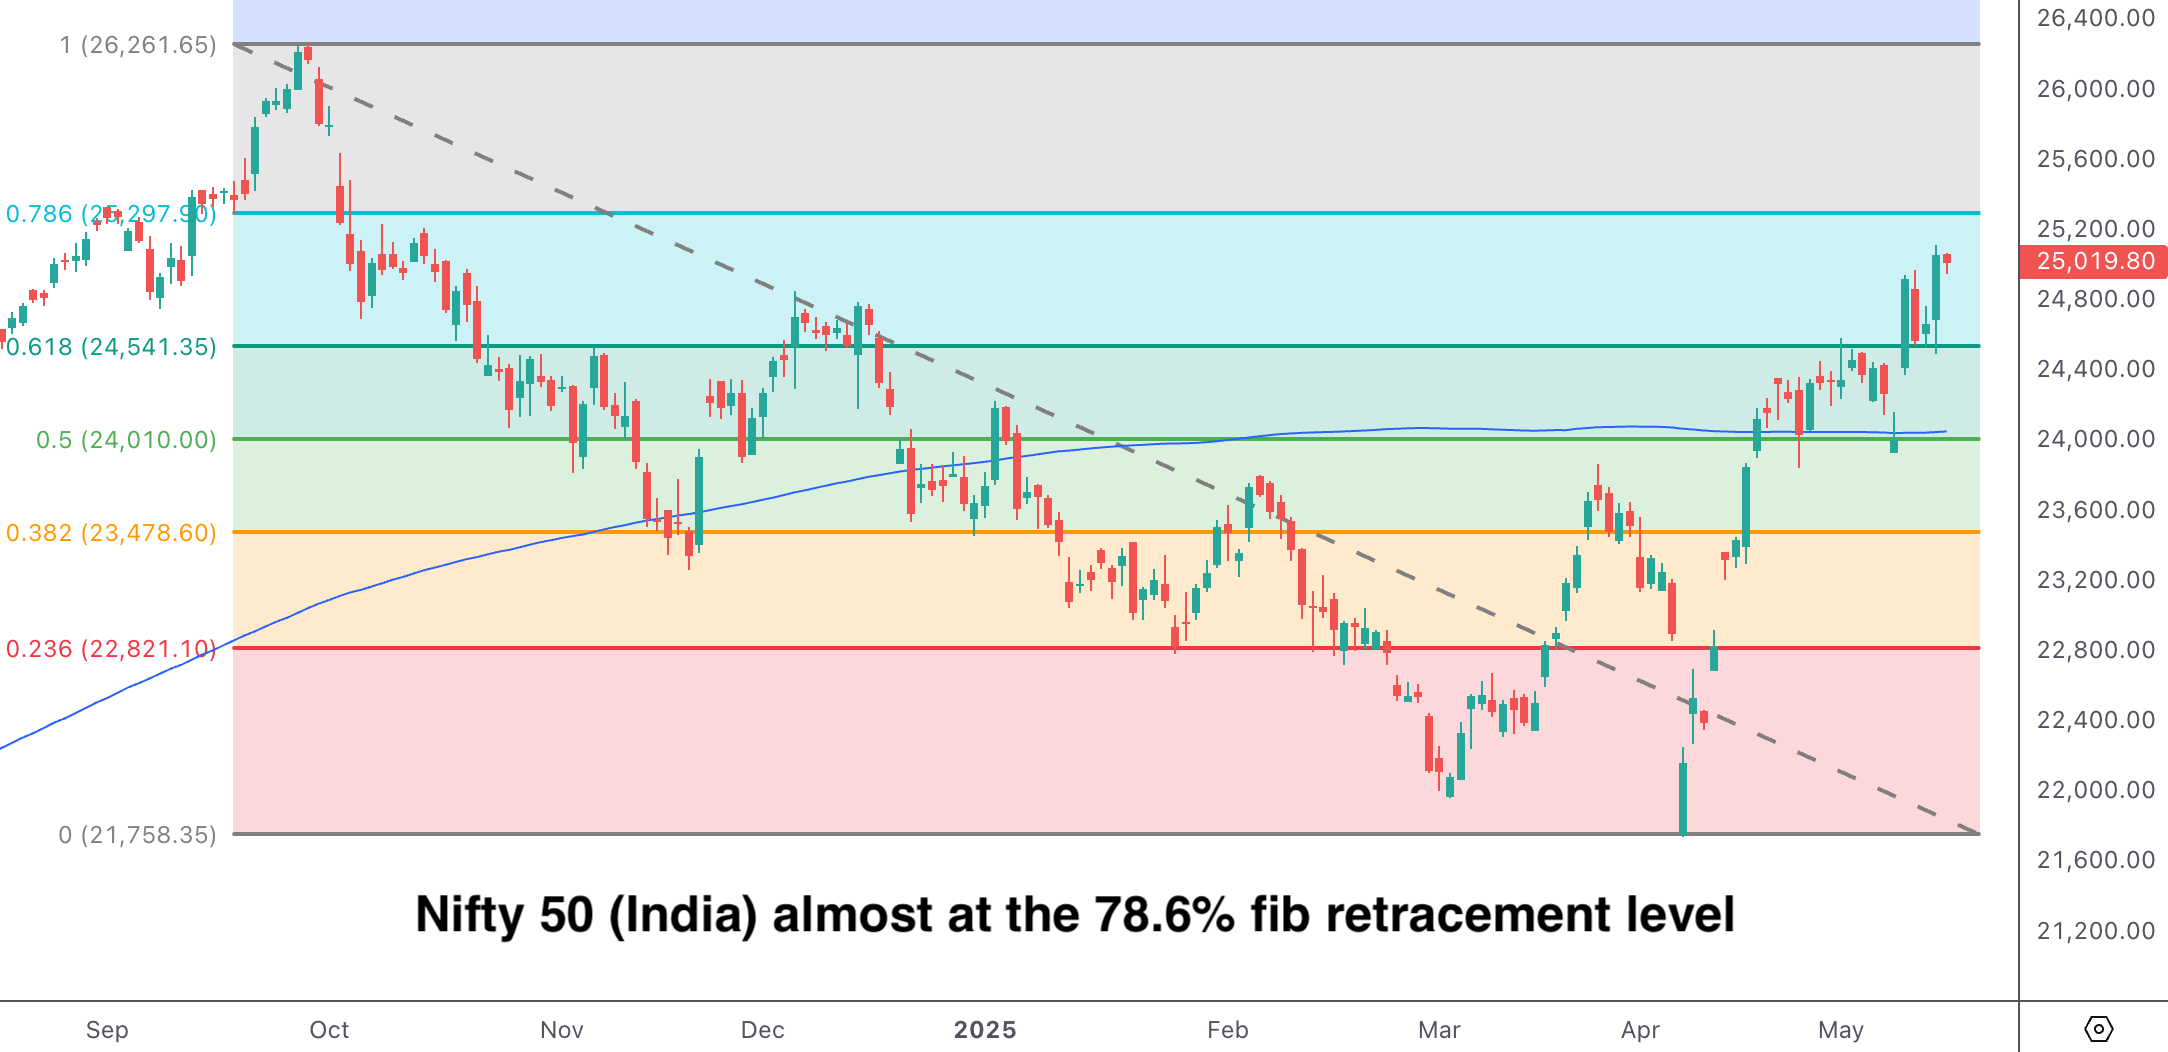
India’s Nifty 50 is almost at the 78.6% fib retracement level:
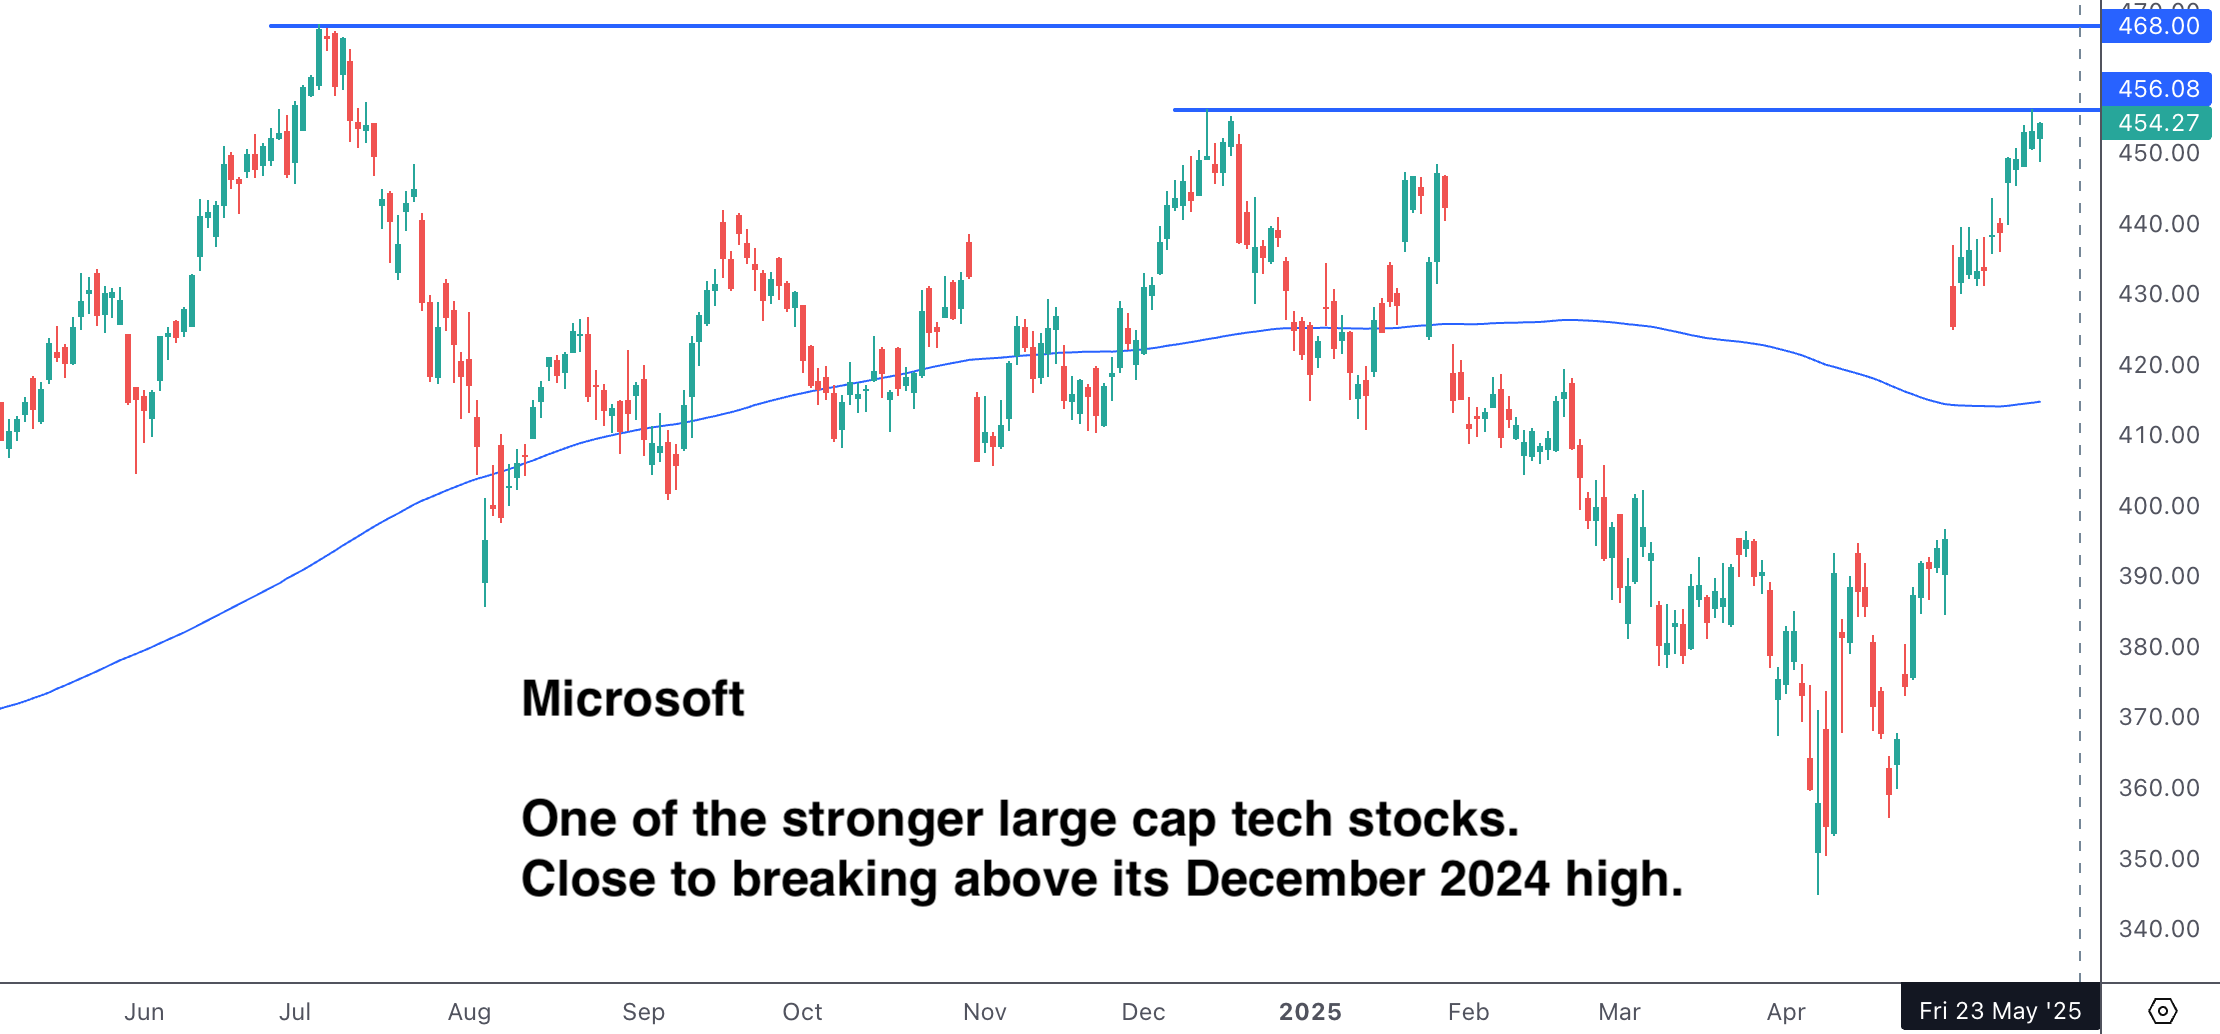
Moving on to large cap tech…
Apple is one of the weaker tech stocks. Hurt by trade turmoil:

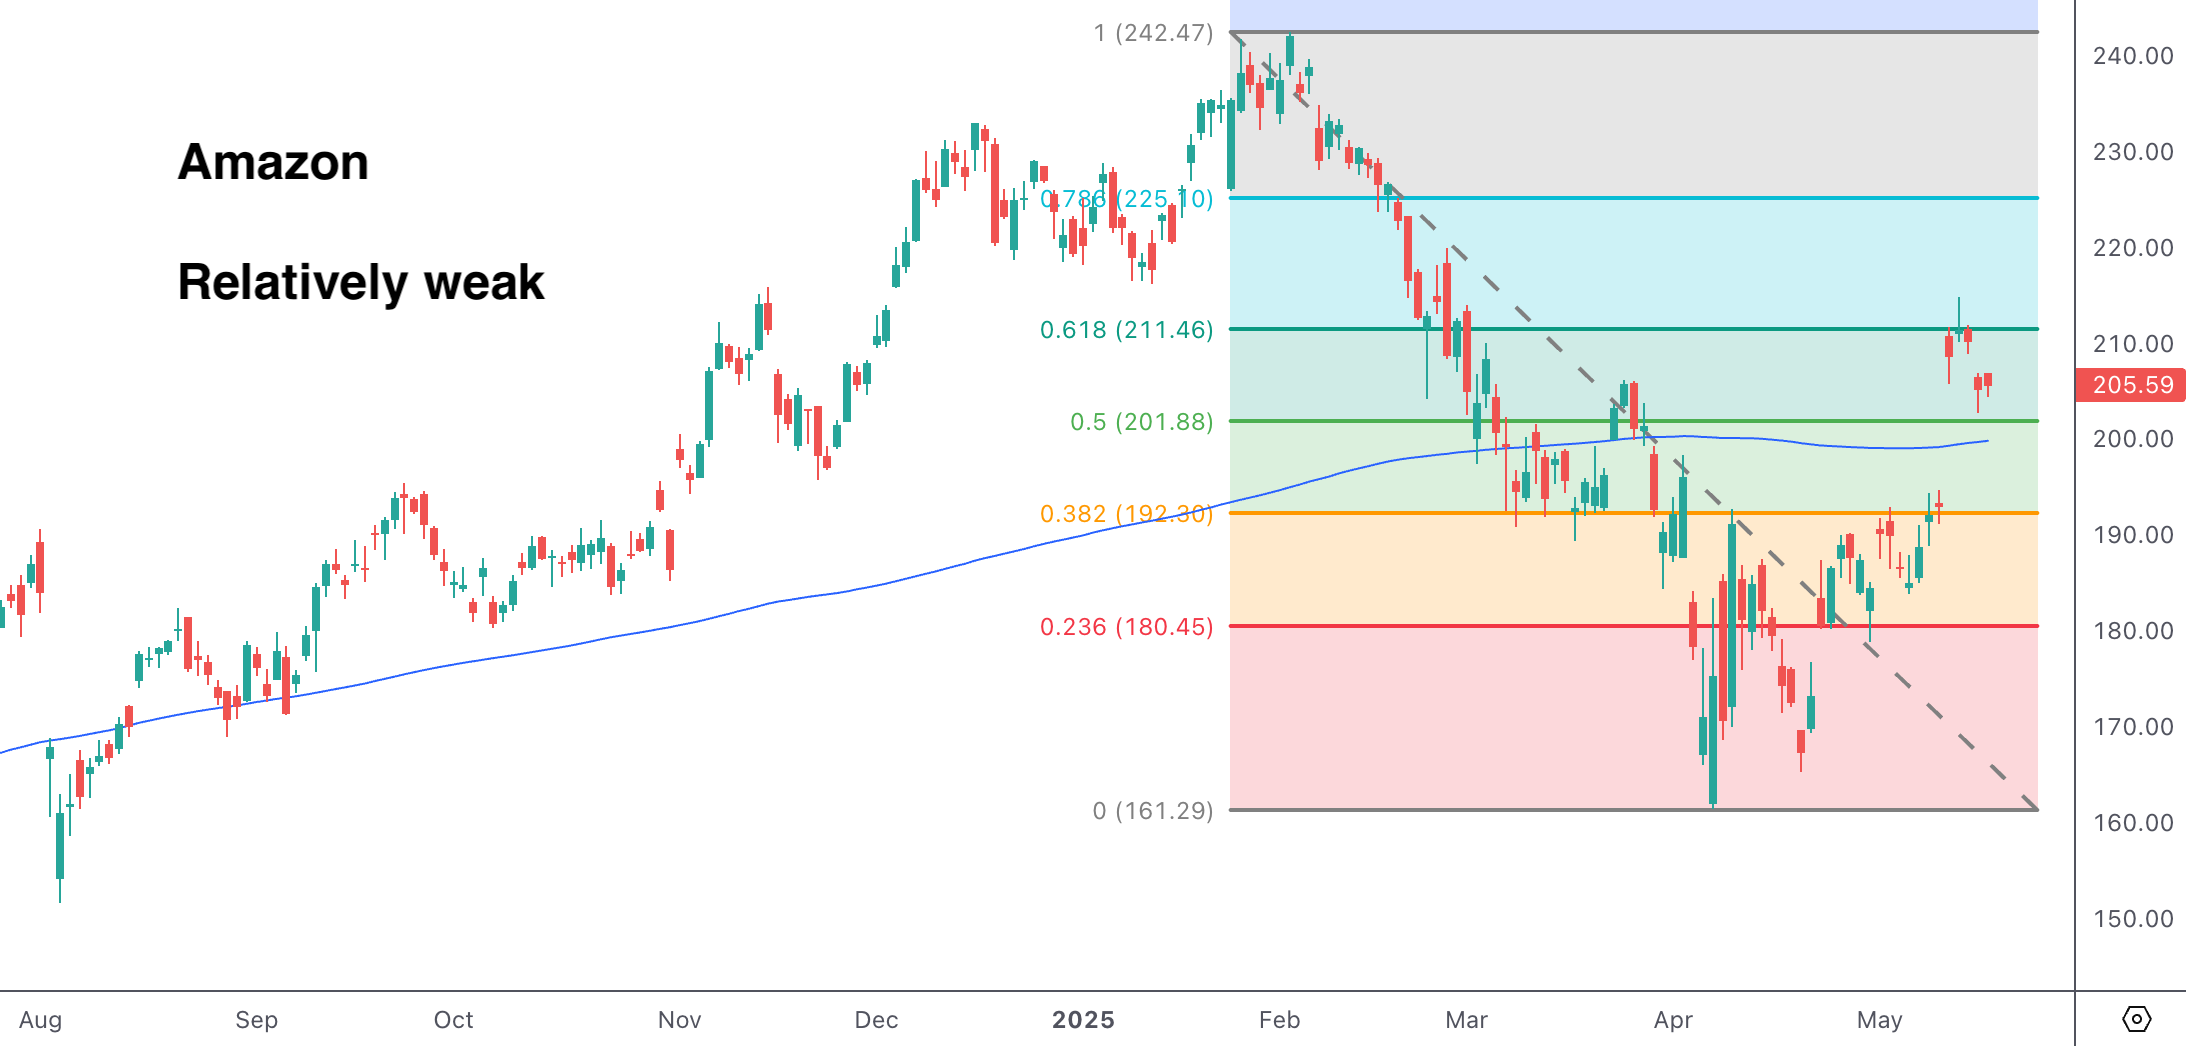
Amazon is also relatively weak:
Meta was weak on Thursday and Friday:

Microsoft is one of the stronger large cap tech stocks:
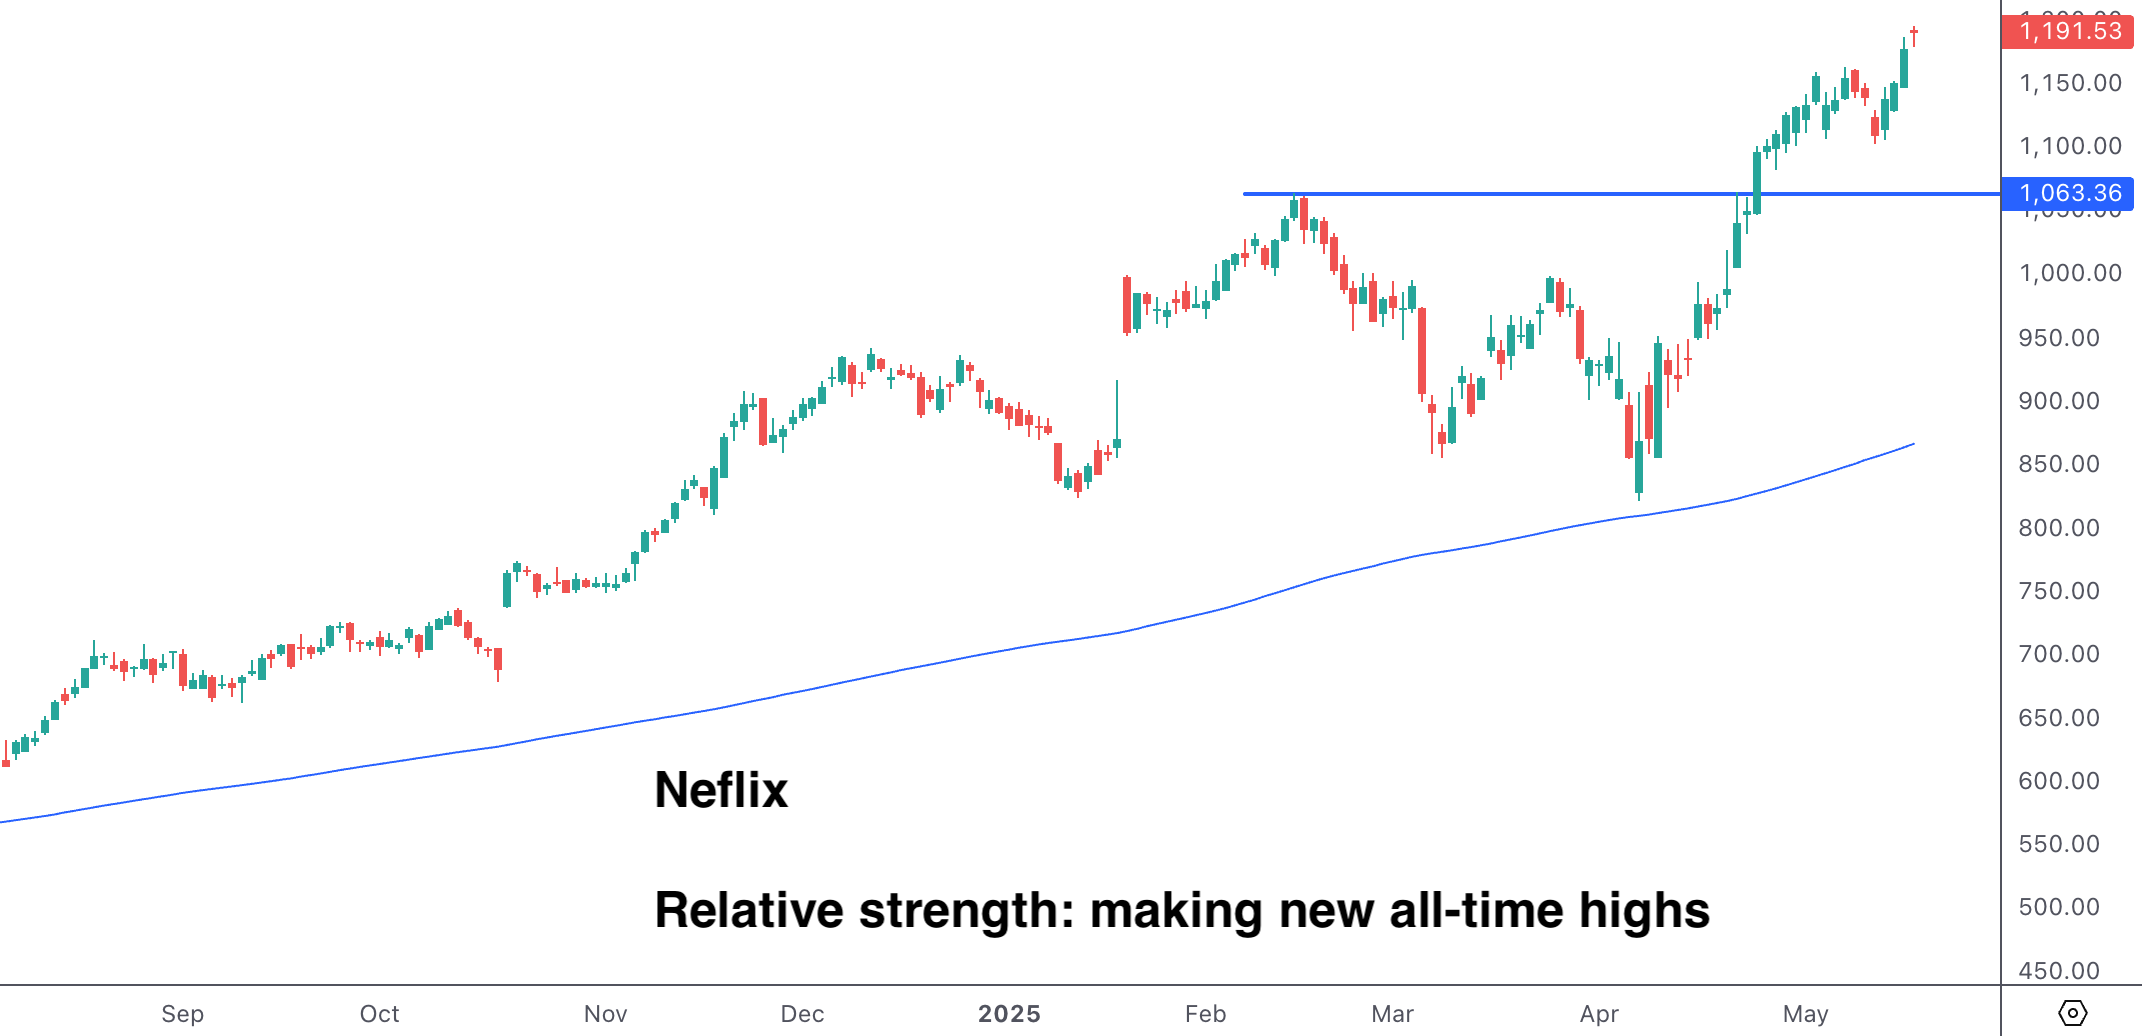
Netflix making new all-time highs:
Nvidia pushing higher:

Alphabet is one of the weakest large cap tech stocks:

Palantir made new all-time highs this week. Breakout:

Robinhood is close to all-time highs:

Tesla was one of the weaker large cap tech stocks, but made a strong recovery this week:

This content is for informational purposes only and is not financial or investment advice. I am not a licensed financial advisor. Trading involves risk, and past performance does not guarantee future results. You are responsible for your own financial decisions, and I am not liable for any losses.
Eric Schmidt and plenty of others in the computing space calling for an acceleration in data center demand could be your no brainer theme for energy.
Thanks for another great article!Can you please share your thoughts on $IWM? Thanks