
Markets Report: bear markets & trade wars
What a week. What's next?

Markets crashed this week as Trump’s trade war escalated. While everyone is focused on downside risk (with some making comparisons to the 1987 crash), it’s important to remember that any good news (e.g. talk of trade deal discussions) will be the trigger for at least a bear market rally. With that being said, further trade war escalation may push the market to new lows next week.
Before sharing my Market Outlook and Portfolio Positioning, here’s the key data I’m watching. I’ll cover volatility, options data, corporate insiders, fund flows, breadth, sentiment, and more.

U.S. Stocks
Options
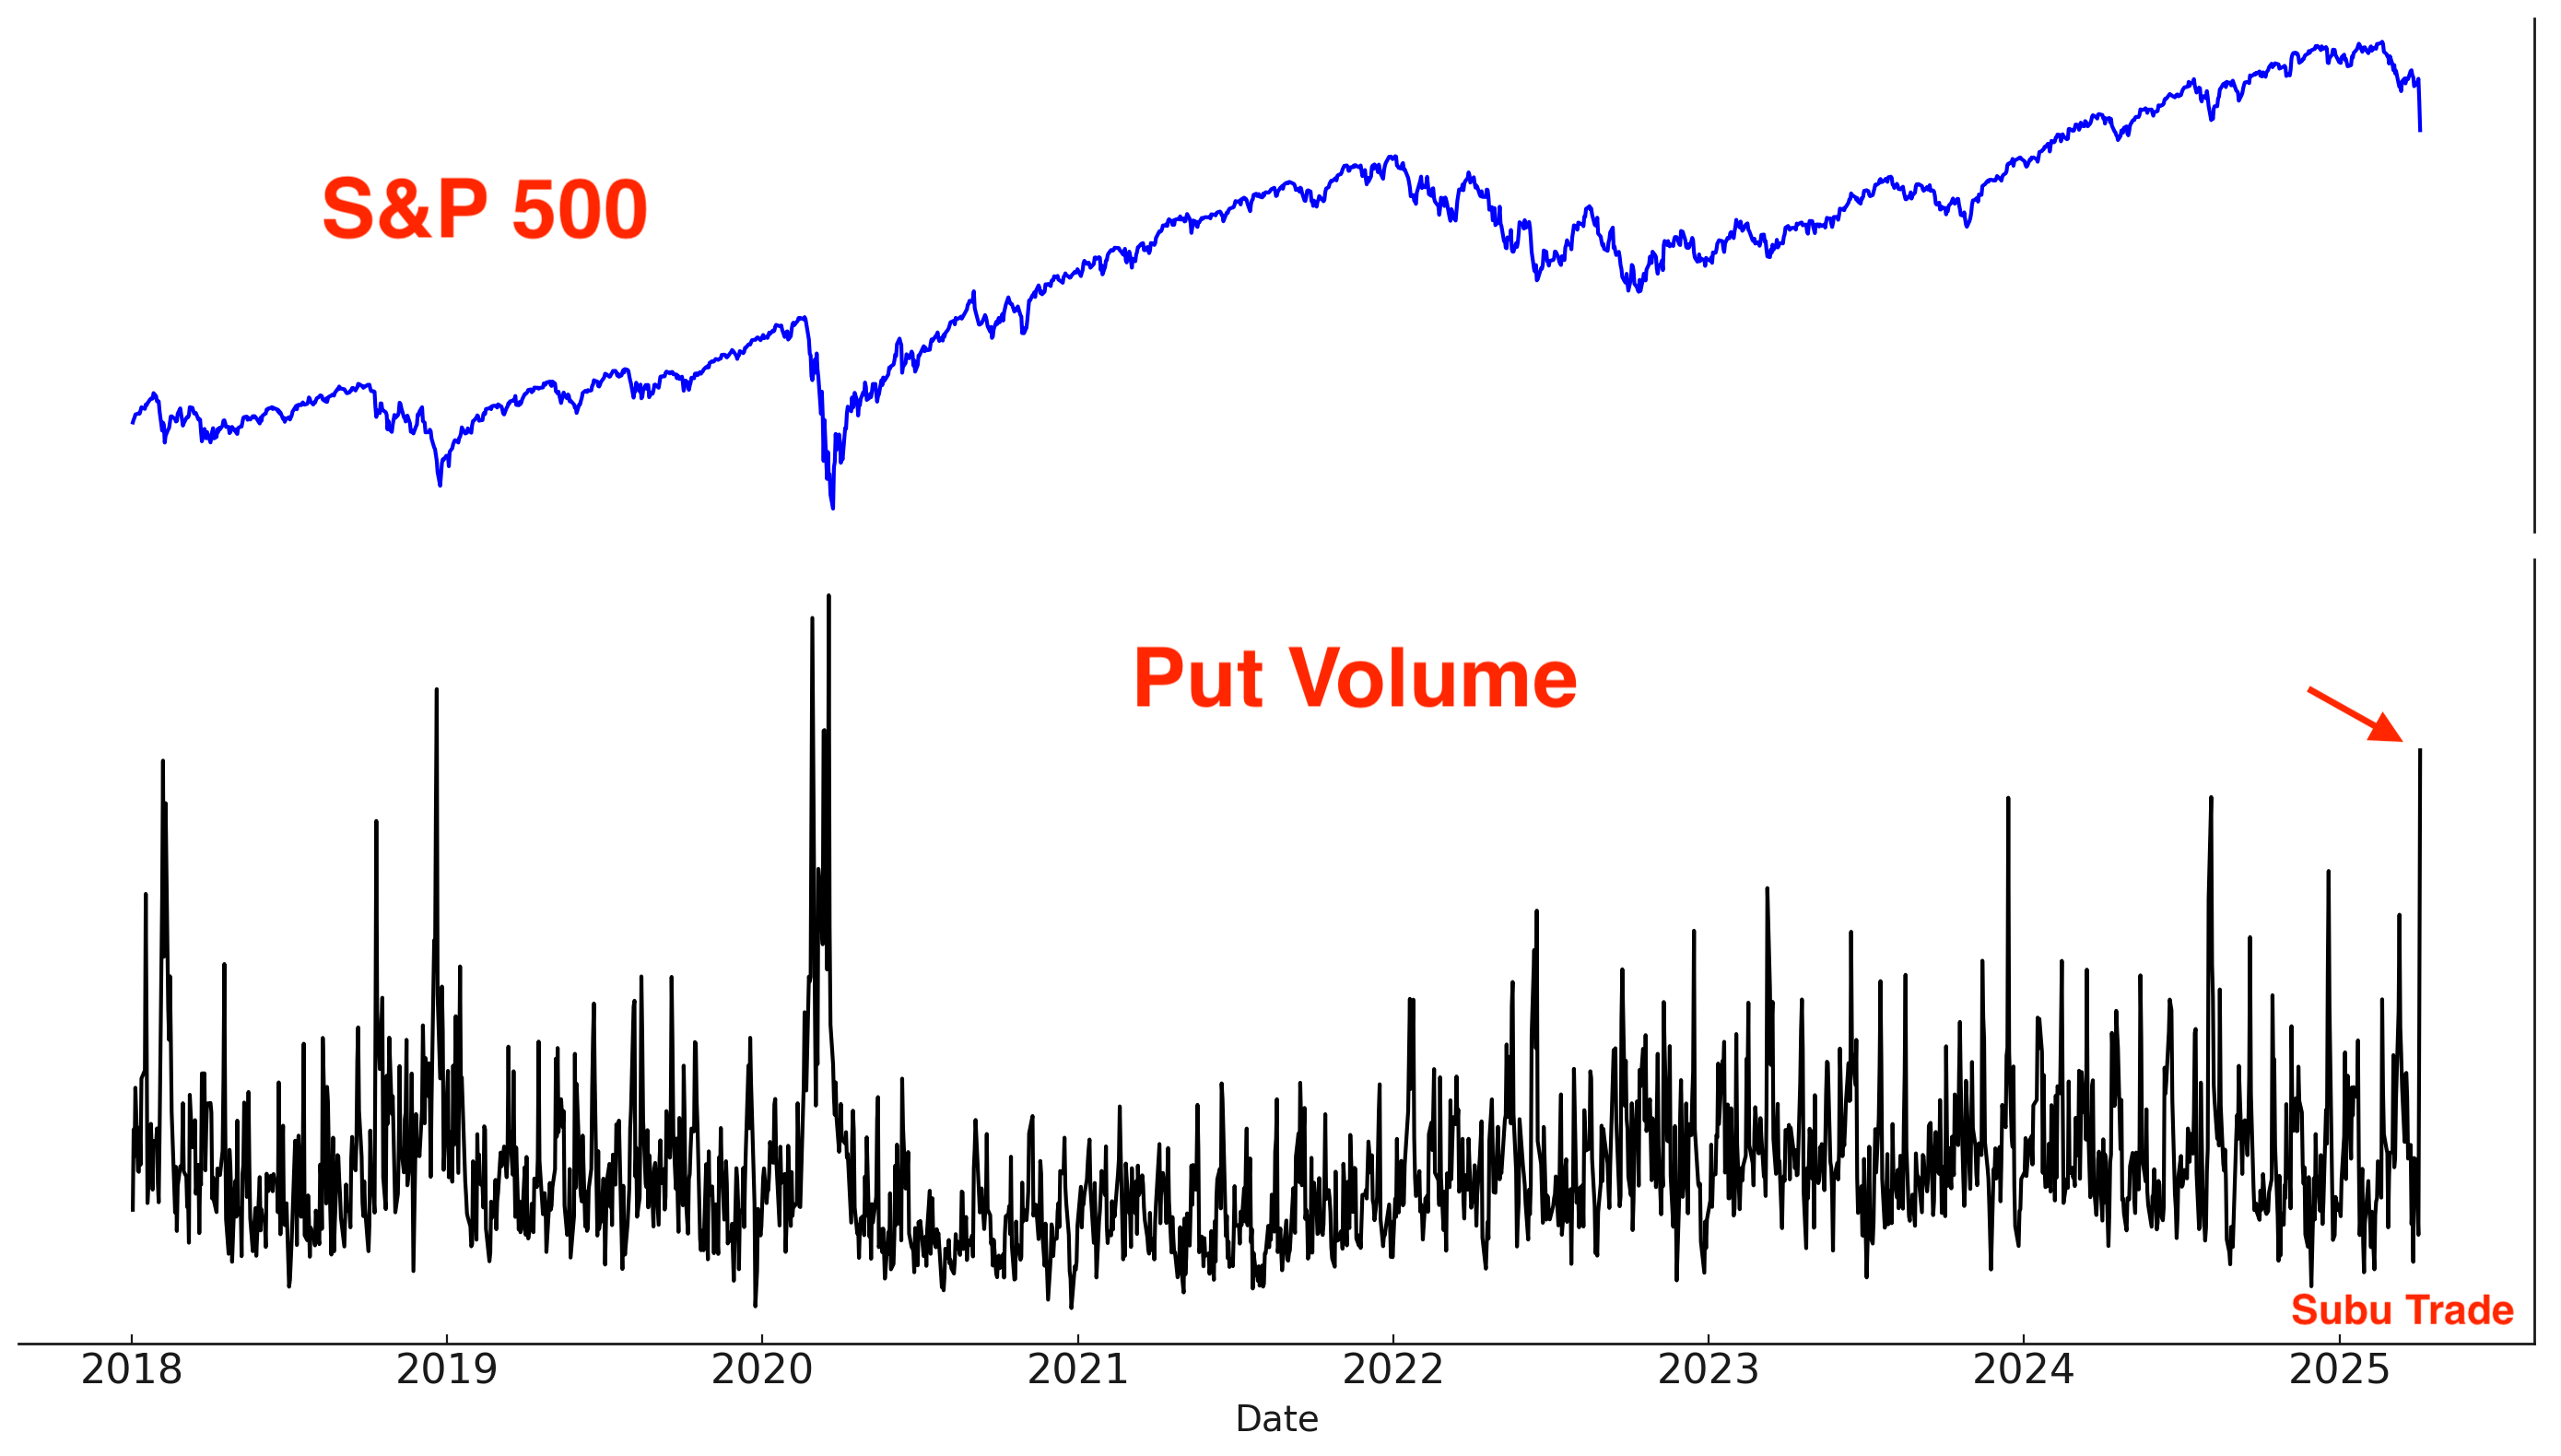
Friday saw record-breaking options volumes. Given the stock market’s crash, it’s not surprising that there were more Puts than Calls. Overall, options data illustrates a scene of panic.
$ value of SPY Call volume - Put volume:

Volatility
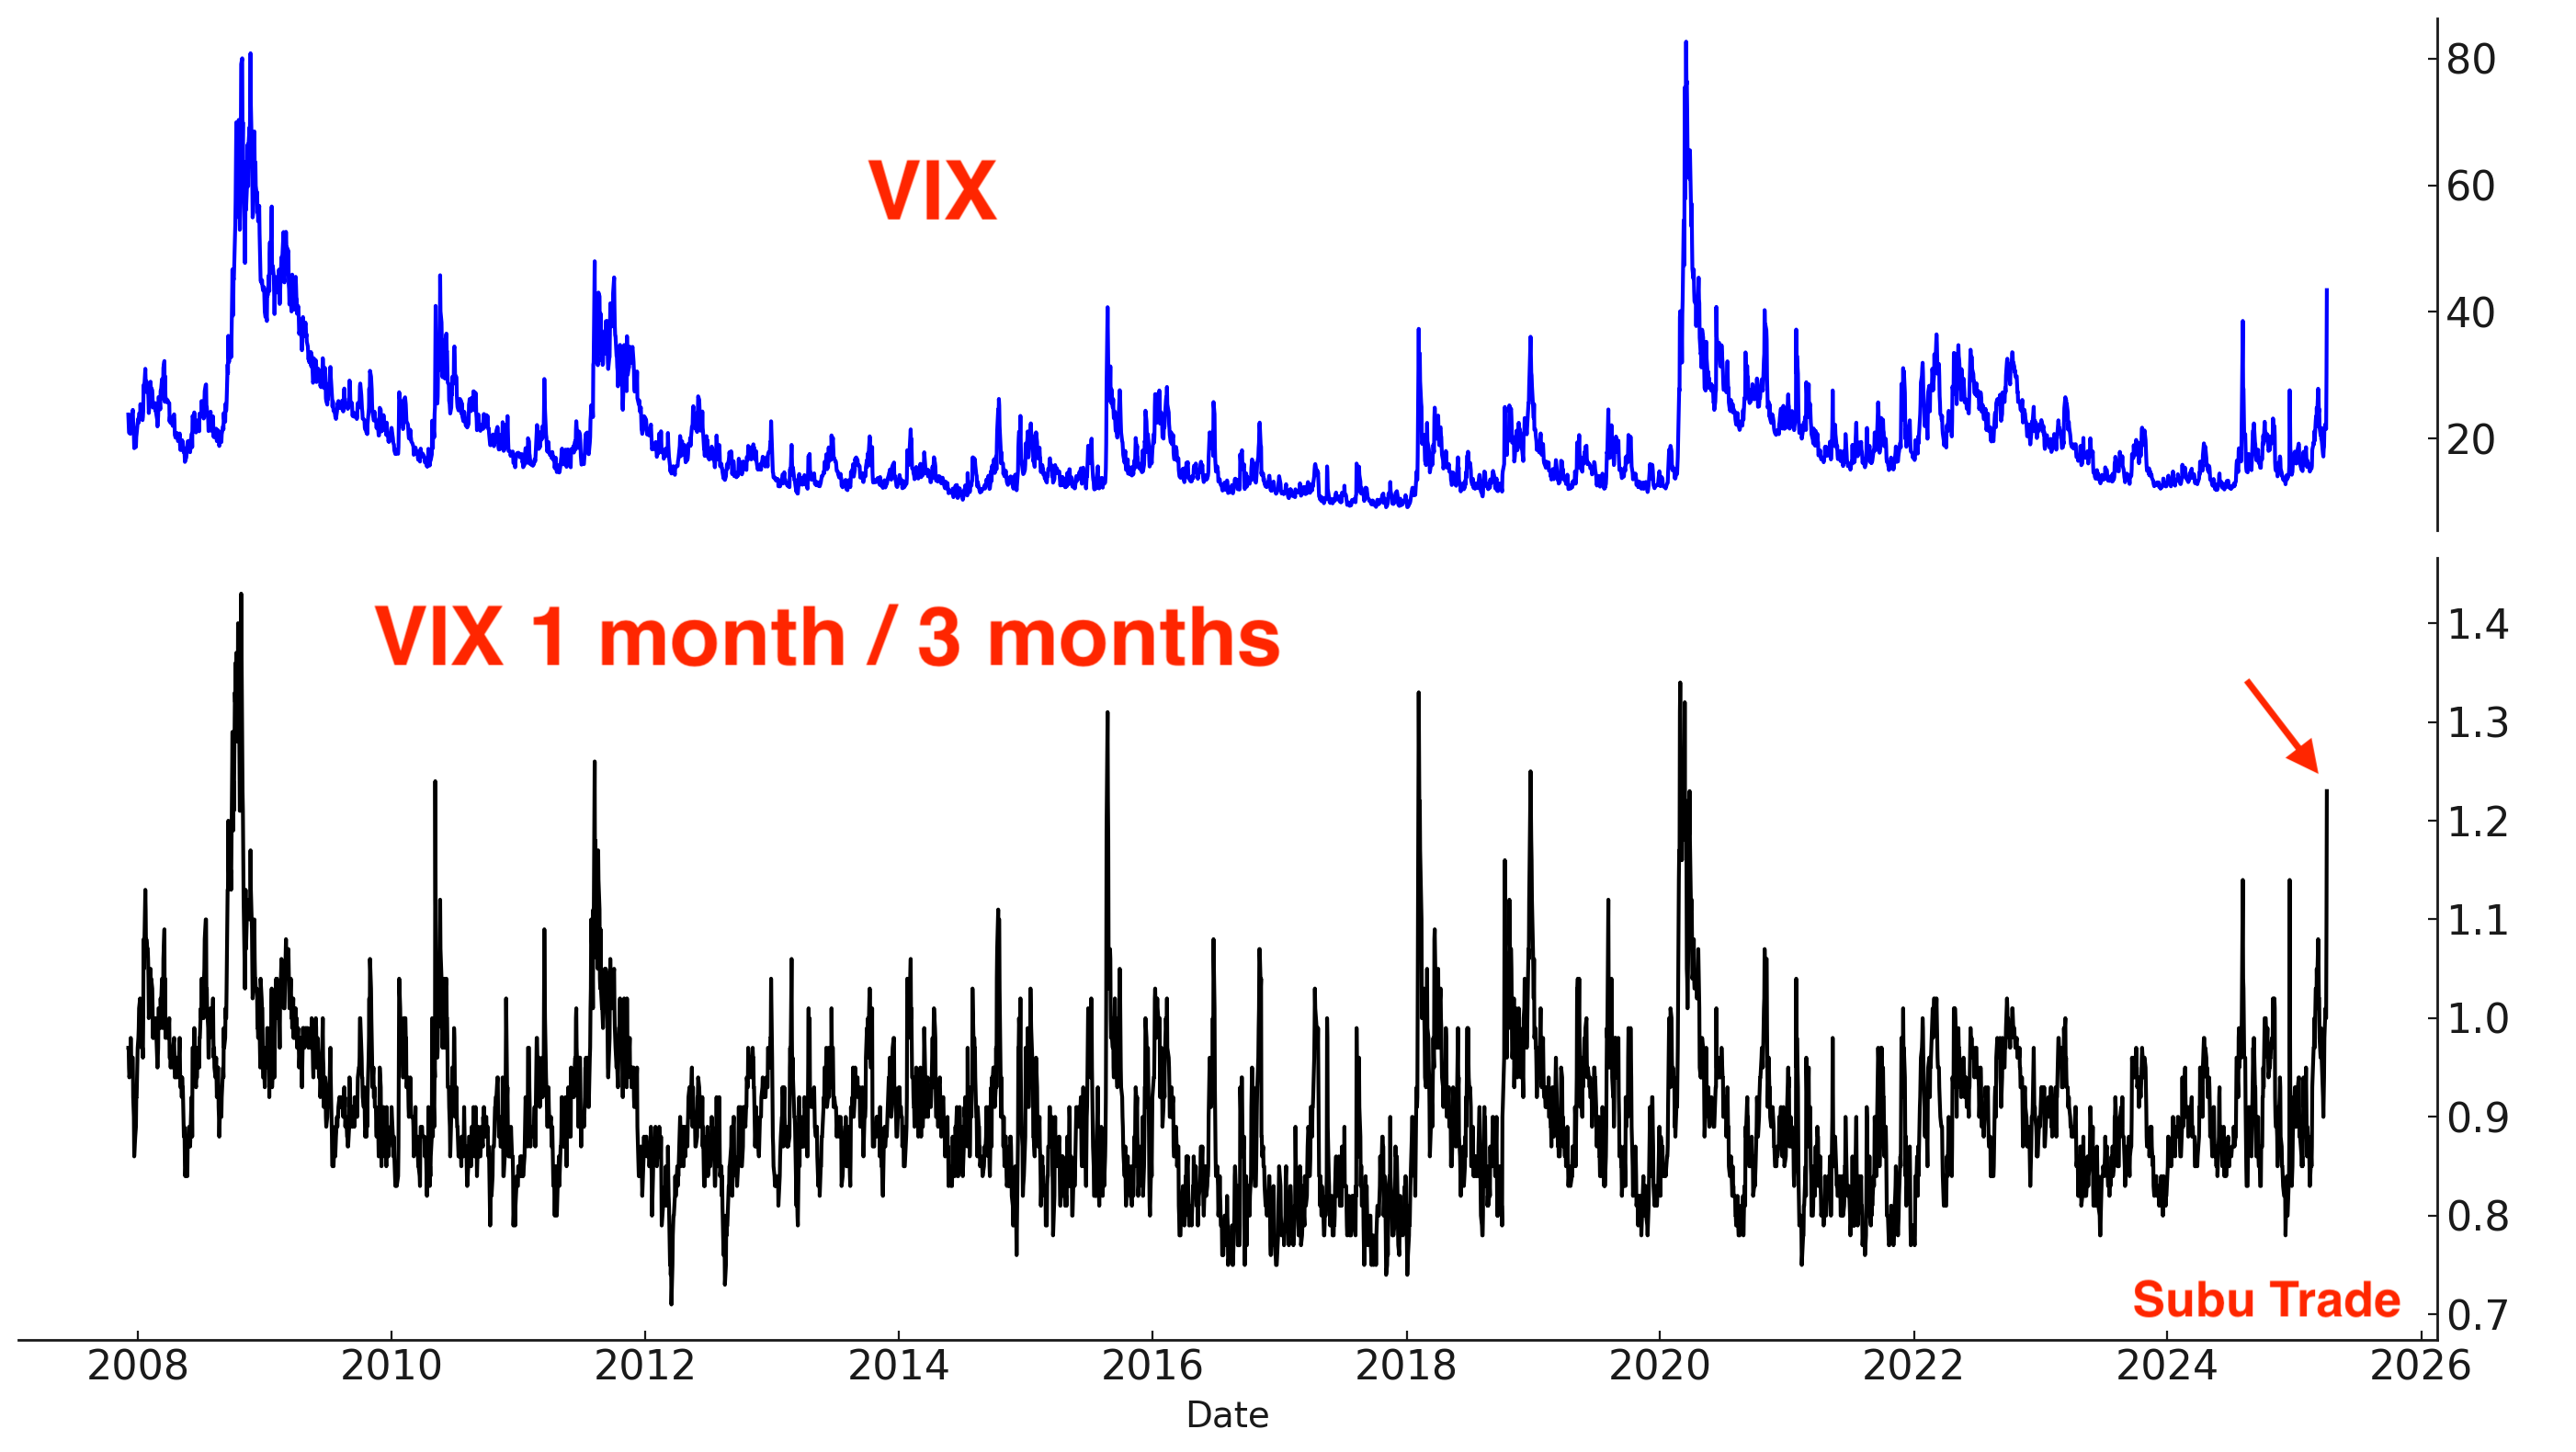
VIX spiked on Friday to 45.


Here’s what VIX did next:

Thursday and Friday were 2 consecutive days of more than -4.5% declines: this happened during some of the worst market crashes in history.

Similarly, the NASDAQ Composite fell more than -5% for 2 days in a row. This only happened during huge crashes:

VIX term structure is inverted:

As I mentioned on Monday, it’s not common to have this kind of decline straight from all-time highs. Granted, stocks have fallen more over the past few days.


Options (continued)
SPX put volume jumped to the highest level since the COVID crash:
QQQ put volume: new all-time high

IWM put volume: spiked

HYG put volume: new all-time high

VIX $ value of Call volume - Put volume:

Breadth
45% of S&P 500 stocks are now oversold:


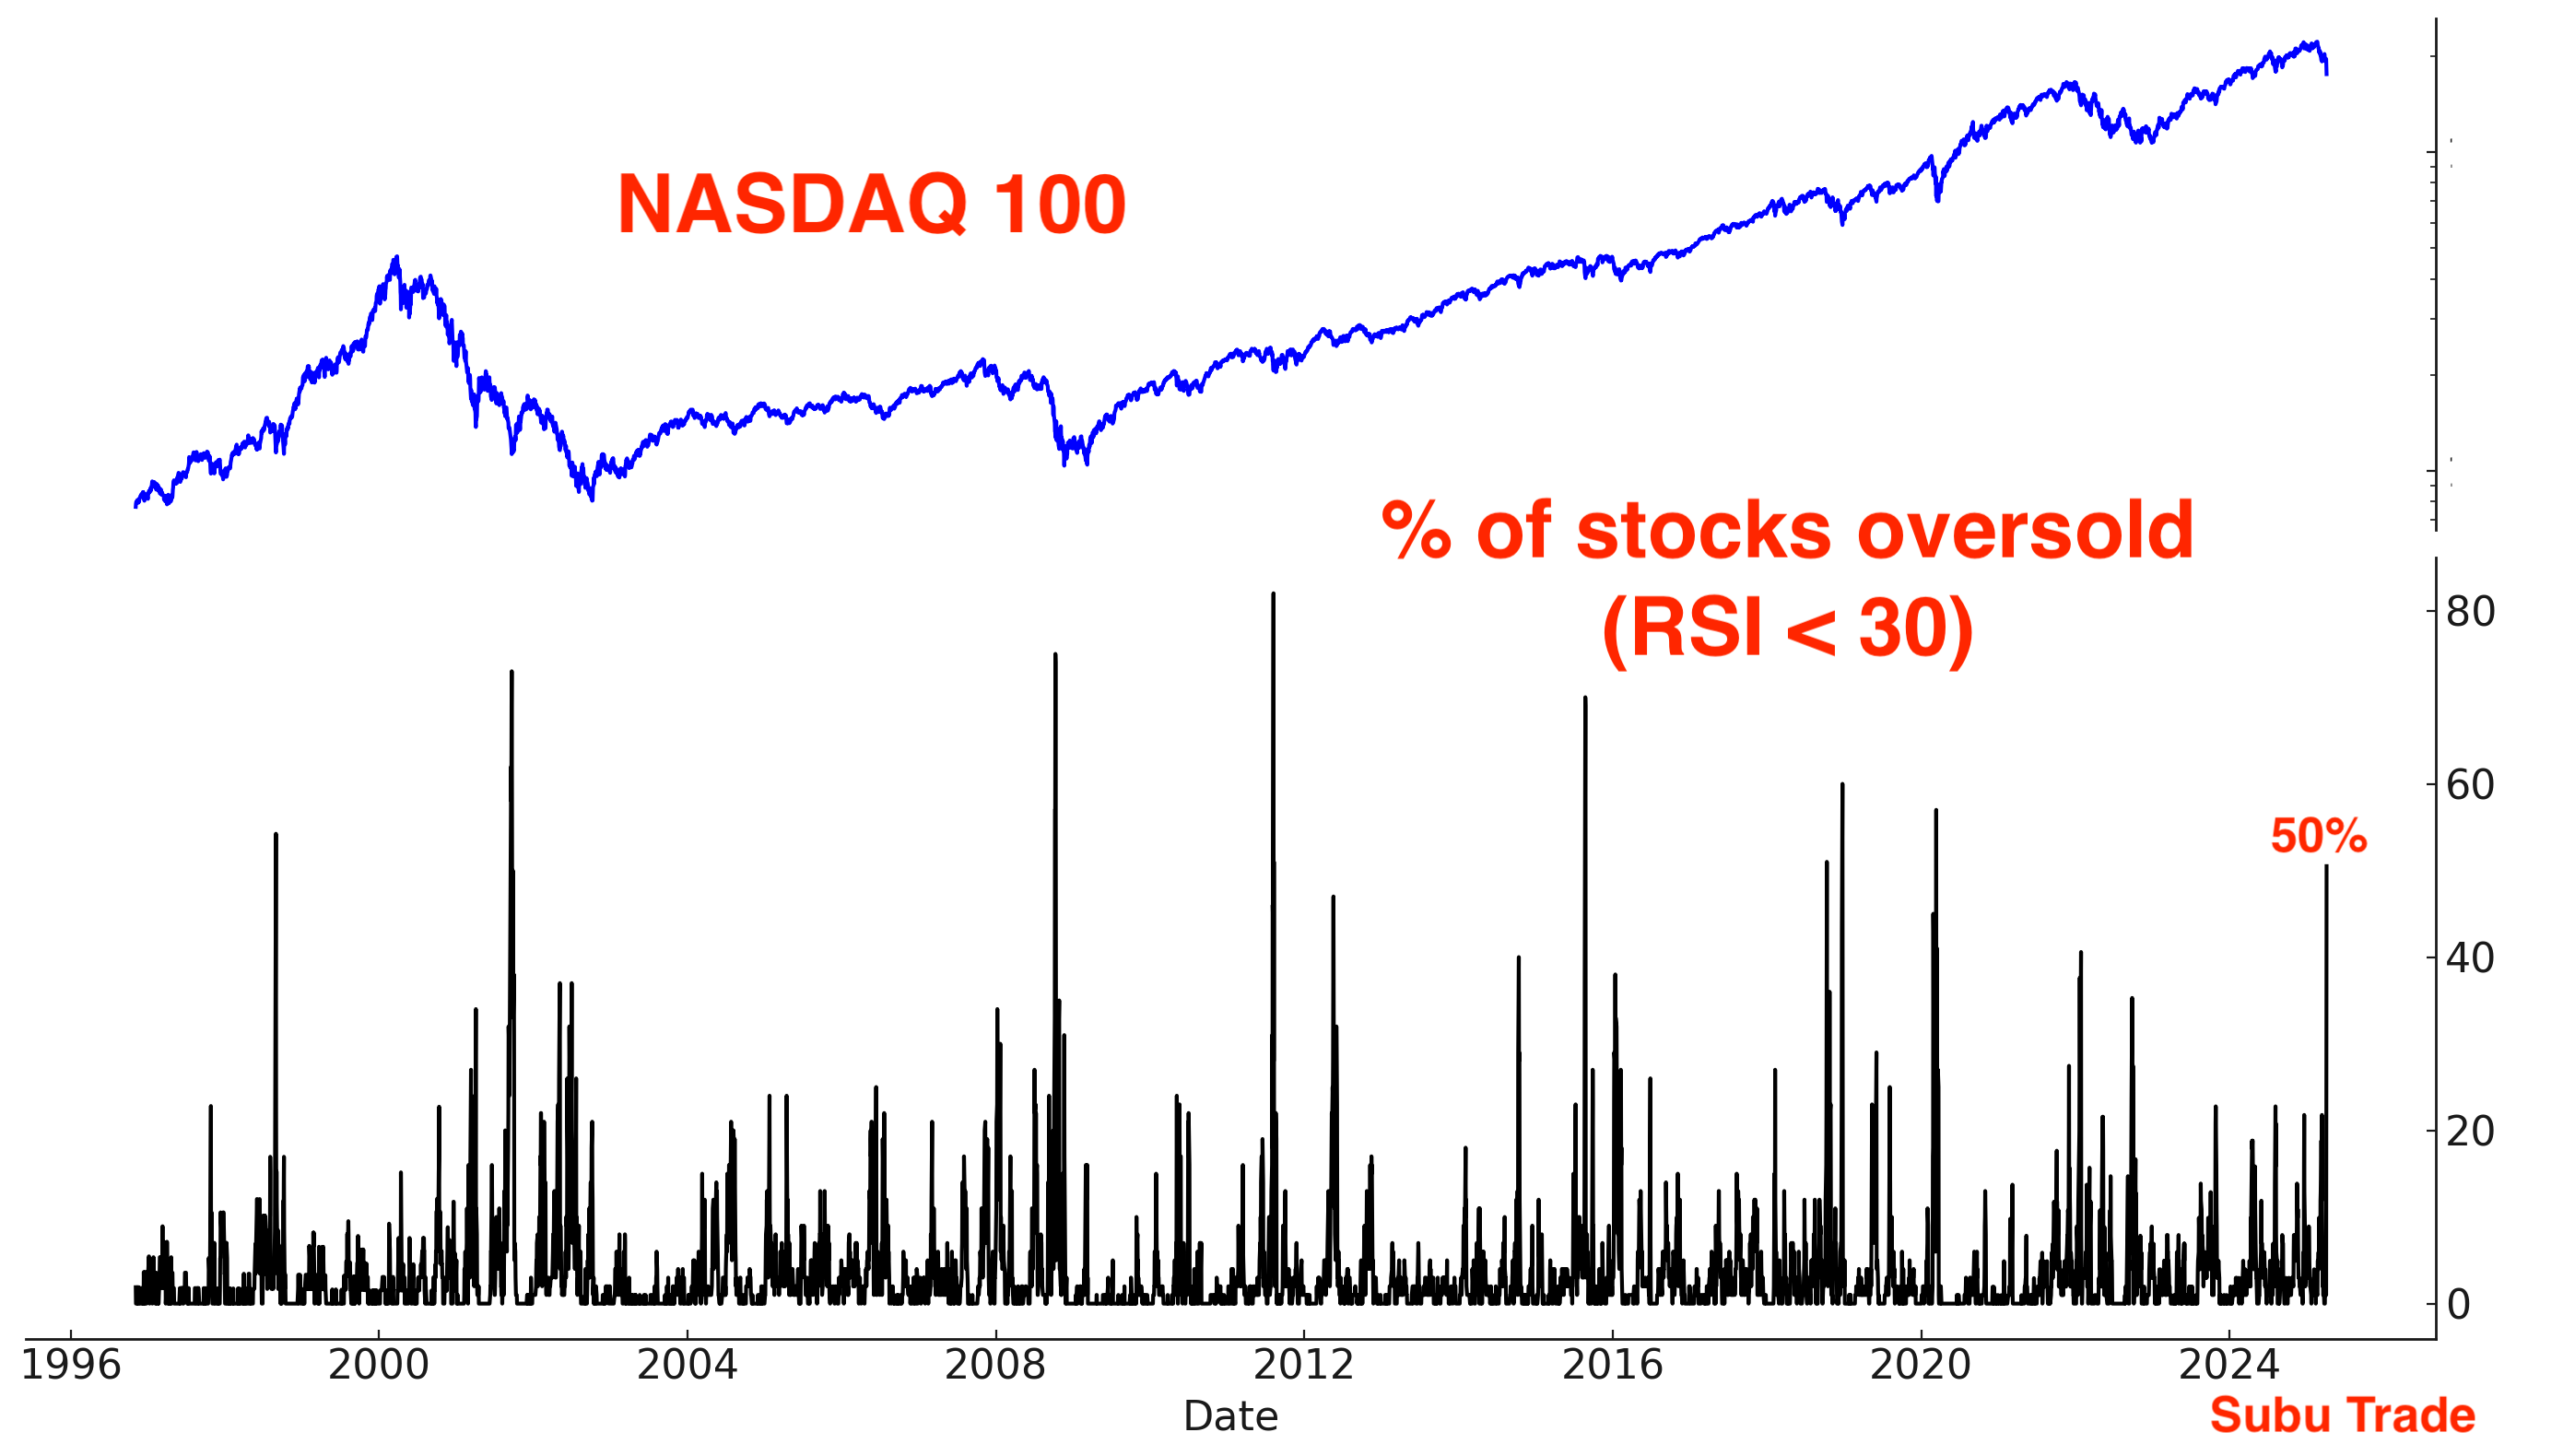
Half of the NASDAQ 100 stocks are oversold:
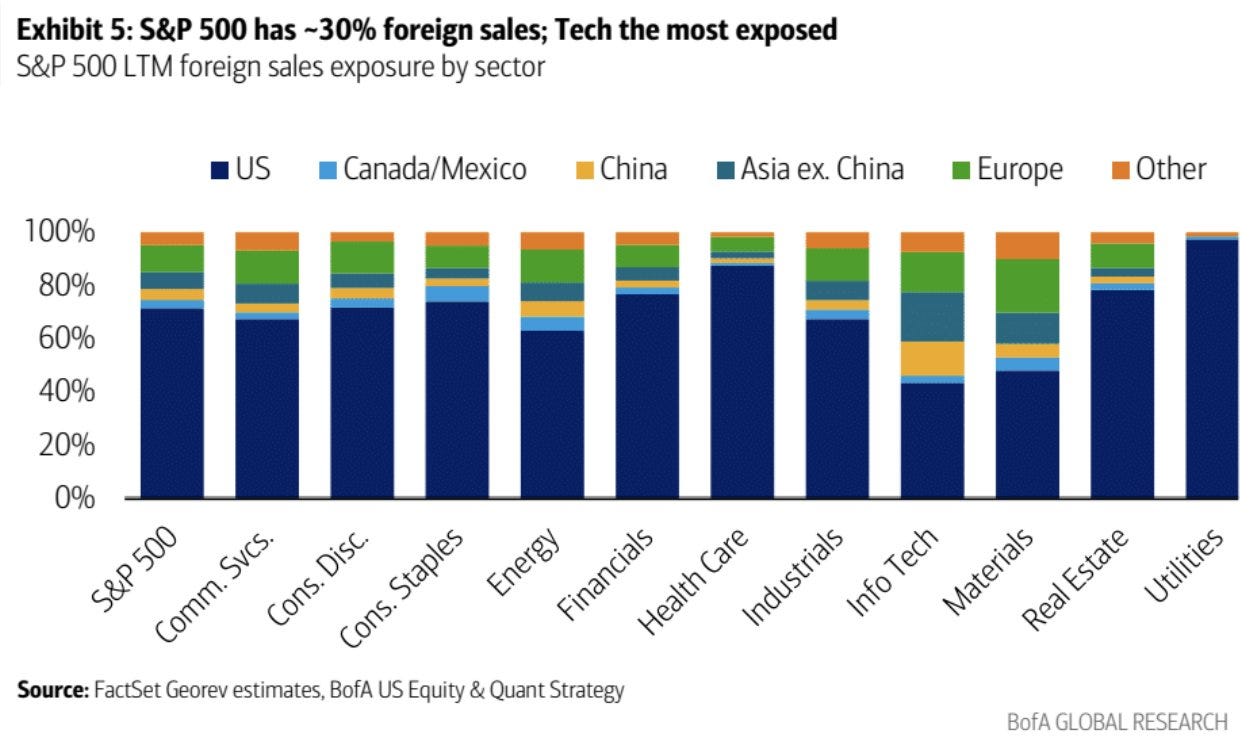
The NASDAQ’s sharp selloff is not surprising, since Technology accounts for a greater % of its revenue abroad, which makes it a prime target for trade war retaliation:
*The Nuclear Option for Europe: ban Google/Facebook and replace them with European startups. Not hard to build an alternative and overcome Facebook’s business moat (Network Effects) if the EU places a regulatory ban. This remains highly unlikely, but nonetheless is the Nuclear Option.
71% of S&P 500 stocks have crashed below their lower Bollinger Bands (i.e. 2 standard deviations below their 20 day moving average):


Friday saw a jump in the % of stocks at 52 week lows:
*Keep in mind that the S&P is only down -2.5% from where it was a year ago, hence why this figure isn’t extremely high.

Almost 2/3 of stocks are in a bear market (-20% below 52 week highs):

Corporate Insiders
Insider buying remains subdued relative to selling—suggesting even corporate insiders are cautious amidst the uncertainty of this unprecedented trade war.
There is no notable spike in the Insider Buy/Sell Ratio:

Volume
Market crashes are typically marked by volume spikes, while rallies see declining volume. While most traders look at SPY and QQQ volume, I also monitor inverse ETFs like SH.
*Inverse ETFs go up when the market falls, and go down when the market rises.
This week, the dollar value of SH’s volume surged—a notable signal. Dollar volume is key here, as volume alone can be misleading. As markets trend higher over time, inverse ETFs decline in price, inflating share volume without reflecting true demand.

Fund Flows
I shared a lot of fund flow data in recent Markets Reports, but today I want to focus on a sector that stands out: energy. If this isn’t the end of the world (which I don’t think it is), oil prices and energy stocks are positioned for a rebound.
XLE non-stop outflows over the past 3 months:

High beta vs Low volatility
It’s worth nothing that High Beta stocks were crushed in recent weeks. Low volatility stocks such as Warren Buffett’s Berkshire Hathaway were holding up well until the panic selling on Friday, when everything crashed.
*There’s a fantastic research paper called “Buffett’s Alpha”, which analyzes the “factors” that Buffett tilts towards. Buffett is exposed to the Betting-Against-Beta and Quality-Minus-Junk factors, with 1.7x leverage. I highly recommend you read this.

Sentiment
Needless to say, sentiment collapsed. Here’s the S&P 500’s Daily Sentiment Index:
CNN Fear & Greed collapsed:
Sentiment surveys
Sentiment surveys are extremely bearish. Keep in mind that these surveys were taken before the Thursday/Friday crash. Next week’s sentiment survey data will be historic:
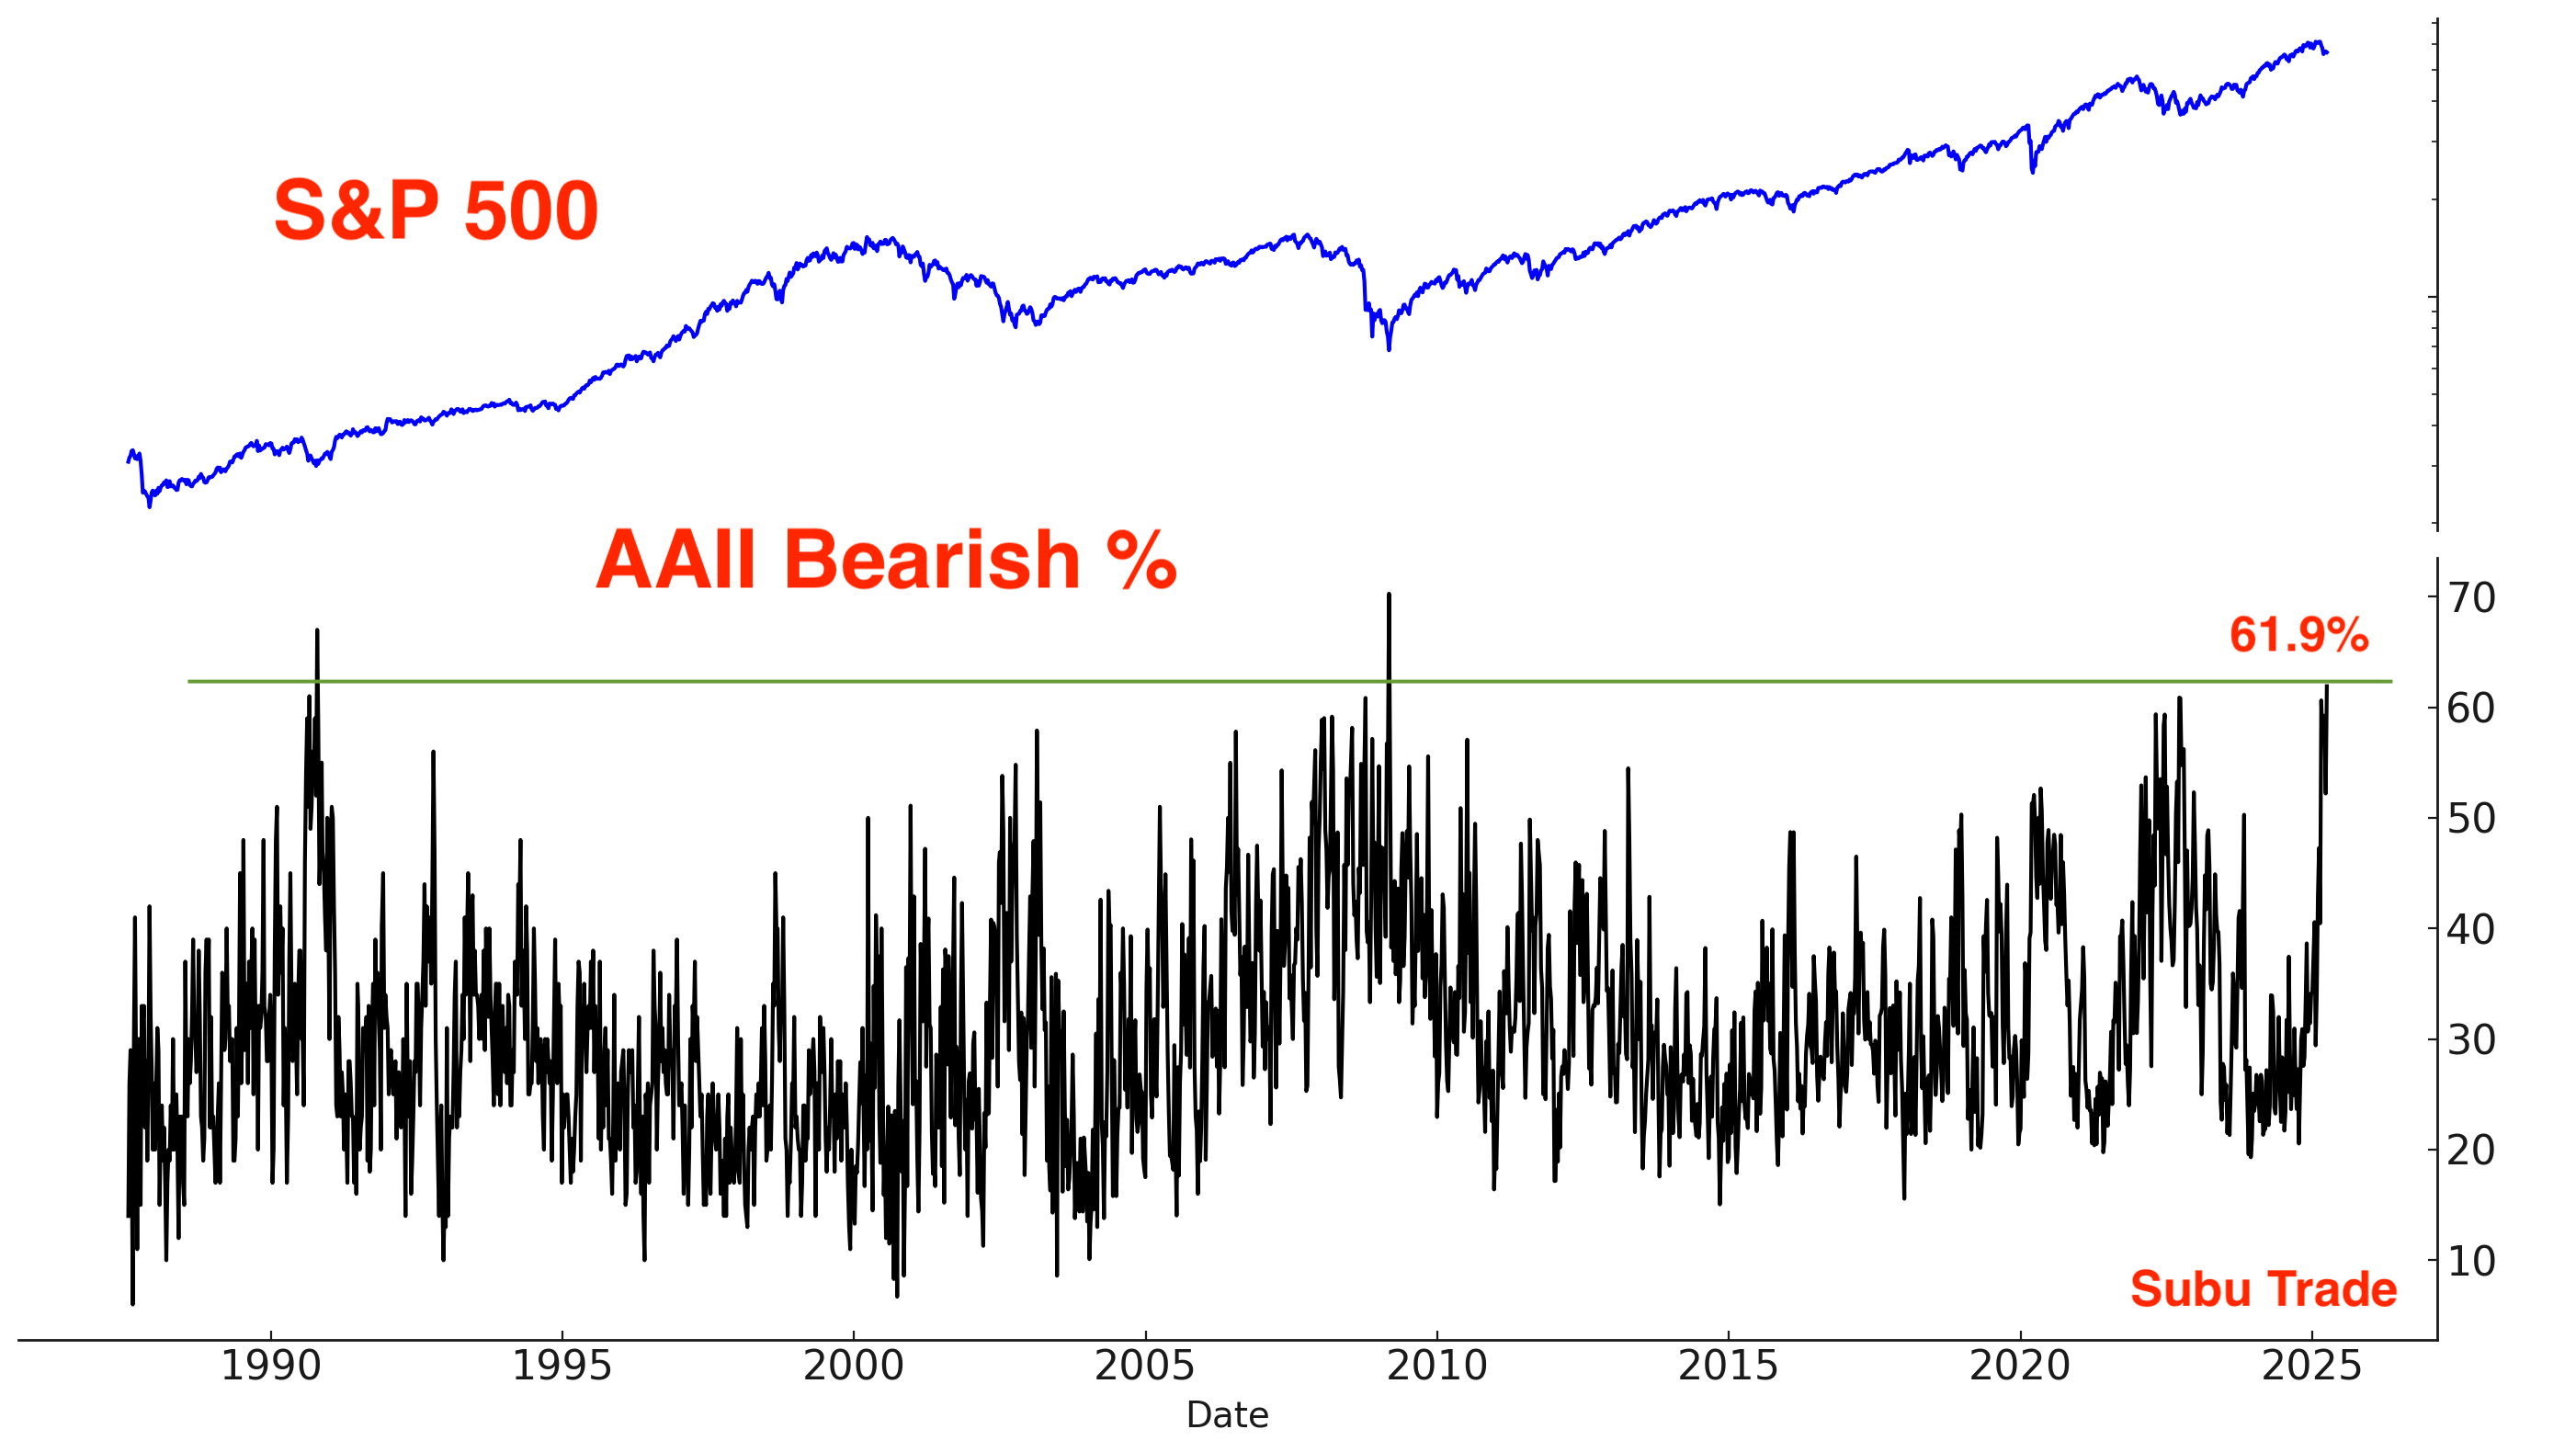

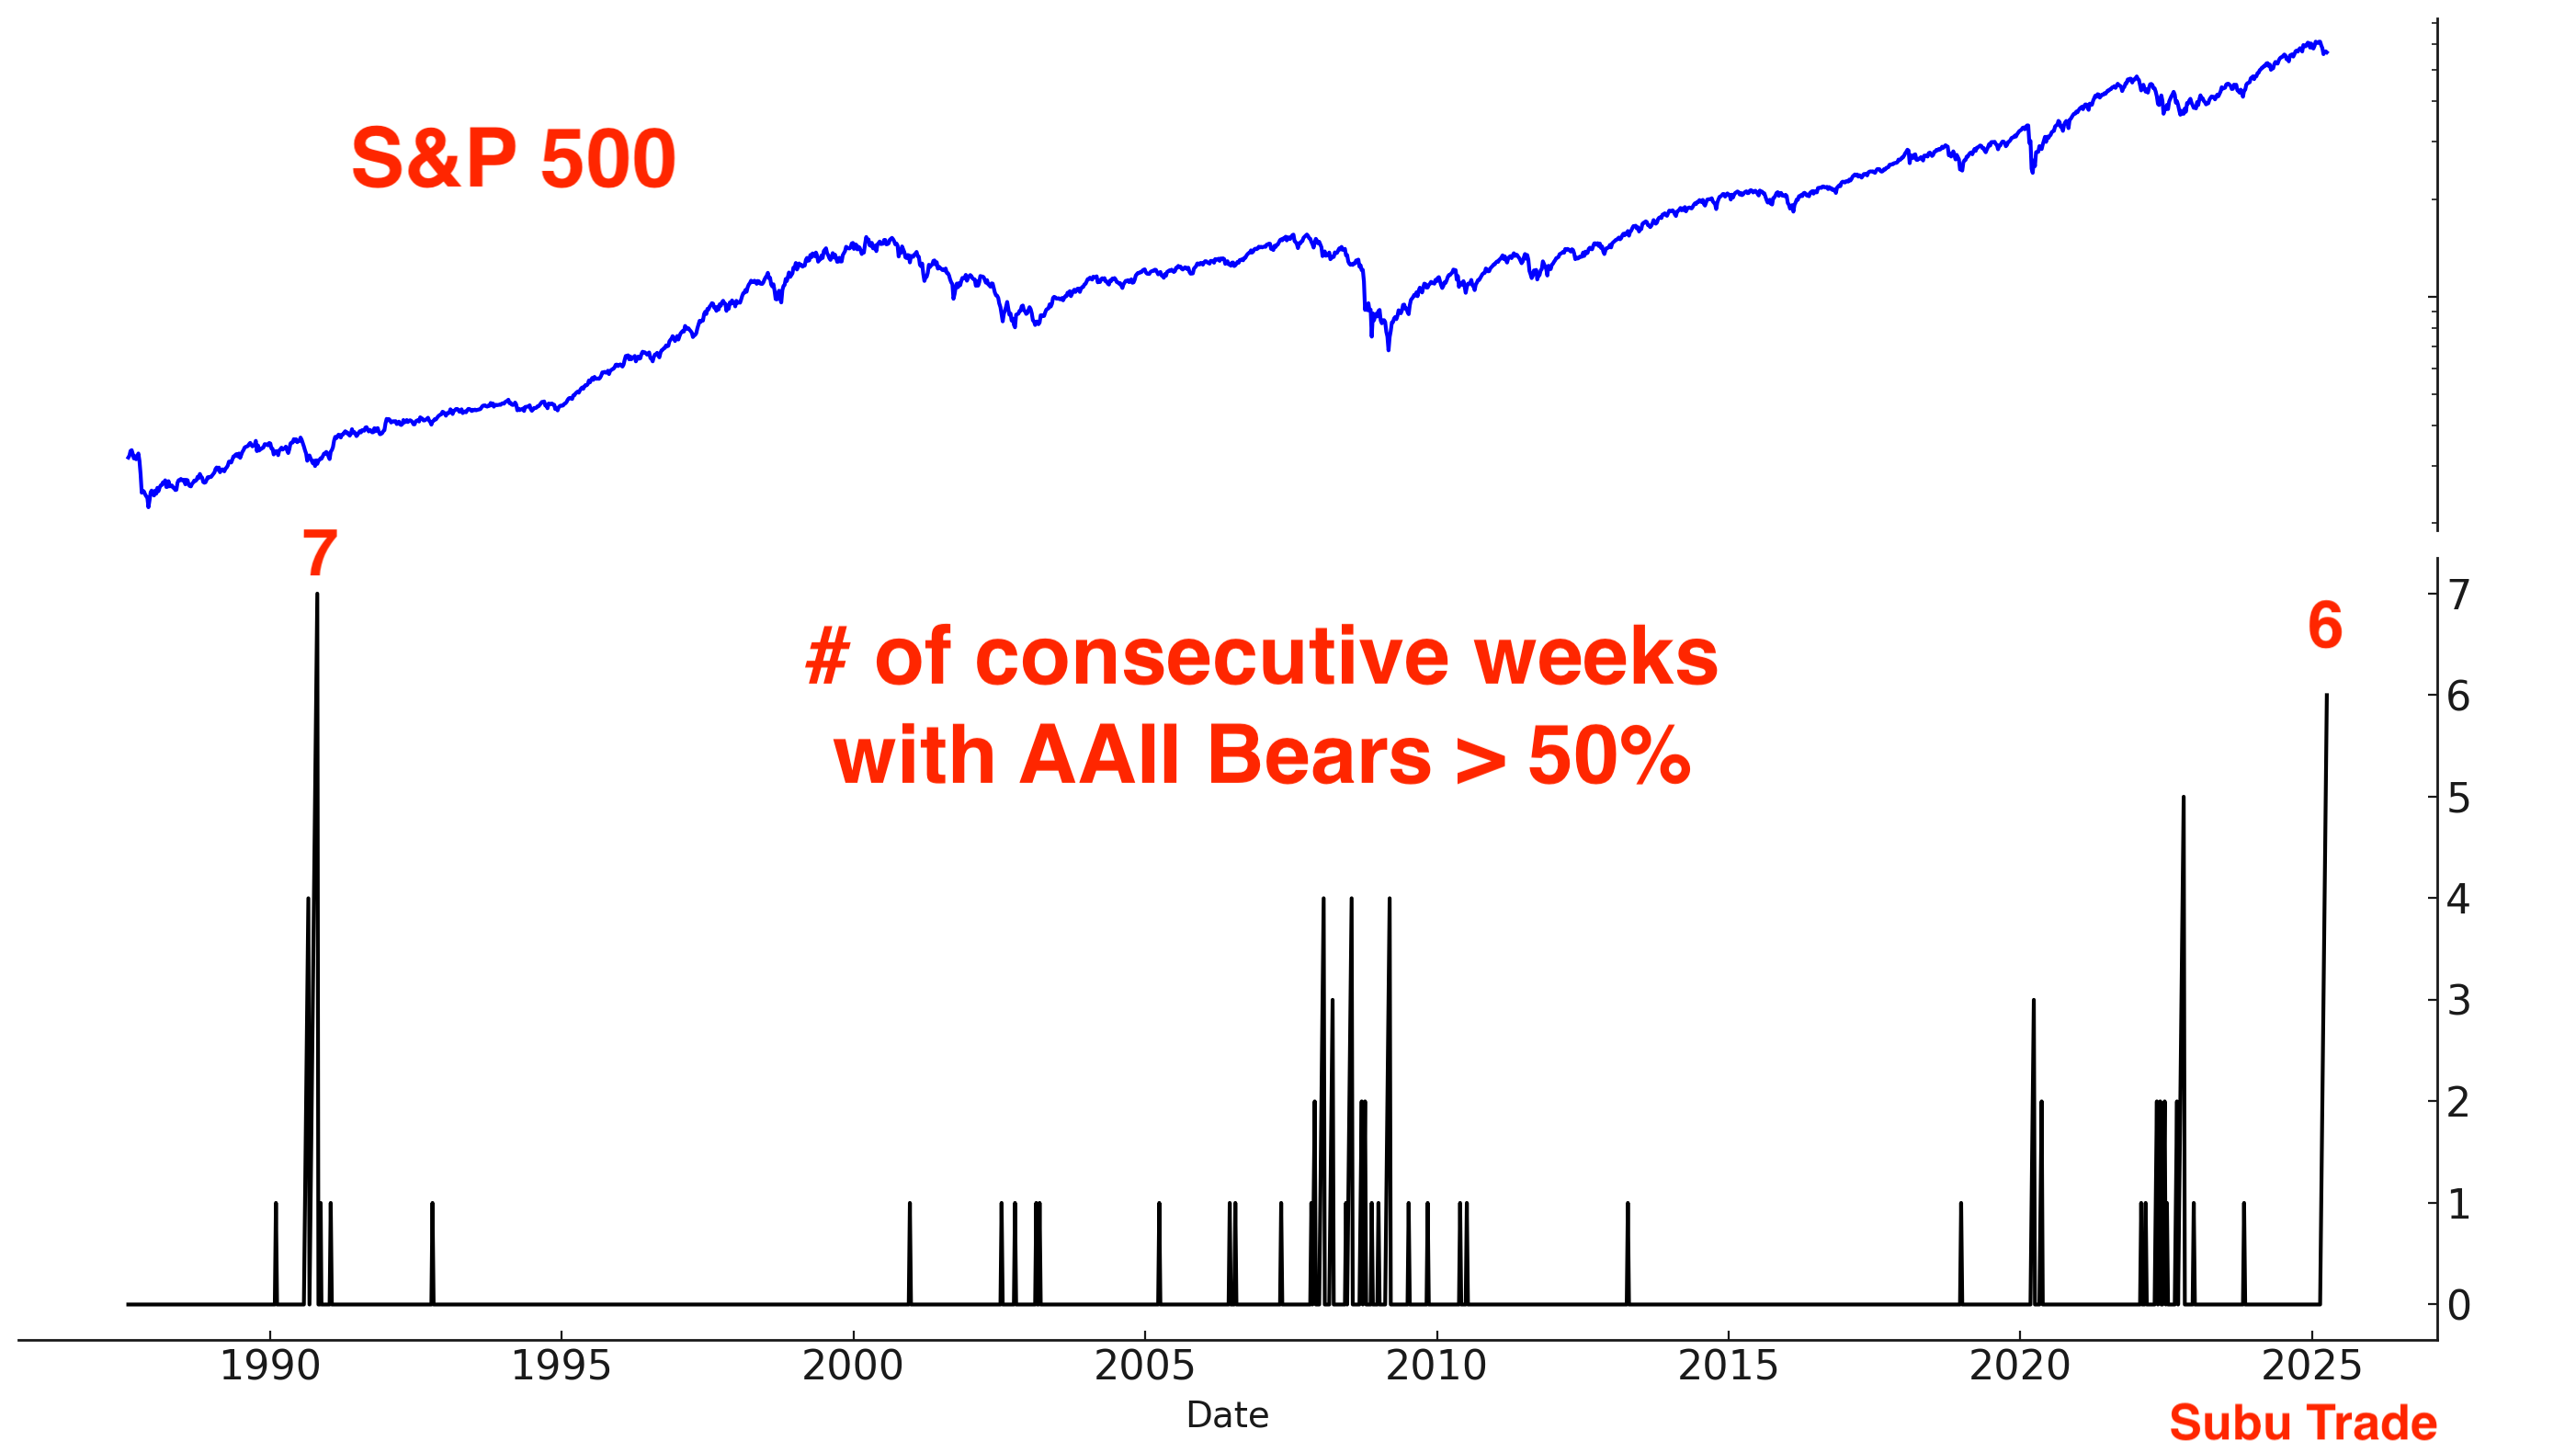
It’s been 6 weeks with AAII Bears > 50%. Next week will probably be 7, tying the longest streak in history (1990).
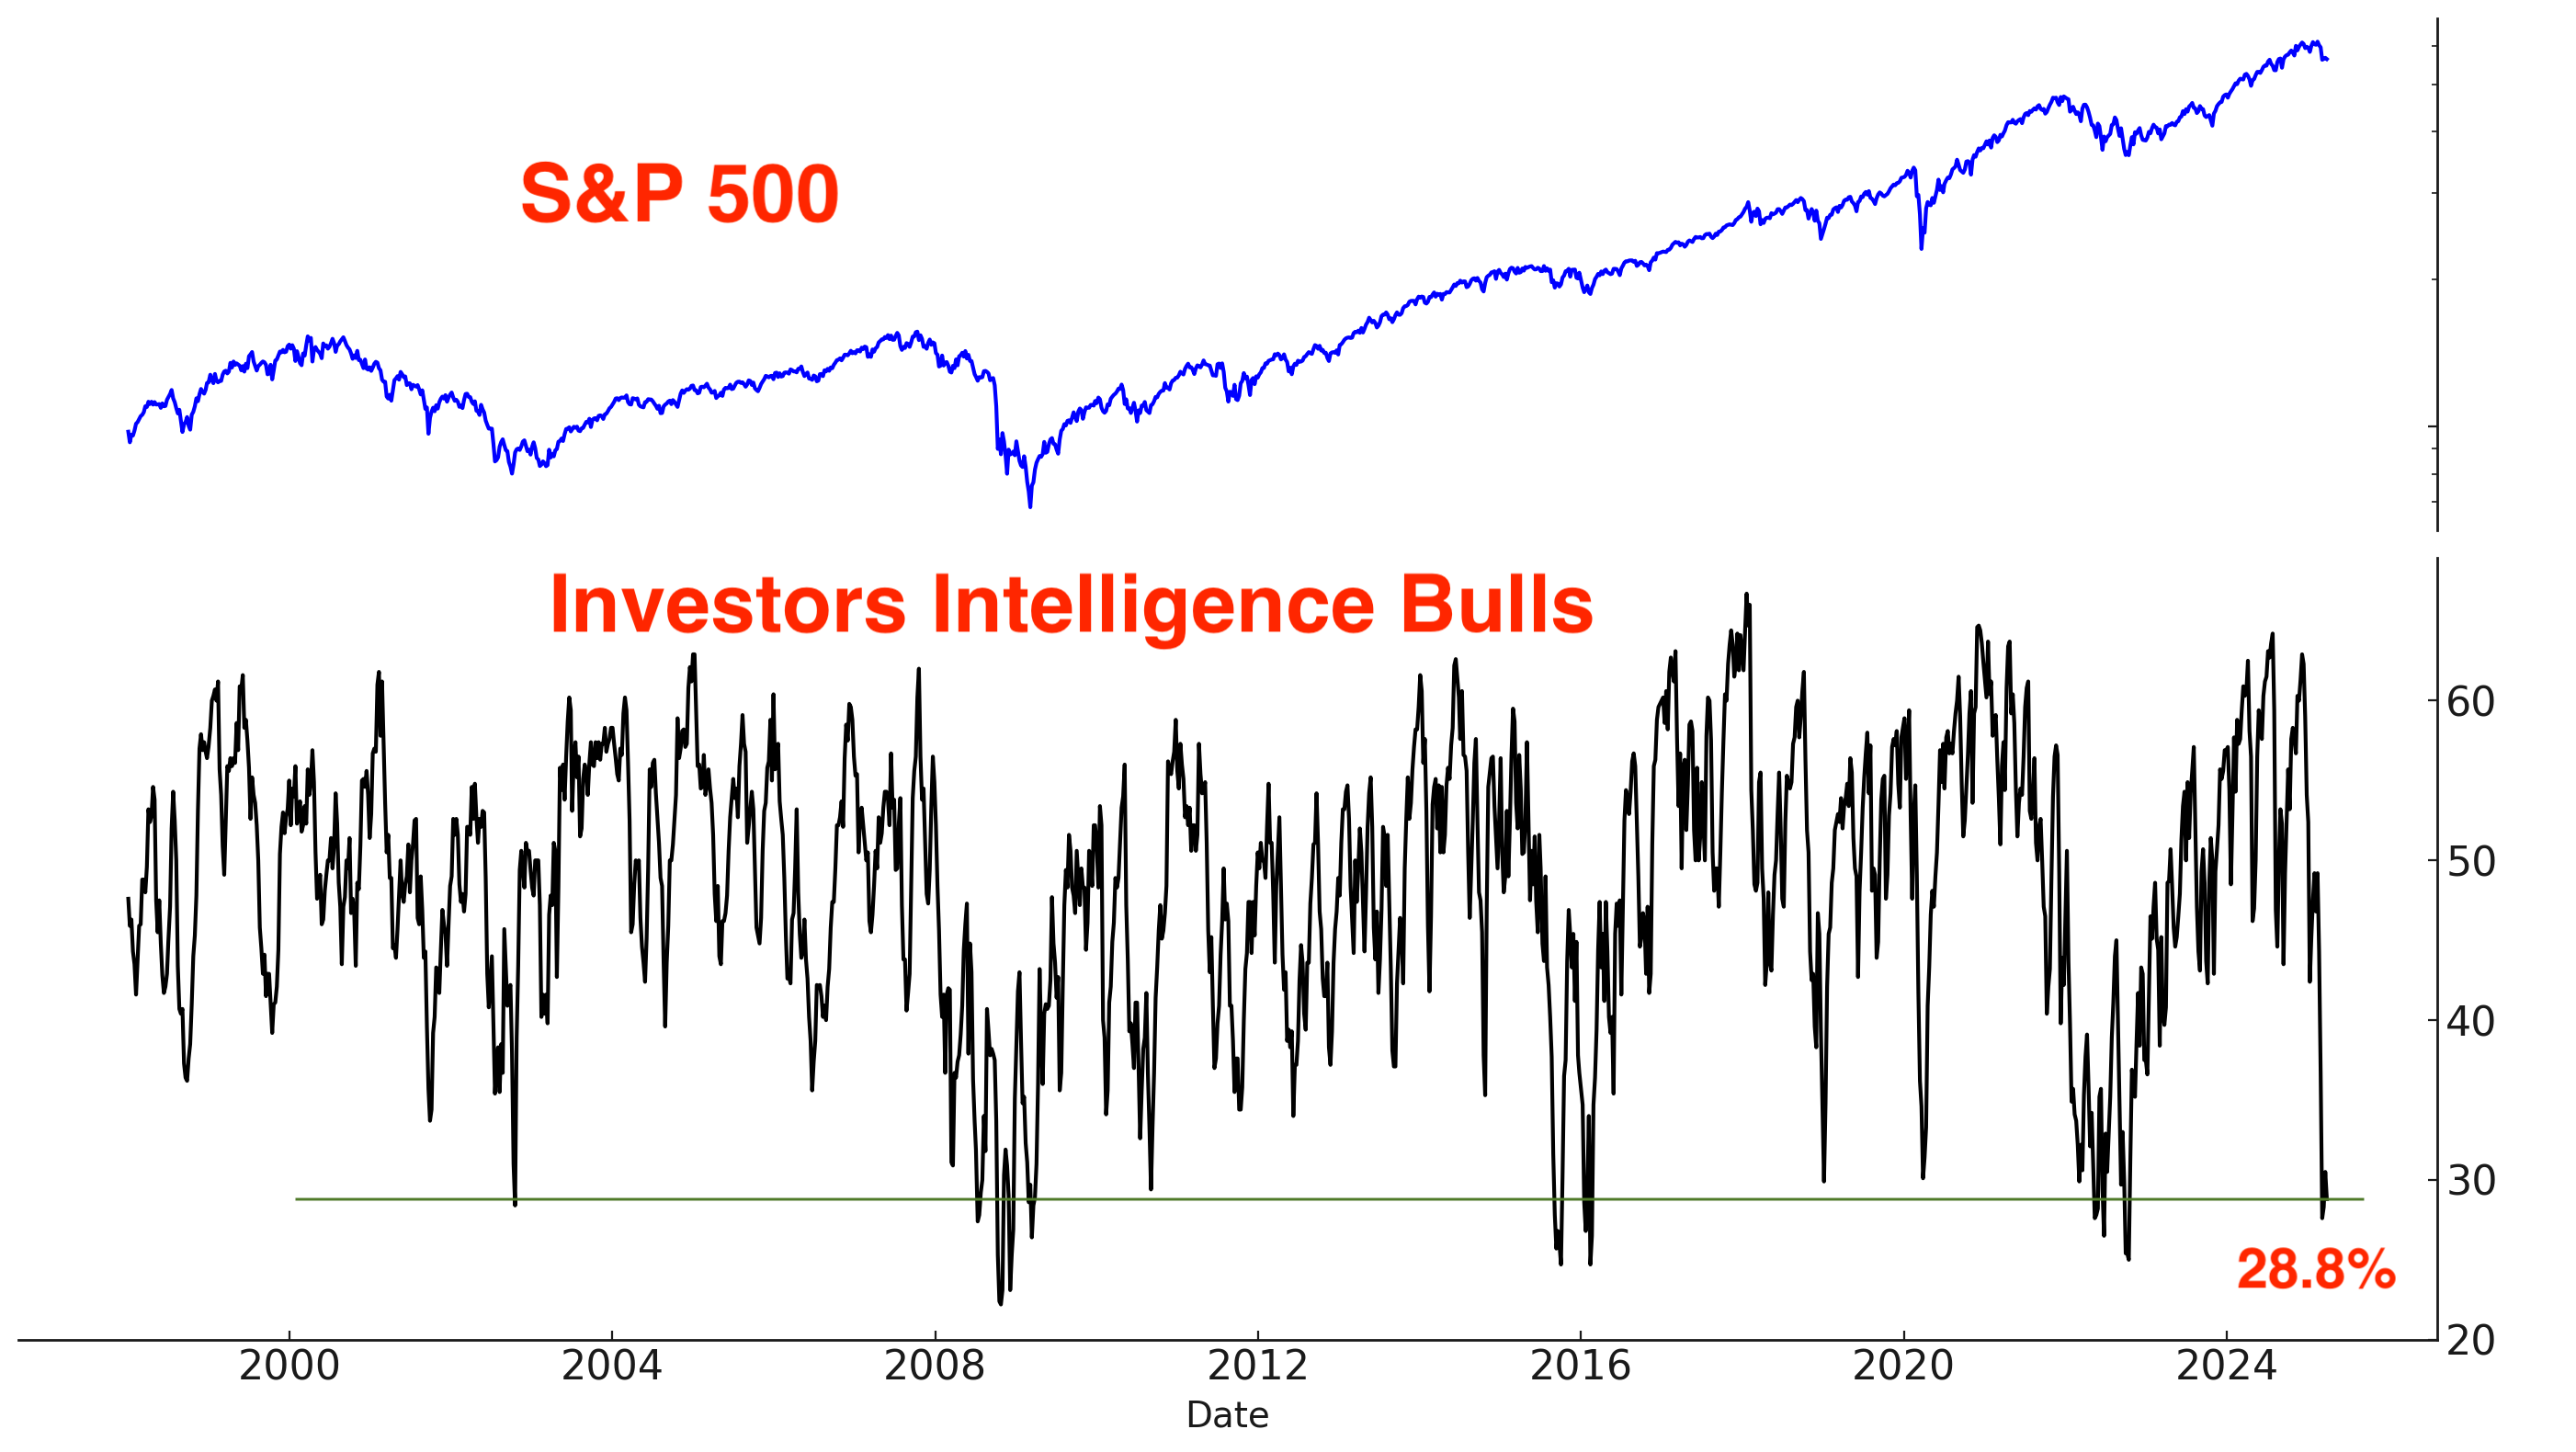
Investors Intelligence Bulls:
Asset Managers:

Trend
The trend is your friend, until it ends. The U.S. stock market is trending down.
Why does this matter? Because at least from a trend following perspective, it’s better to buy when the market is trending Up (e.g. above its 200-DMA) than when the market is trending down (e.g. below its 200-DMA). This doesn’t mean that the market can’t bounce from below it’s 200-DMA. It simply means that risk and volatility are higher down here.

My Market Outlook & Portfolio Positioning
Let’s assume a worst-case scenario, that this is the start of a larger bear market & recession. Even if this is the start of a larger bear market, the stock market is due for a bounce.
So why not go max long, all-in right now? Because unprecedented events—Black Swans—do happen. Before October 1987, a crash of that magnitude had never occurred. It's critical to weigh the probabilities of various scenarios and size positions accordingly. Traders should use smaller position sizes during periods of heightened volatility. Market Outlook matters, but it’s position sizing that ultimately determines how much $ you make when you’re right and how much $ you lose when you’re wrong.
I believe that a 1-day crash like Monday October 19, 1987 when the S&P fell -20% is unlikely (Jim Cramer thinks it could happen!). However, the small probability of a Black Swan crash cannot be ruled out.
This trade war is obviously negative for the global economy, and it would be interesting if China and/or the EU respond with emergency fiscal stimulus.
Bottomline: Any news/rumors about a trade deal will generate a stock market bounce. After that initial bounce, we must re-assess the macro environment. Stay open minded, stay vigilant.
*Click here if you don’t understand how I trade
Mean-Reversion Position (Non-Core) – Long Oversold Tech Stocks:
Currently 10% of my portfolio, willing to go up to 25% if stocks fall more. Targeting at least a mean-reversion bounce. No increase in position size so far, will incrementally increase if stocks plunge on Monday/Tuesday (a final flush).Core Position – Long Gold and Silver: long with trailing stops. Stops have not been hit. Monitoring closely.
Mean-Reversion Position (Non-Core) - Long Indian Equities: Big beneficiary of Trump’s tariffs.
Mean-Reversion Position (Non-Core) – Long U.S. Treasury Bonds: Small position size.
Black Swan Position – Long Chinese Equities: CUT small long position. Trailing stop was hit.
Bitcoin
A quick note on Bitcoin. Bitcoin is a high-beta, risk-on asset that generally rises when stocks rally and struggles when stocks fall. While its directional correlation with stocks is clear, its price action is unique—less wave-like, more staircase: sharp moves followed by prolonged consolidation.
Interestingly, Bitcoin has outperformed stocks during this crash—a divergence worth noting. I have no position in crypto, but a stock market bounce will probably coincide with a Bitcoin rally.
Gold & silver
Last week I highlighted a key problem for gold: gold had rallied too much, too quickly.


Gold fell a little this week and silver got crushed, pushing the gold:silver ratio to 100!
Despite this week’s pullback, gold is still trending higher:
Sentiment took a hit:
GLD put volume spiked:

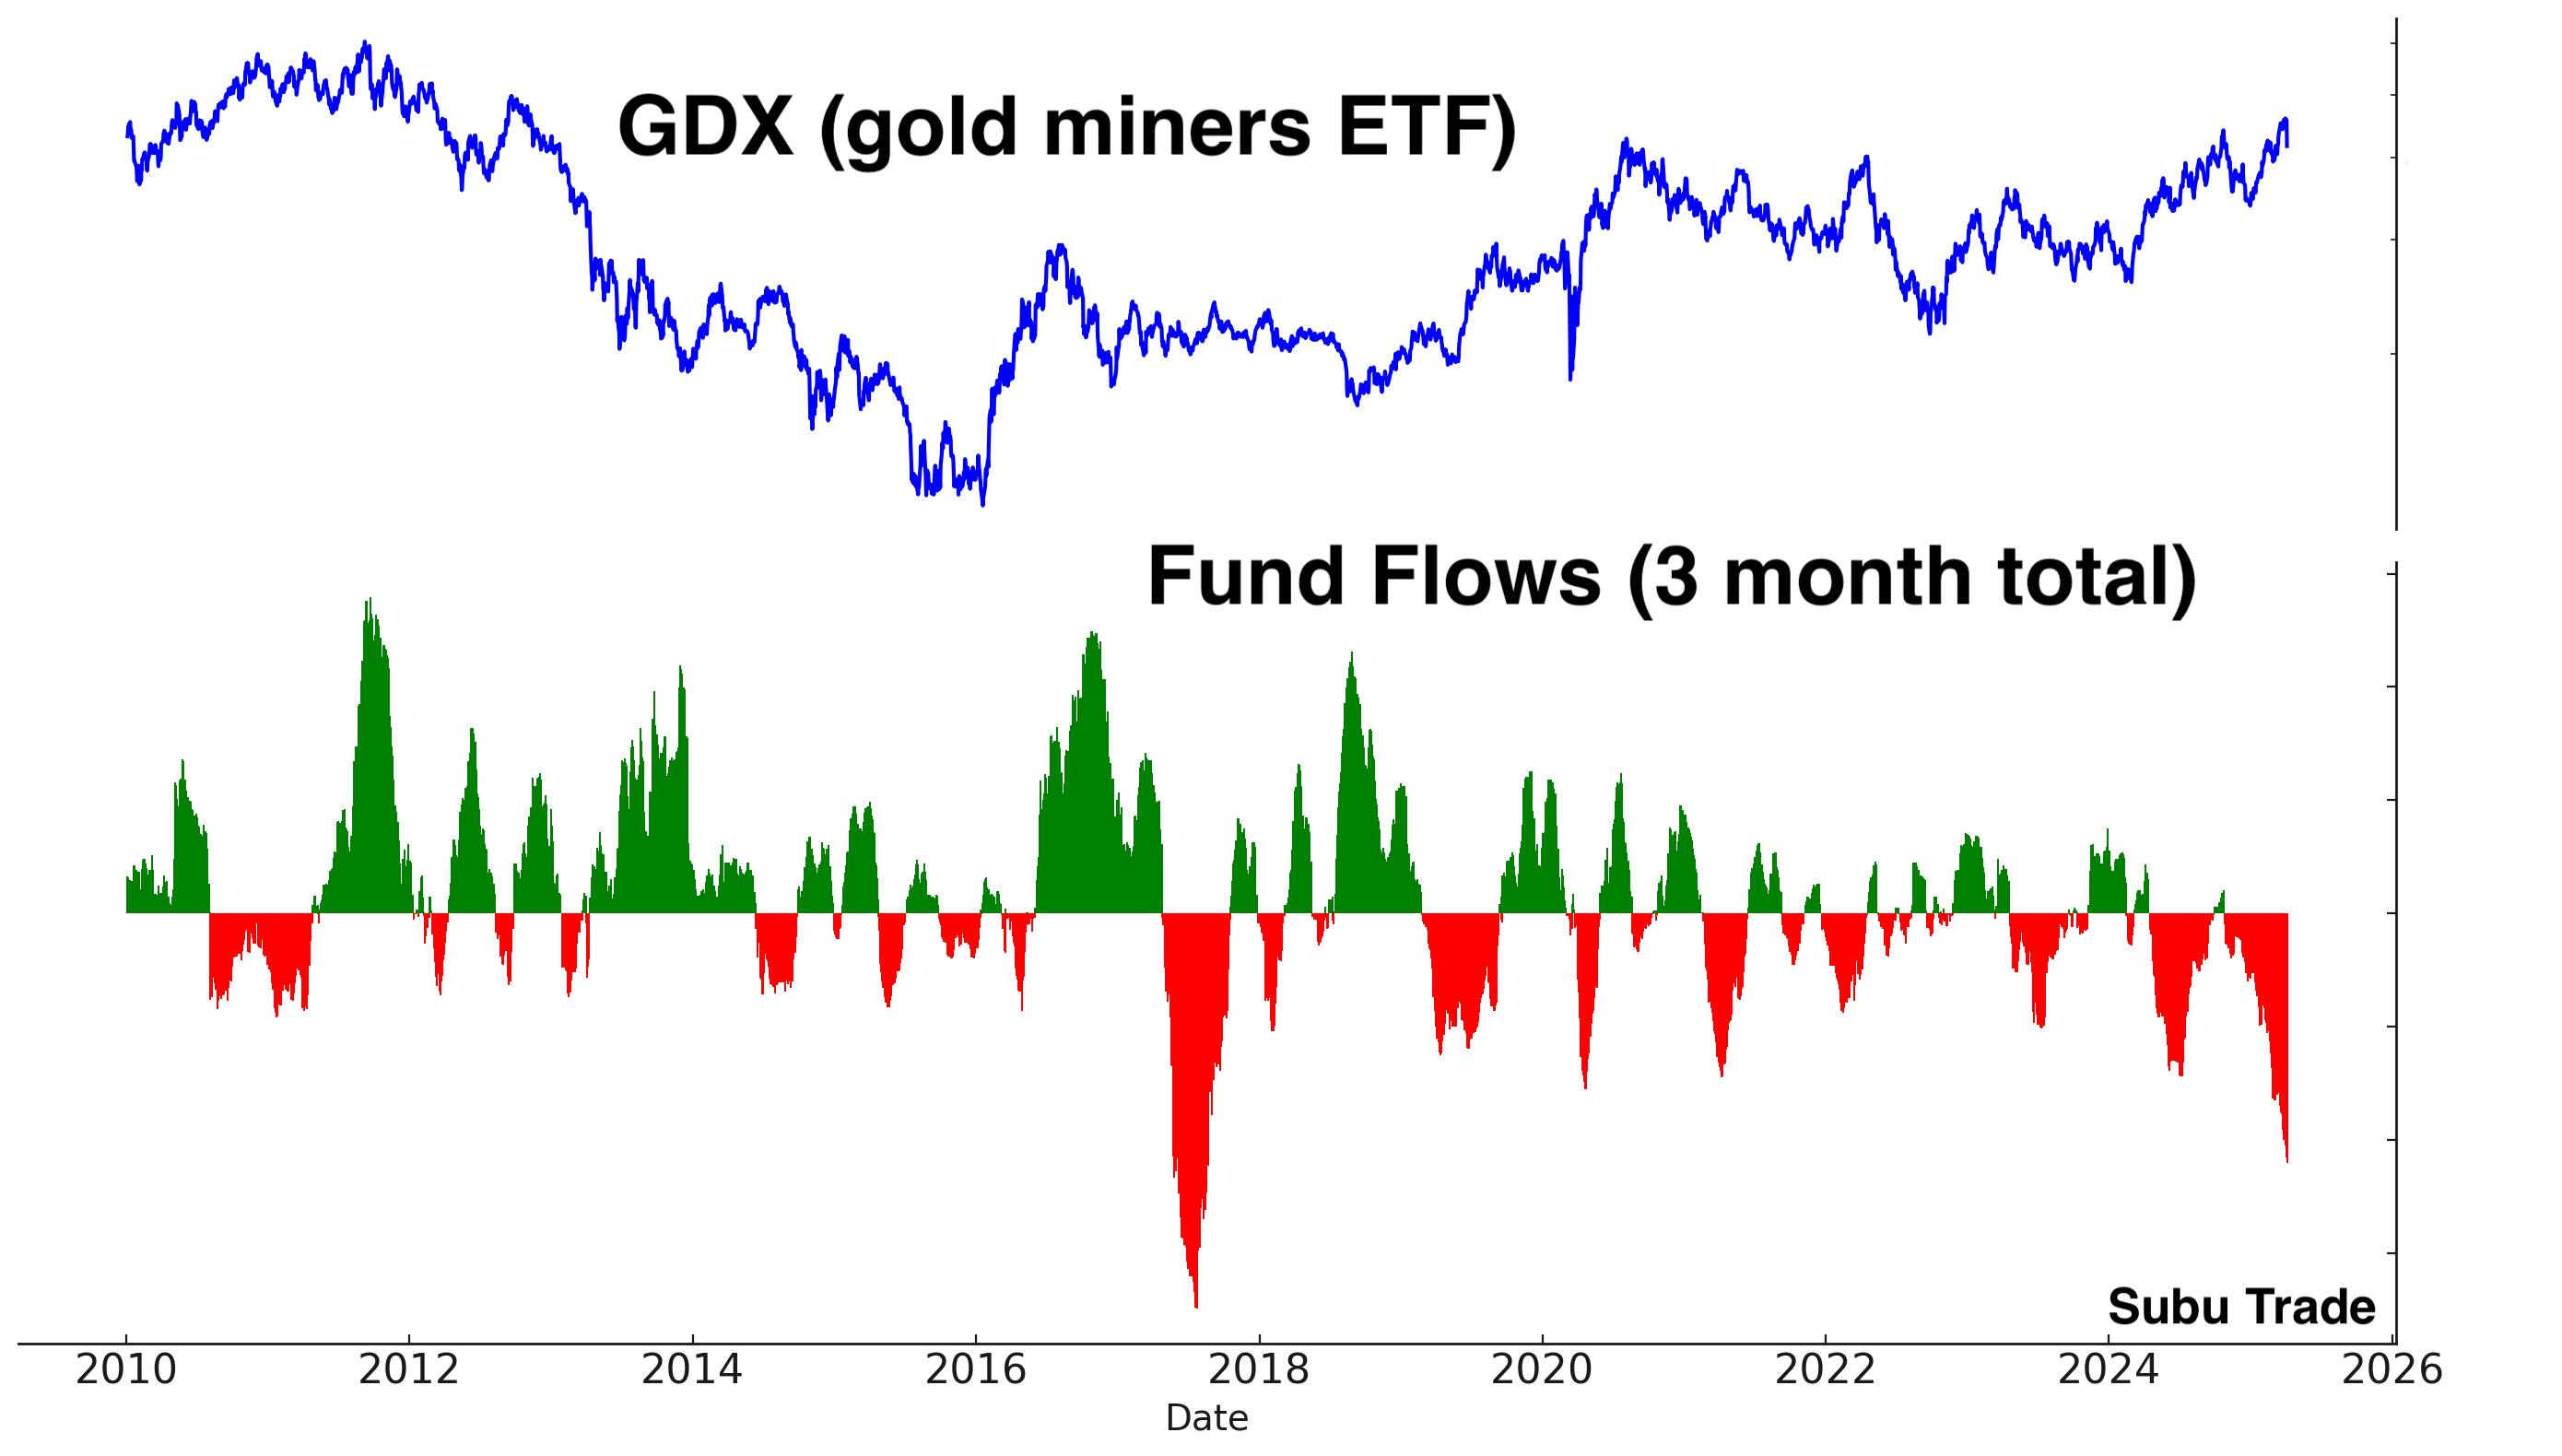
GDX put volume:

It’s interesting to note that GDX saw non-stop outflows during the recent multi-month rally. As I said, Fund Flows should NOT be used as generic contrarian indicators - every ETF has its own unique set of traders.
The bullish narrative/theme for gold remains intact. Global central banks (e.g. China) are buying gold because they fear holding U.S. Treasuries that could be confiscated in a geo-political conflict (e.g. economic/trade wars). As the US. ratchets up trade pressure on allies and foes, expect the demand for gold to increase. Here are the annual purchases of gold by central banks:

Gold and silver (particularly silver) will rebound when stocks rebound.
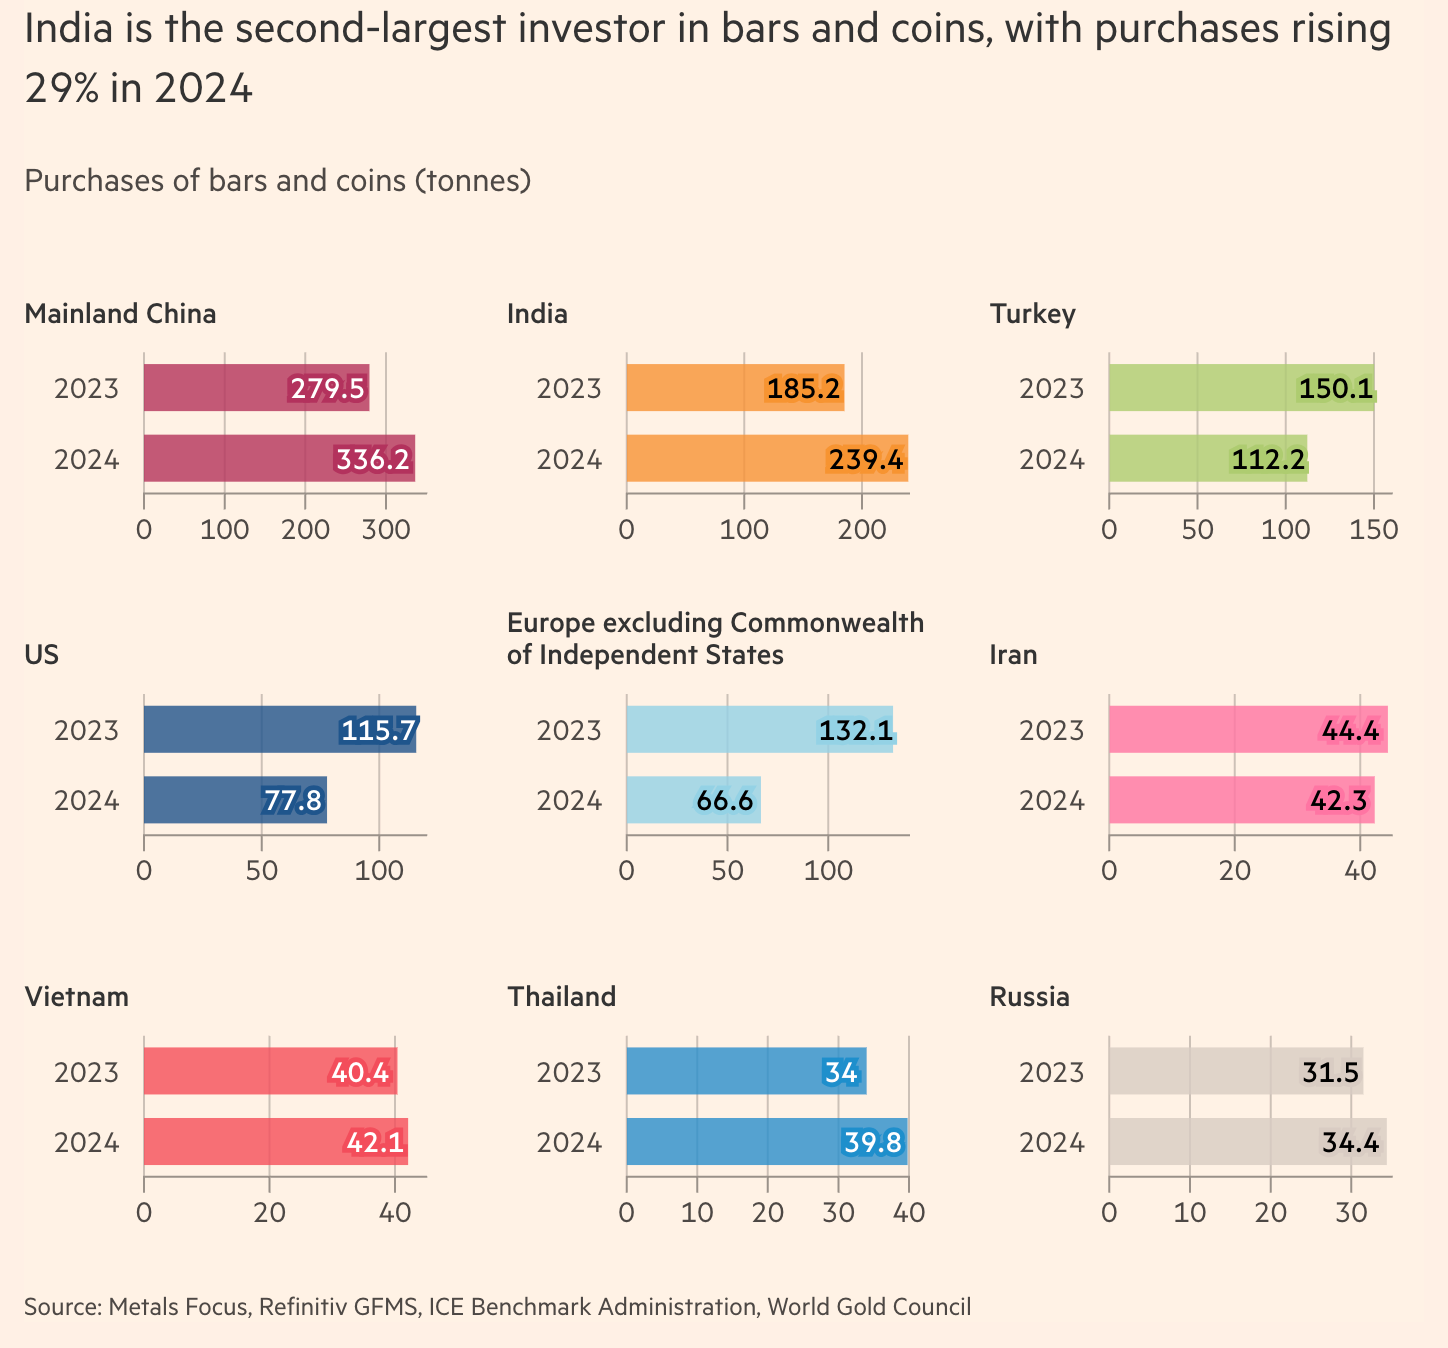
One last thing regarding precious metals: here’s an interest chart from the Financial Times regarding physical demand for gold. Notice the surge in demand from China+India. This article ticked the recent top in gold.
Chinese Equities
I held a small long position in China for several months, anticipating a possible final leg higher in Chinese equities before the rally fizzled out.
That view didn’t play out—Trump’s tariffs hit, Chinese markets sold off sharply, and my trailing stop was triggered. The trade closed with a profit, though some gains were given back.
Chinese equities are no longer trending Up.
Large spike in FXI put volume:

Did I cut my China position near the bottom? Perhaps. Maybe Trump & China will reach some sort of a trade deal, but I do not gamble on the news.
Trailing stops exist for a reason—and they must be respected. Amidst this global trade conflict, China is the most vulnerable. With limited natural resources and an export-driven economy, losing key customers—especially the U.S.—is significantly damaging for the Chinese economy.
India
Trump’s global trade war is bullish for India. While Trump announced 27% tariffs on India, tariffs on India are lower than that on India’s export competitors:
China: minimum 54%
Vietnam: 46%
Bangladesh: 37% (Bangladesh is a major exporter of textiles)
Indonesia: 32%
India was given a lower tariff because of a flaw in Trump’s tariffs. Trump is focused on reducing trade deficits. In his calculation, Trump focused on the U.S.’ relatively small GOODS deficit with India. However, India has a massive SERVICES surplus with the U.S.. Think of all the offshore IT and office workers in India (U.S. companies replacing American workers with office workers in India). There are no tariffs on service exports!

Overall, these global tariffs put India at a massive export advantage relative to its major manufacturing competitors, namely China.
India and the U.S. are expediting a trade deal to reduce these tariffs, which would further cement India’s advantage relative to export competitors such as China.
Trend: Indian equities were trending higher before the tariff announcements hit.
Options traders for the ETF INDA have been betting on a rally, even as Indian stocks fell:

Outflows from Indian ETFs have completely reversed:

Bonds
Bonds rallied this week on safe-haven demand, driven by rising recession fears.
However, two key factors could limit the kind of powerful bond rally seen during the 2008 crisis:
Tariff-driven inflation: The initial impact of tariffs will likely be a temporary rise in inflation and a hit to corporate profits. Companies will absorb some cost increases but gradually pass the rest to consumers—pressuring profit margins first, then pushing prices higher to restore profitability.
Foreign retaliation: Global trade wars could lead to reduced foreign demand for U.S. Treasuries—a bearish headwind for bonds.
This environment complicates the long bonds trade. Bonds typically perform best in deflationary recessions. If trade talks fail, we could be facing stagflation (inflation+recession). In that case, any bond rally would likely be choppy and difficult for trend-followers to navigate.
Trend:
Sentiment:
Putting aside the bigger picture, bonds could temporarily pullback right now if stocks rally:

I have a small long bonds position.
Currencies
The Dollar is trending lower, although it bounced on Friday in a classic safe-haven move (USD rallied during the worst of the 2008 crash along with Treasury bonds):

Sentiment:

I have no currencies position.
My Portfolio & Conclusion
Next week will be pivotal. I’ve held back most of my dry powder and will look to deploy on Monday/Tuesday if the U.S. stock market makes new lows.
Why stay sidelined until now? I take two types of trades:
Trend-following setups tied to a clear macro theme. The 2023–2024 AI-driven rally has run its course, and the S&P 500 lost its Up trend weeks ago.
Mean-reversion trades driven by extreme technical conditions. I reserve full-size positions for the most extreme of setups (huge crashes). Since 2017, markets have shown more extreme one-sided moves—likely fueled by social media amplifying both fear and greed. That’s why it’s critical not to go all-in at the first sign of oversold conditions. Patience remains key.
My portfolio right now:
Mean-Reversion Position (Non-Core) – Long Oversold Tech Stocks:
Currently 10% of my portfolio, willing to go up to 25% if stocks fall more. Targeting at least a mean-reversion bounce. No increase in position size so far, will increase if stocks plunge on Monday/Tuesday (a final flush).Core Position – Long Gold and Silver: long with trailing stops. Watching carefully.
Mean-Reversion Position (Non-Core) - Long Indian Equities: Big beneficiary of Trump’s tariffs.
Mean-Reversion Position (Non-Core) – Long U.S. Treasury Bonds: Small position size.
If you have any questions, feel free to email me at contact@subutrade.com
This content is for informational purposes only and is not financial or investment advice. I am not a licensed financial advisor. Trading involves risk, and past performance does not guarantee future results. You are responsible for your own financial decisions, and I am not liable for any losses.
Just found your work and can say that I love the way you present the data. Awesome stuff!
brilliant stuff, i really hope this stays free but either way keep up the good work