
Markets Report: can breadth thrusts push stocks higher?
Stocks continue to work through the bottoming process

U.S. stocks pushed higher this week, with several bullish breadth signals being triggered. Meanwhile, gold retreated as safe-haven demand diminished following the stock market's rebound.
My Portfolio:
*Click here if you don’t understand how I trade
Mean-Reversion Position – Long Oversold Tech Stocks: Currently my largest position. Targeting a mean-reversion rally.
*A rally in stocks could also push Bitcoin higher.
No position in gold & silver
NEW Mean-Reversion Position (Non-Core): long energy stocks
Mean-Reversion Position (Non-Core) - Long Indian Equities: Big beneficiary of U.S.-China trade war.
Mean-Reversion Position (Non-Core) – Long U.S. Treasury Bonds: Small position size, irrelevant for my P&L.
U.S. Equities
The U.S. stock market continues to work through its bottoming process, with higher Highs and higher Lows being formed — a constructive sign. Stocks are mean-reverting to the upside, though some short-term volatility is possible.
Breadth Thrusts
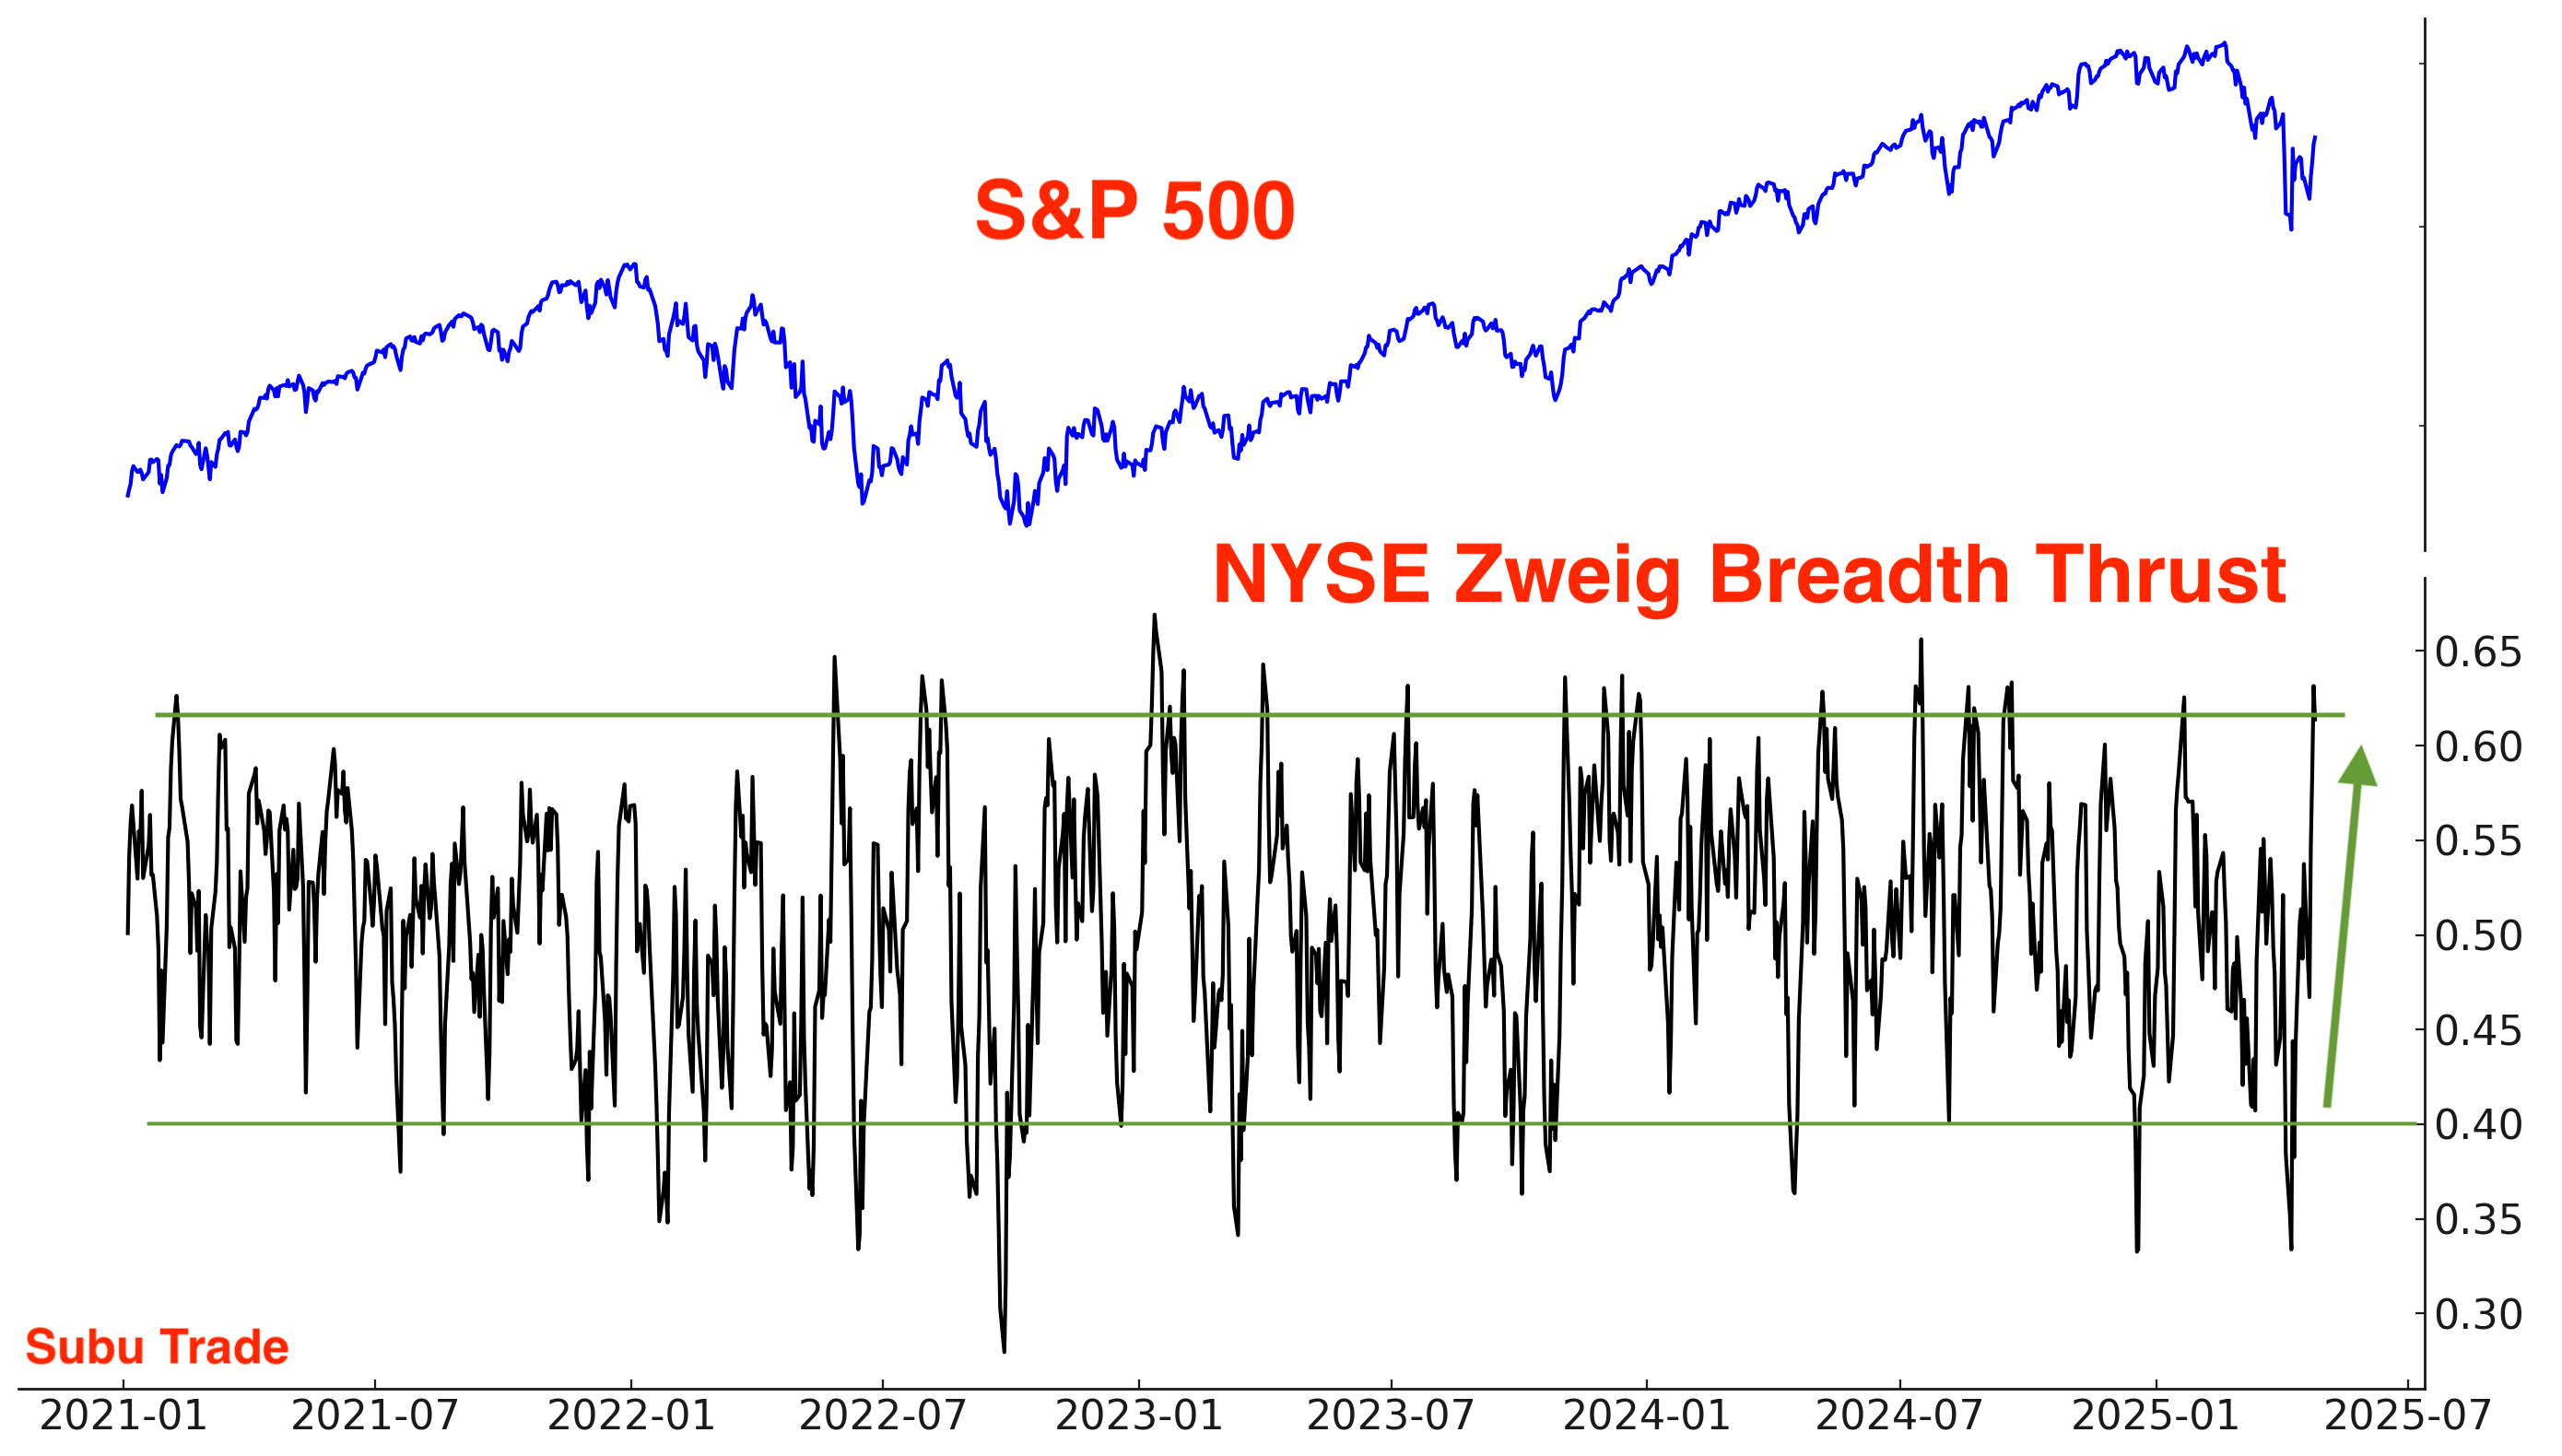
A Zweig Breadth Thrust was triggered on Thursday, suggesting a potential bullish shift in the market. This indicator measures NYSE advancing issues as a % of advancing+declining issues, smoothed by a 10-day exponential moving average. A Thrust is triggered when the indicator surges from below 40% to above 61.5% within 10 trading sessions — a rare event that often marks the start of strong rallies.

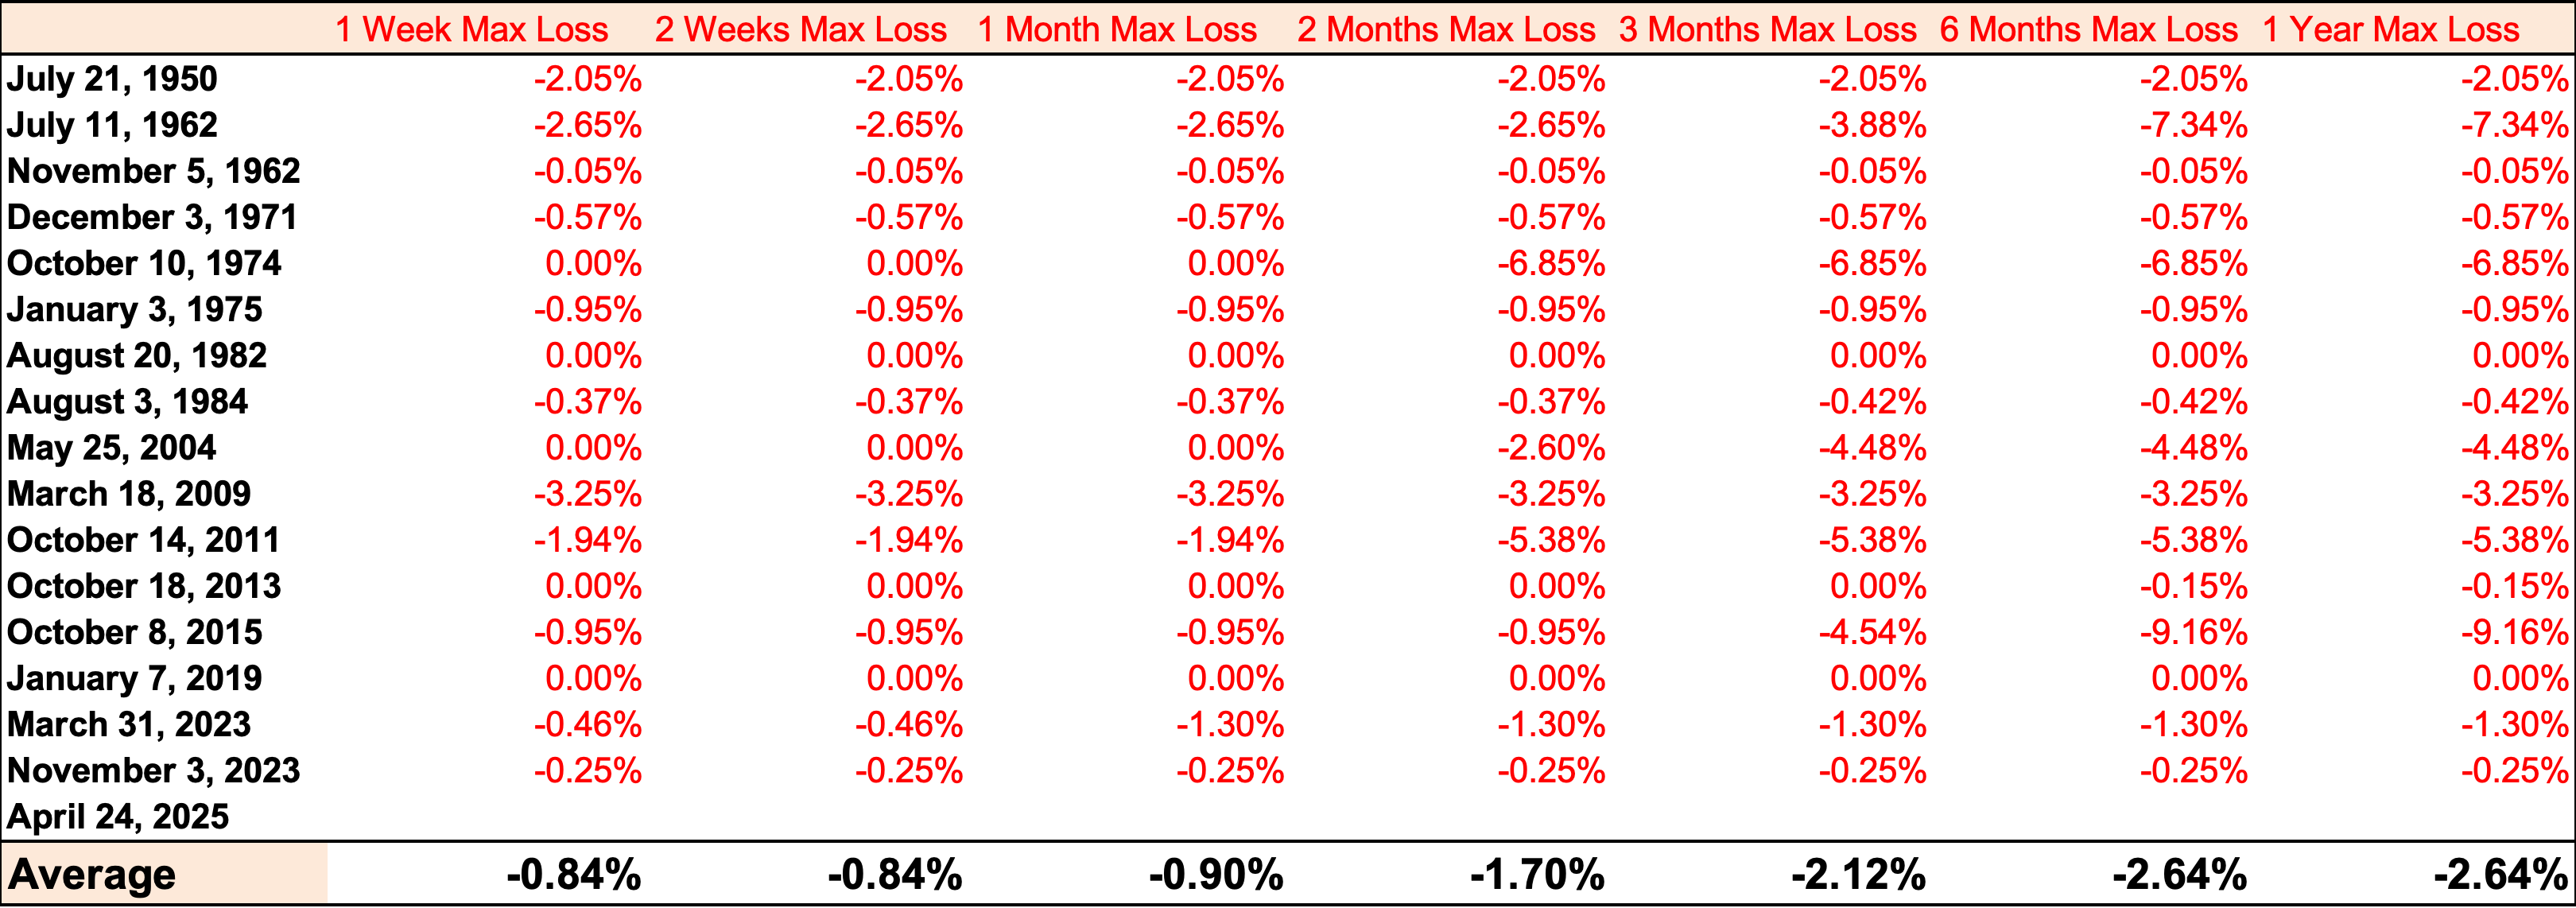
Here are the maximum drawdowns following past Zweig Breadth Thrusts:
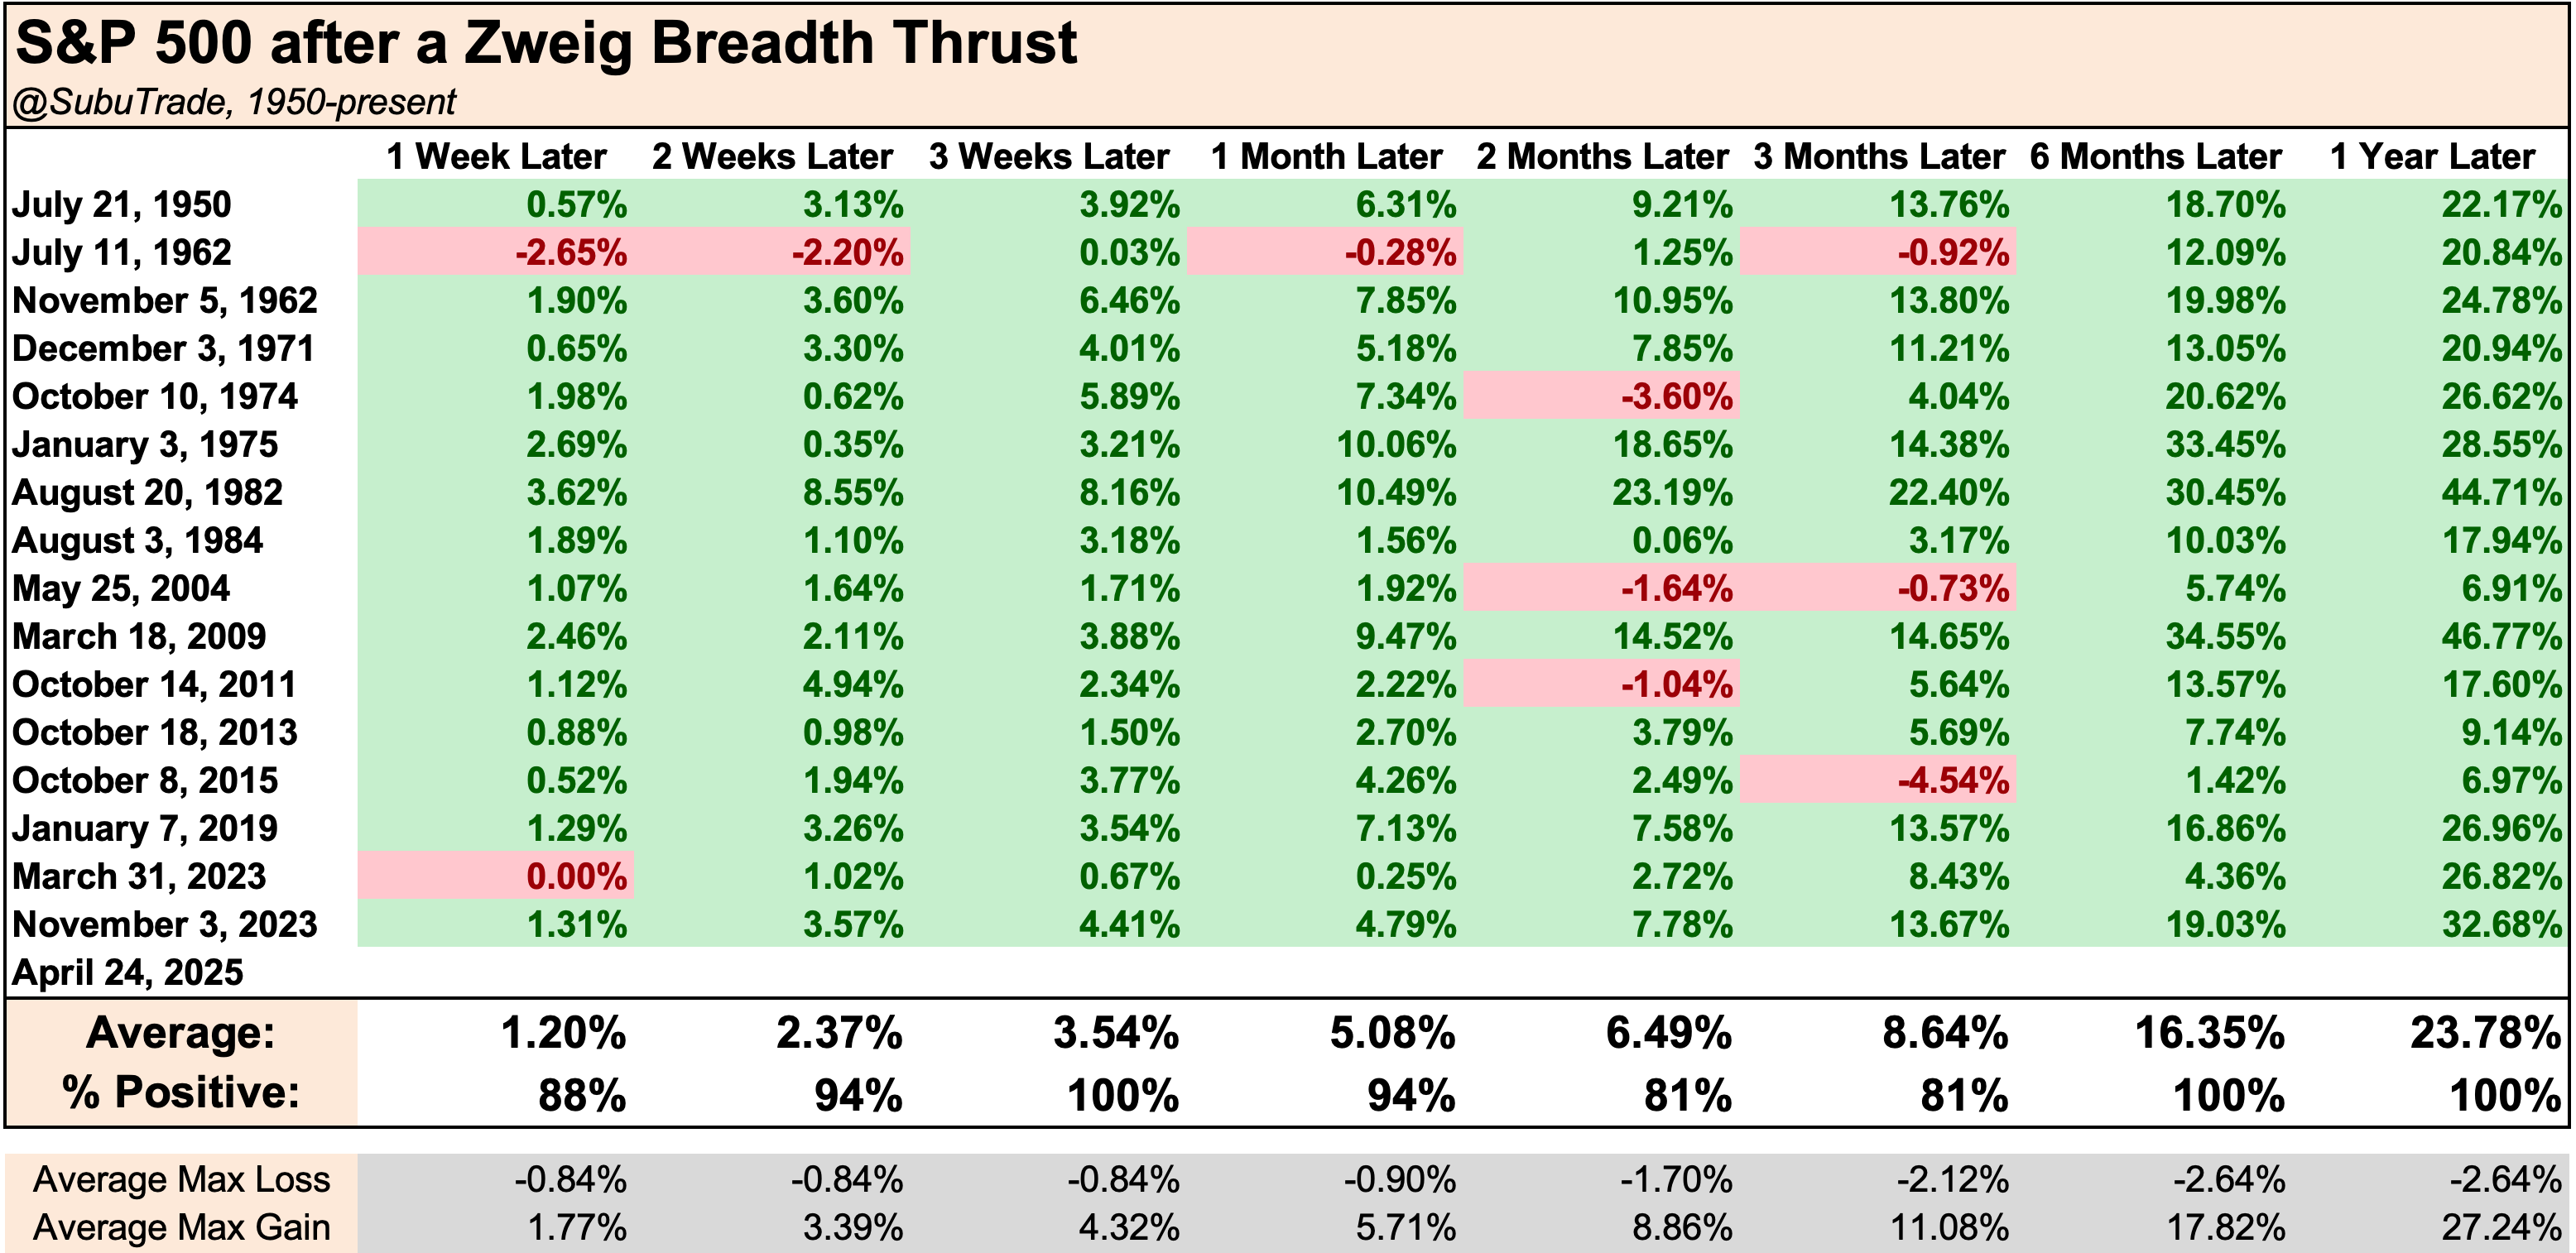
Still, it’s important to be reasonable. A Zweig Breadth Thrust is a bullish sign, but today’s market conditions are very different from some major bear market bottoms (e.g. 2009). Valuations are much richer now, which could cap the market’s upside potential. While this thrust improves the bullish outlook, I do not expect stocks to skyrocket higher like they did in 2009.
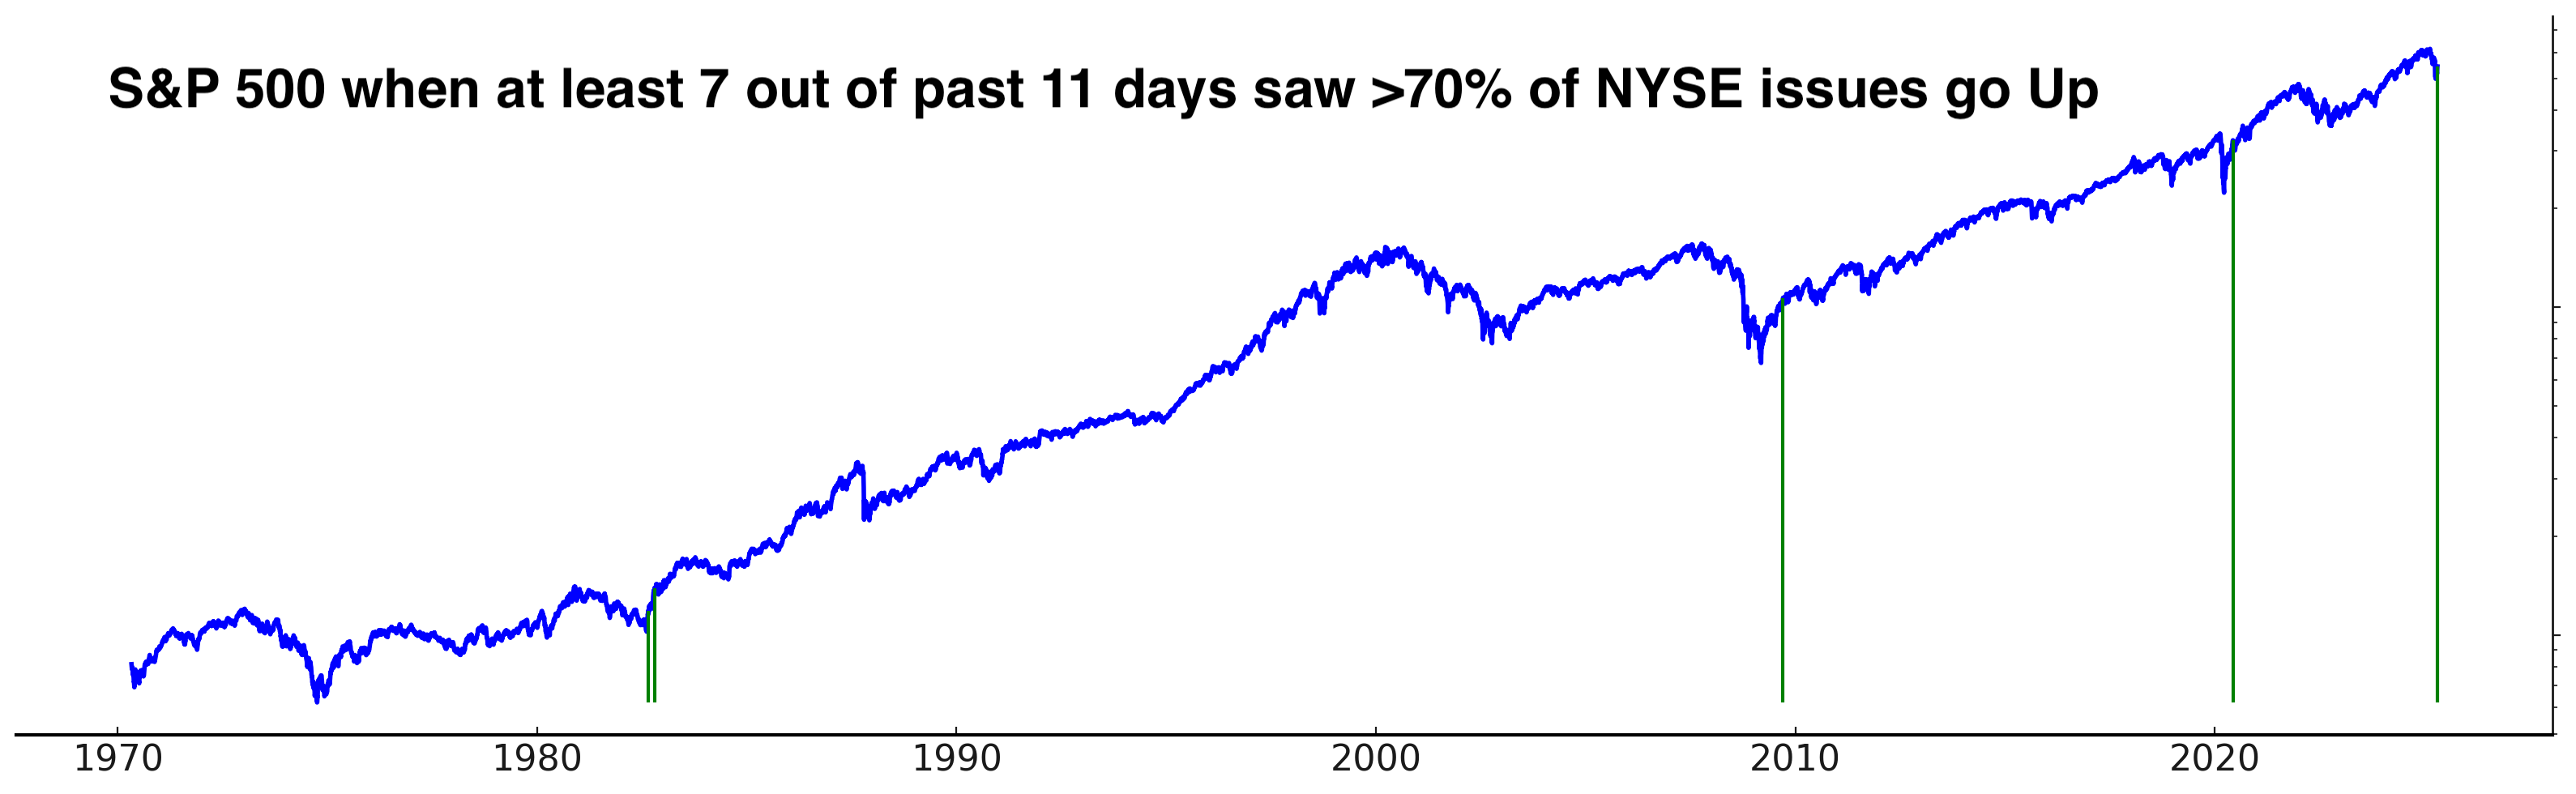
We can look at breadth from another angle. The past 11 trading sessions saw 7 days in which more than 70% of NYSE issues advanced. Again, this was a bullish sign (historically):

Perhaps we could see a quick and small pullback right here. The NASDAQ Composite went up more than 1% for 4 days in a row.

34% of S&P 500 stocks are above their 200 and 50 day moving averages. This is to be expected, considering that the S&P 500 itself is still below its 200 and 50 day moving averages:
Options
The past month has seen a ramp higher in the total Put/Call ratio (across all options exchanges):
The $ value of S&P 500 call-put volume crashed along with stocks. And now that stocks are pushing higher, this figure is reversing from historic levels as well:

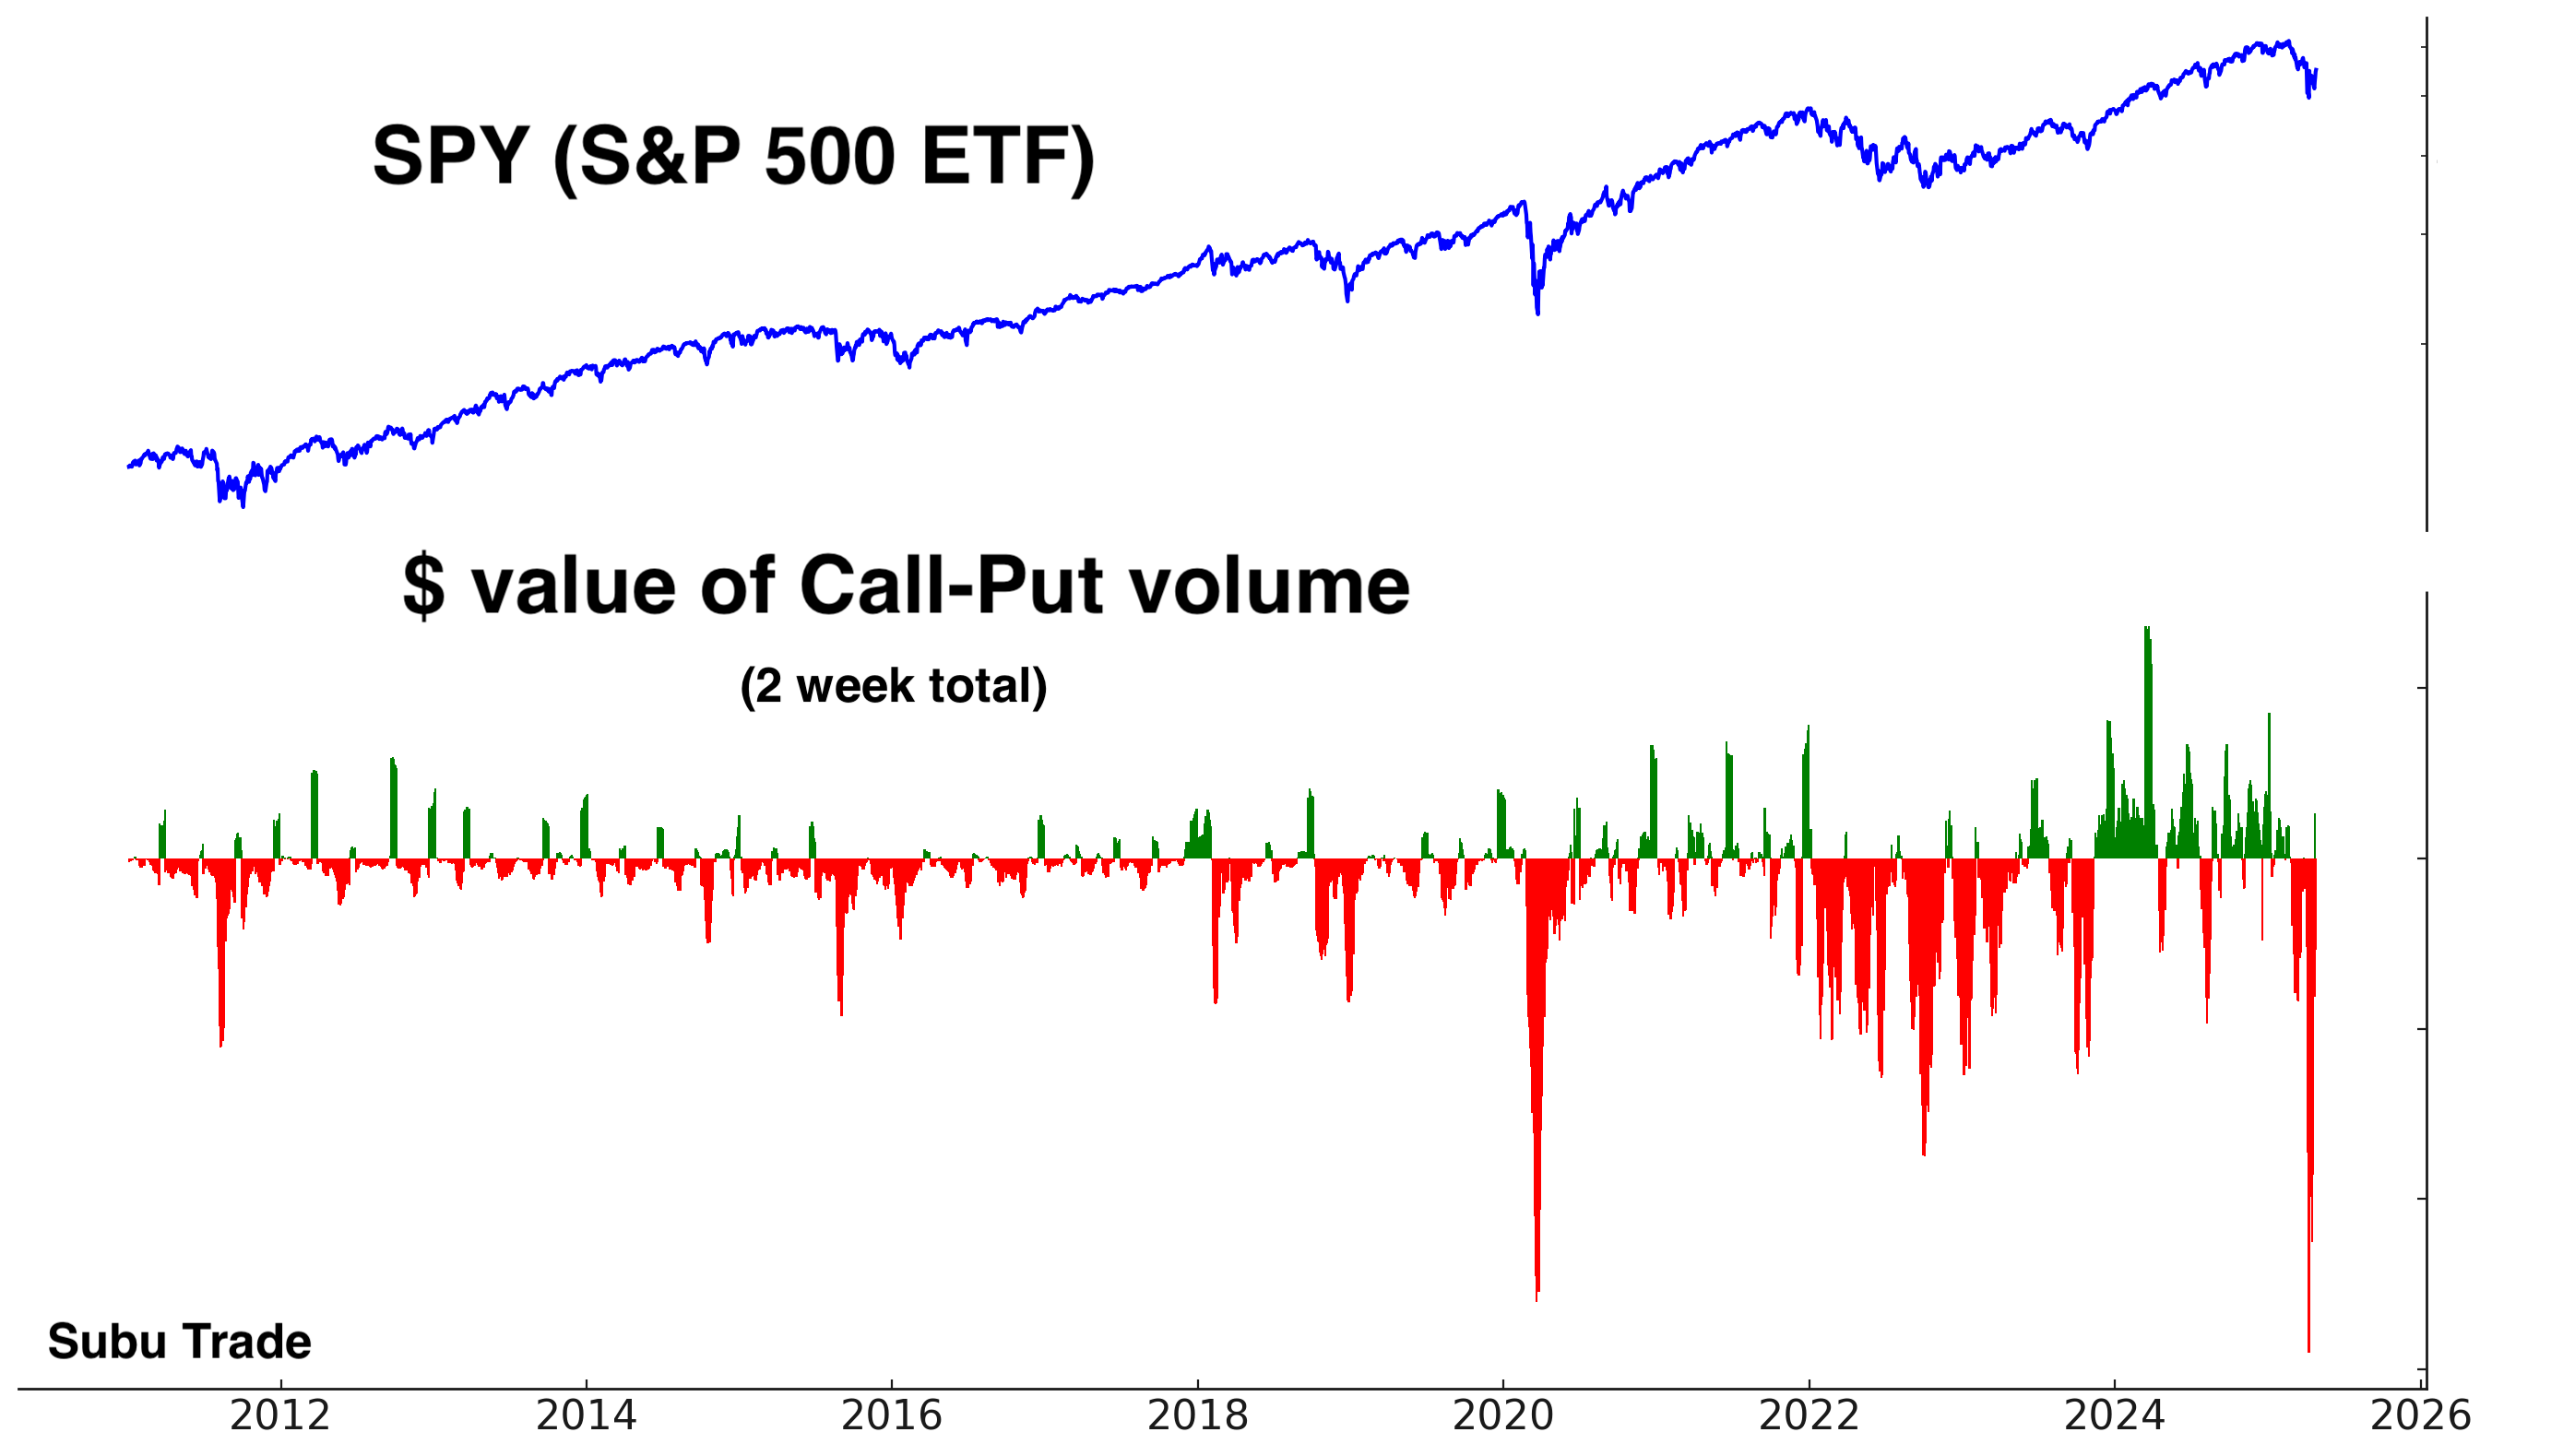
The $ value of SPY call-put volume is also reversing Up from historic levels:
HYG call-put volume has also reversed:
Sentiment
Investors Intelligence Bulls fell to 23.5%, just before stocks reversed higher this week. This was the lowest Bulls reading of this cycle:

AAII Bears is at 55.6%:
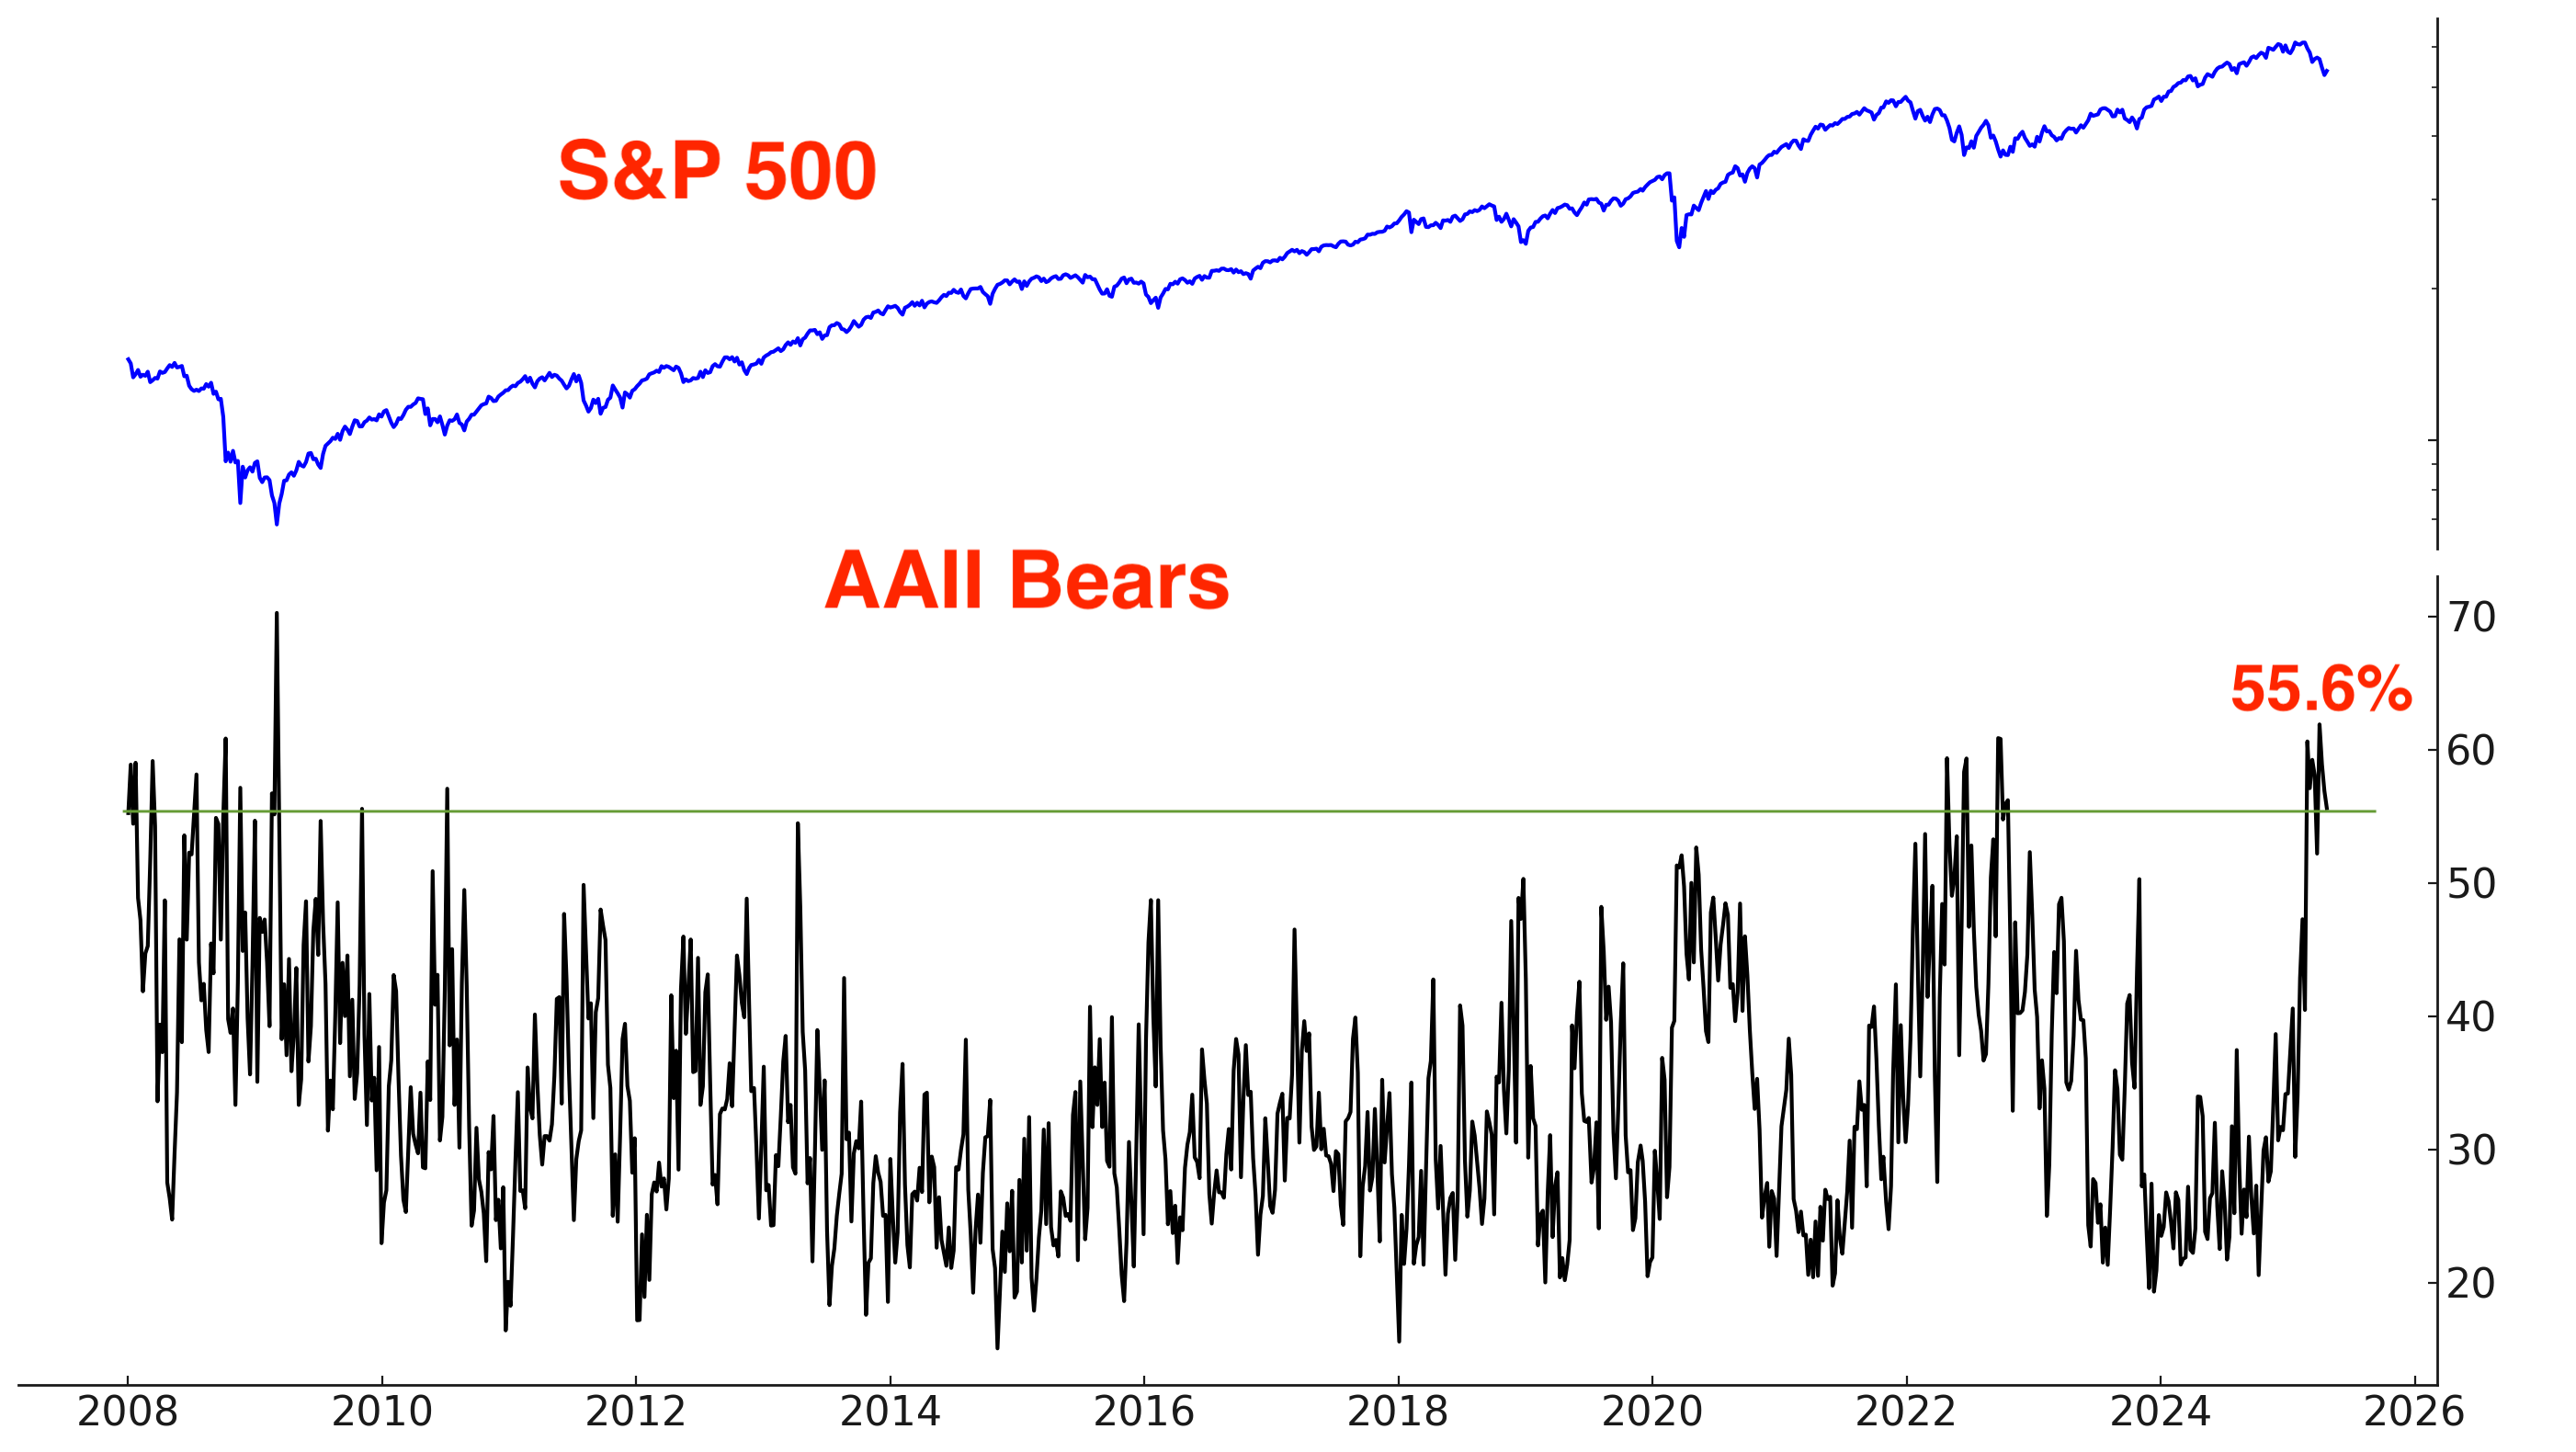
This is the 9th consecutive week with more than 50% Bears. A new record:

NAAIM Exposure Index went up a little:
Other sentiment
The S&P 500’s Daily Sentiment Index has reversed upwards:
After a huge spike, the VIX Daily Sentiment Index is coming down:


VIX’s term structure is no longer in backwardation.

Historically, this could lead to a short term pullback for stocks+a small jump in VIX, but after that it was a bullish sign:

We continue to see outflows from long VIX ETFs as volatility traders take profits:

Economic Policy Uncertainty
Economic Policy Uncertainty is slowly coming down, with the Trump administration toning down some tariff rhetoric:
Corporate Insiders
There has been no major spike in the Corporate Insider Buy/Sell ratio over the past 2 months:
Trend
The trend is your friend, until it ends. The U.S. stock market is still trending down, but this could change next week if stocks push higher:
Why does this matter? Because at least from a trend following perspective, it’s better to buy when the market is trending Up (e.g. above its 200-DMA) than when the market is trending Down (e.g. below its 200-DMA). This doesn’t mean that the market can’t rally from below it’s 200-DMA. It simply means that risk and volatility are higher down here.

Overall, stocks remain in the midst of a volatile bottoming process, with higher Highs and higher Lows now being formed. This week's price action was largely in line with expectations, with the emergence of several bullish breadth signals as an encouraging development.
Gold, silver, energy
Over the past 2 weeks I wrote:
With gold surging to new all-time highs this week, risk/reward DOES NOT favor gold bulls right now.
Gold briefly touched $3,500 this week before being rejected, and now appears to be entering either a corrective phase or a period of sideways consolidation. In either case, it could take several weeks or months to work off the recent excess, while better trading opportunities emerge elsewhere. That said, I remain confident in the longer-term macro thesis for gold:
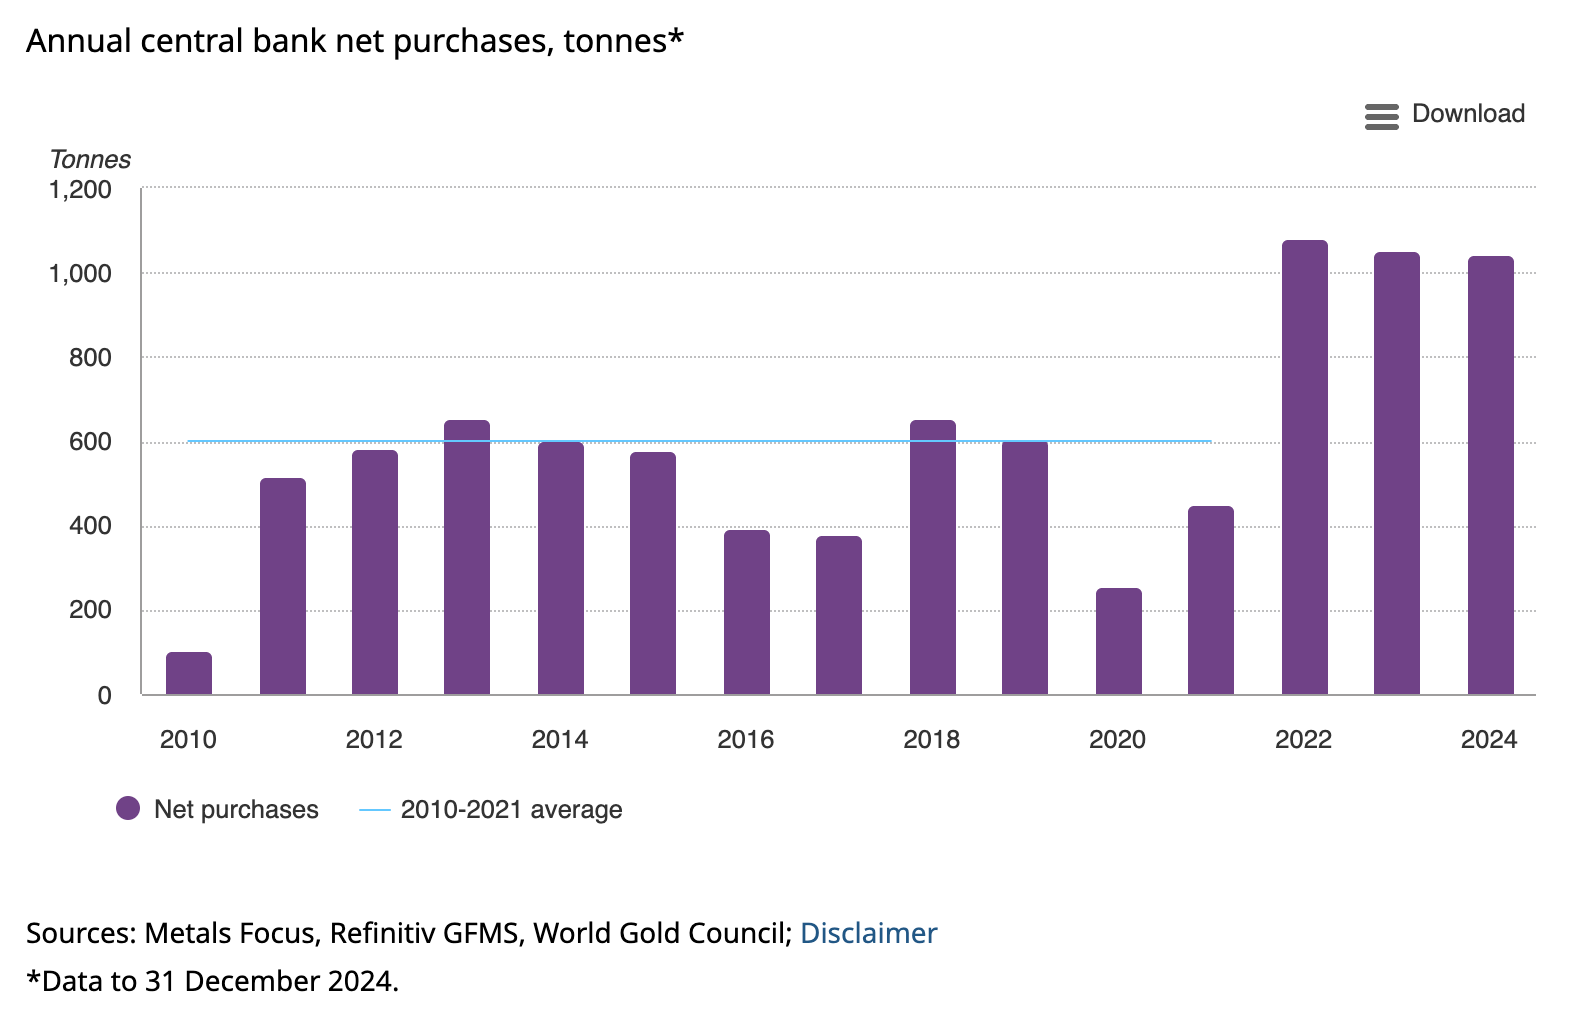
Global central banks (e.g. China) are buying gold because they fear holding U.S. Treasuries that could be confiscated in a geo-political conflict (e.g. economic/trade wars). As the U.S. ratchets up trade pressure on allies and foes, expect the demand for gold to increase. Here are the annual purchases of gold by central banks:
Trend
Gold continues to trend higher, but Risk/Reward does NOT favor bulls right now:
Options
A massive spike in the $ value of GLD call-put volume:

A consistently reliable indicator for gold and silver is their distance from their respective 200-day moving averages. Similar to indicators like RSI, this indicator tends to be mean-reverting. Gold recently spiked more than +25% above its 200 day moving average:


The GDX Options Flow Index spiked and is now coming down:

Sentiment
Gold sentiment remains elevated:
Fund Flow
Inflows into GLD are starting to come down:

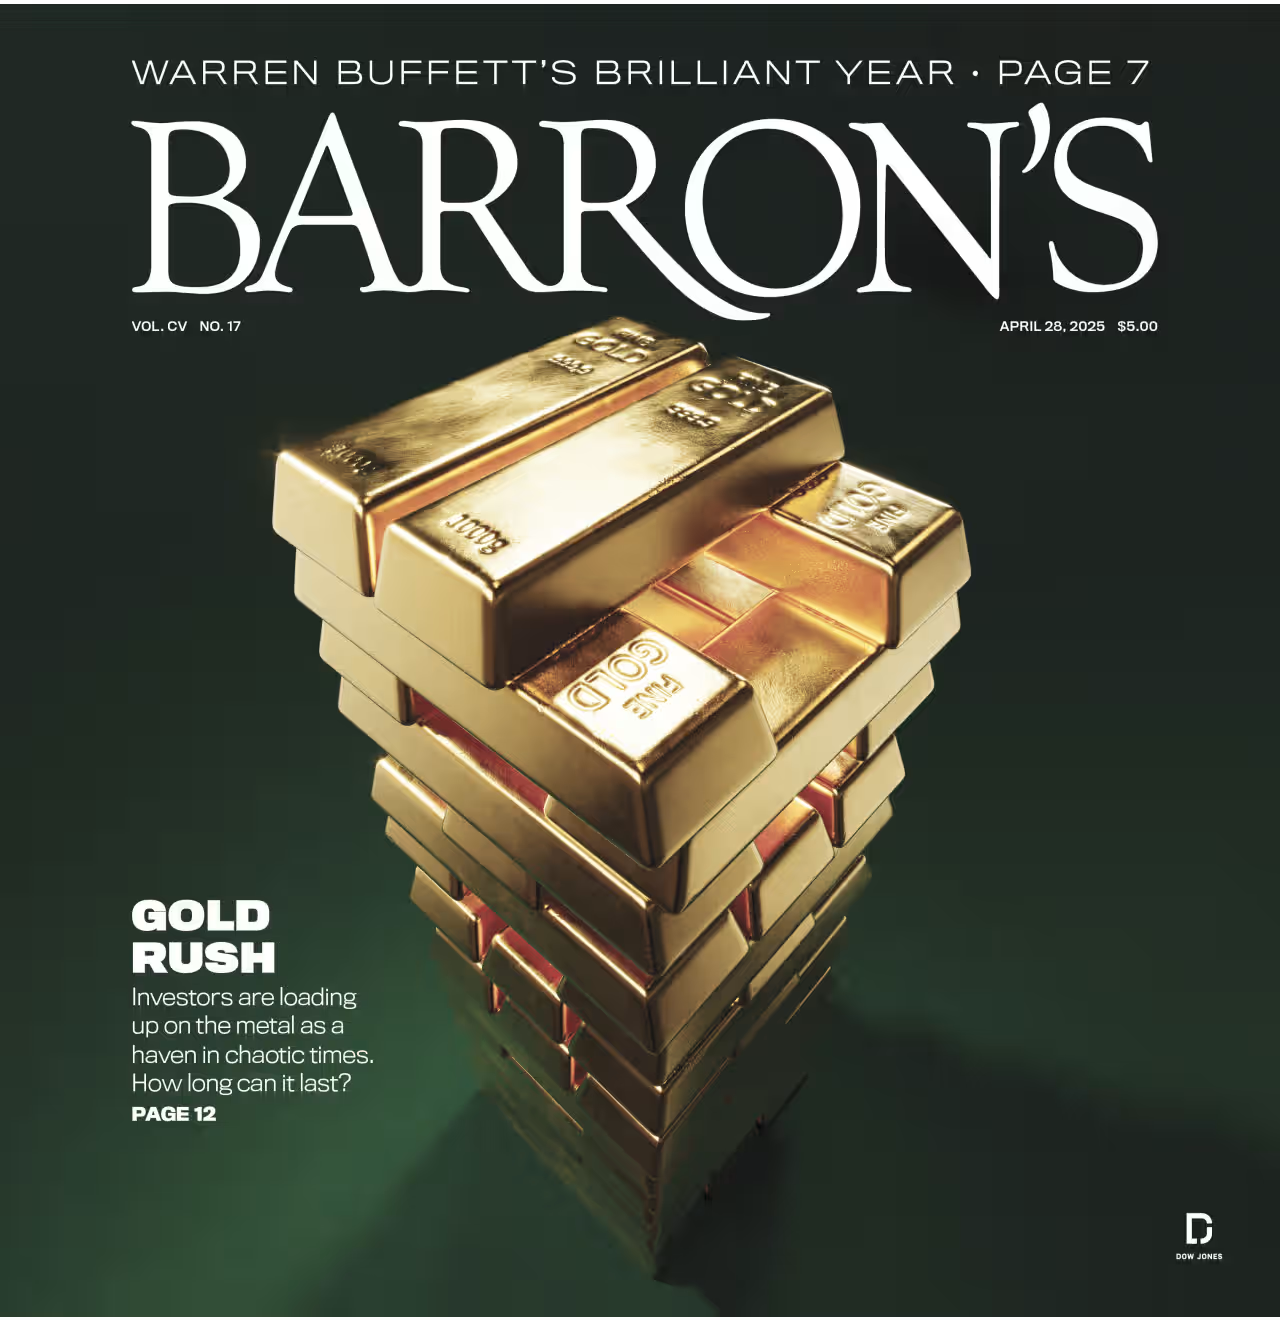
Barron’s cover:
Central banks buying gold:
There are better trading opportunities elsewhere in the short term.
Energy
Energy prices and energy stocks declined when Trump's tariffs ignited global recession fears. As the U.S. pursues new trade agreements, easing recession concerns could set the stage for a rebound in energy.
The past few weeks saw non-stop selling in XLE (energy sector ETF):

According to the Commitments of Traders Report, Dealers are long and Asset Managers are short the energy sector:

This is my new Long position (non-core, small position size).
Silver
Silver could rally along with industrial metals such as copper. But silver is hard to trade here because it’s caught between 2 conflicting forces:
Gold pulling back could be a drag on silver.
On the other hand, easing recession fears could boost industrial metals like copper and silver. Silver has greater industrial exposure than gold.
Silver is not easy to trade here. There are easier opportunities elsewhere.
India & China
I’m bullish on India, and I believe this is the Indian Century. While much of the world is focused on the U.S.-China economic rivalry, few people recognize that India stands to be one of the biggest beneficiaries.
Trump’s tariffs may bring back some high-end manufacturing to the U.S., but they won’t revive labor-intensive manufacturing. Labor in many developing countries costs a fraction of U.S. wages—often just 10%. Labor-intensive manufacturing for textiles, electronics etc. will likely move from China to India.
India’s cultural dynamics make the Momentum factor especially powerful. Once a bullish narrative or theme gains traction in India, it can spread rapidly, sometimes driving explosive moves in individual stocks. For example, Dixon Technologies has surged since COVID as smartphone and electronics manufacturing increasingly shifts from China to India.
One way of measuring this momentum is by looking at what’s called “Up Up”, i.e. buy today if the market went up yesterday. Indian stocks have a strong tendency to go Up today if they went Up yesterday.
*This doesn’t take into account transaction costs, slippage, taxes etc.
*The following chart uses a log scale on the y axis

Trend
Indian stocks are starting to push upwards. They’re now making higher Highs:
Breadth
Here are the % of Nifty 50 stocks above their 200 and 50 day moving averages:

Fund Flows
Outflows from Indian ETFs have stabilized:

I am long Indian equities.
Elsewhere in Asia, Chinese equities may bounce along with global equities. I am not long term bullish on China as I think China will be the biggest loser from the U.S.-China economic war.
China Trend
Mostly trending sideways:
China Fund Flows
Outflows from Chinese ETFs are starting to stabilize:

Bonds
Themes/narrative
The bond market is being pulled by conflicting forces, making a sustained trend unlikely. The most probable outcome is continued choppy price action within a broad range.
On one hand, inflationary fears from tariffs + foreigners selling U.S. bonds could be bearish for bonds.
On the other hand, a potential economic slowdown could ultimately be bullish for bonds.
Outside of short-term traders seeking a mean-reversion bounce, I believe the bond market is best avoided for now. There are more favorable trading opportunities elsewhere.
Trend
No real trend; bonds are swinging sideways within a wide range:
Sentiment
Sentiment remains in neutral territory:
I hold a small long position in bonds, but the position size is small and has little impact on my overall portfolio performance.
Currencies
The Dollar is trying to stabilize, and could bounce along with U.S. equities and bonds.
Trend
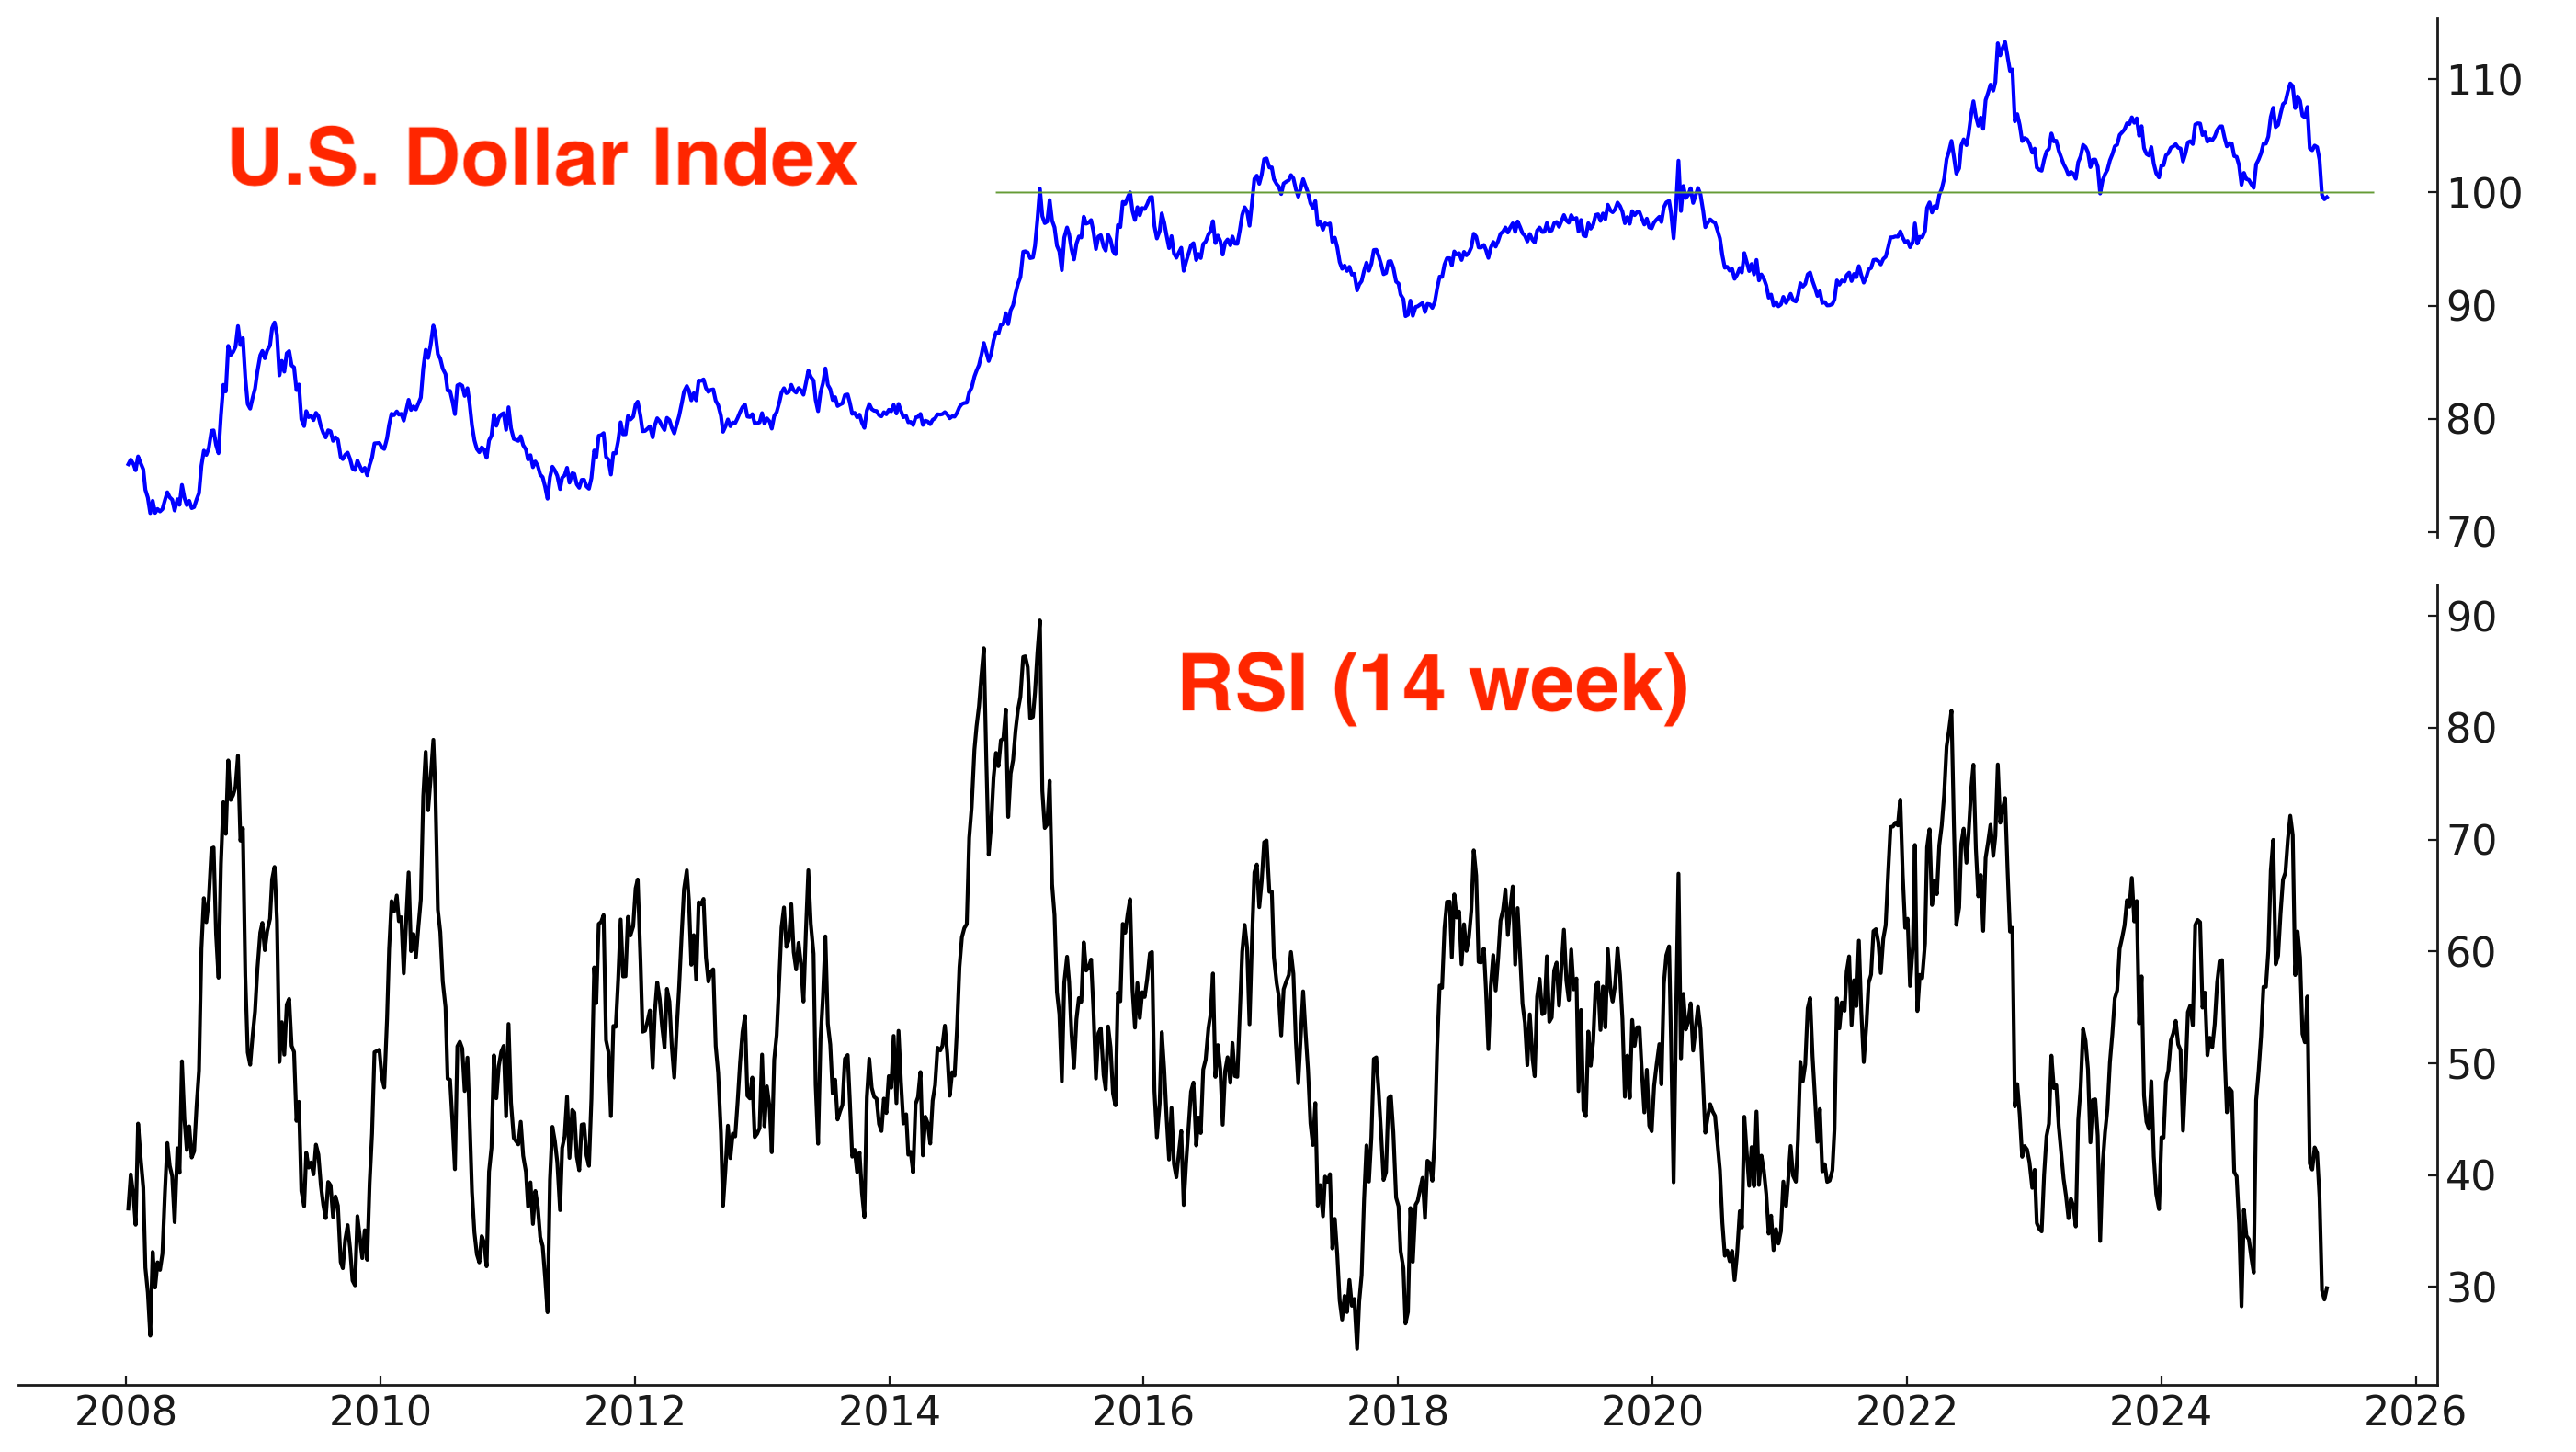
The Dollar remains in a Down trend:

Sentiment
Sentiment is still mostly neutral:

I do not have a currencies position.
Bitcoin
Bitcoin is a high-beta, risk-on asset that generally rises when stocks rally and struggles when stocks fall. While its directional correlation with stocks is clear, its price action is unique—less wave-like, more staircase: sharp moves followed by prolonged consolidation.
Bitcoin has performed relatively well while stocks crashed. Usually a stock market crash of this magnitude would see Bitcoin collapse, which hasn’t happened so far. I have no position in crypto, but a stock market rally will probably coincide with a Bitcoin rally.
My Portfolio
*Click here if you don’t understand how I trade
Mean-Reversion Position – Long Oversold Tech Stocks: Currently my largest position. Targeting a mean-reversion rally.
*A rally in stocks could also push Bitcoin higher.
No position in gold & silver
NEW Mean-Reversion Position (Non-Core): long energy stocks
Mean-Reversion Position (Non-Core) - Long Indian Equities: Big beneficiary of U.S.-China trade war.
Mean-Reversion Position (Non-Core) – Long U.S. Treasury Bonds: Small position size, irrelevant for my P&L.
This content is for informational purposes only and is not financial or investment advice. I am not a licensed financial advisor. Trading involves risk, and past performance does not guarantee future results. You are responsible for your own financial decisions, and I am not liable for any losses.
Great write up. Thank you! I’ve been bullish gold since 2018. I believe gold has made a multi month top, maybe akin to the aug 20 top or the Ukraine war top in 22. I’m in the same quandary about silver.
Outstanding report, as usual. Seeing the how small the max drawdowns were after the prior ZBTs is the most telling. "Every time is different" until it isn't. We'll see!