
Markets Report: has the rally run out of steam?
The easy part is over. Now comes the hard part. What's next?

Over the past few weeks I highlighted the case for a mean-reversion rally—and that’s what we got. The S&P 500 is stalling around a key resistance zone: the 61.8% Fibonacci retracement level and the 200-day moving average.
The rally’s easy part is over. Now comes the hard part. Risk/Reward favors neither bulls nor bears at this point.
My Portfolio:
*Click here to understand how I trade
Mean-Reversion Position – Long Oversold Tech Stocks: Currently my largest position. Sold 1/4 of my position the prior week, kept the remaining 3/4 position. Mean-reversion rally already occurred, now comes the hard part.
*A rally in stocks could also push Bitcoin higher.
No position in Gold. Gold could correct/consolidate for weeks/months to work off the recent excess.
Mean-Reversion Position (Non-Core): long energy stocks. Small position size, will increase position size if energy stocks fall.
Mean-Reversion Position (Non-Core) - Long Indian Equities: Big beneficiary of U.S.-China trade war. Small position size. Temporarily hurt by India-Pakistan conflict.
Mean-Reversion Position (Non-Core) – Long U.S. Treasury Bonds: Small position size.
U.S. Stocks
I expect stocks to trade in a wide and volatile range throughout 2025: not a runaway bull like 2023–2024, nor a bear market like 2022, and certainly nothing resembling 2008. A marginal new all-time high for the S&P 500 remains possible if Trump strikes trade deals, but here’s the key question.
Let’s assume that Trump eventually strikes trade deals with the U.S.’ major trading partners. That merely brings us back to where we were at the start of this year before tariff conflicts began. U.S. stocks lack a strong bullish theme/narrative that can propel stocks to massive new highs like in 2023-2024 (AI + rate cut themes). “Trade deals” merely undo some of the damage that Trump has already caused.
Overall, I believe we’re stuck in a wide and choppy range.
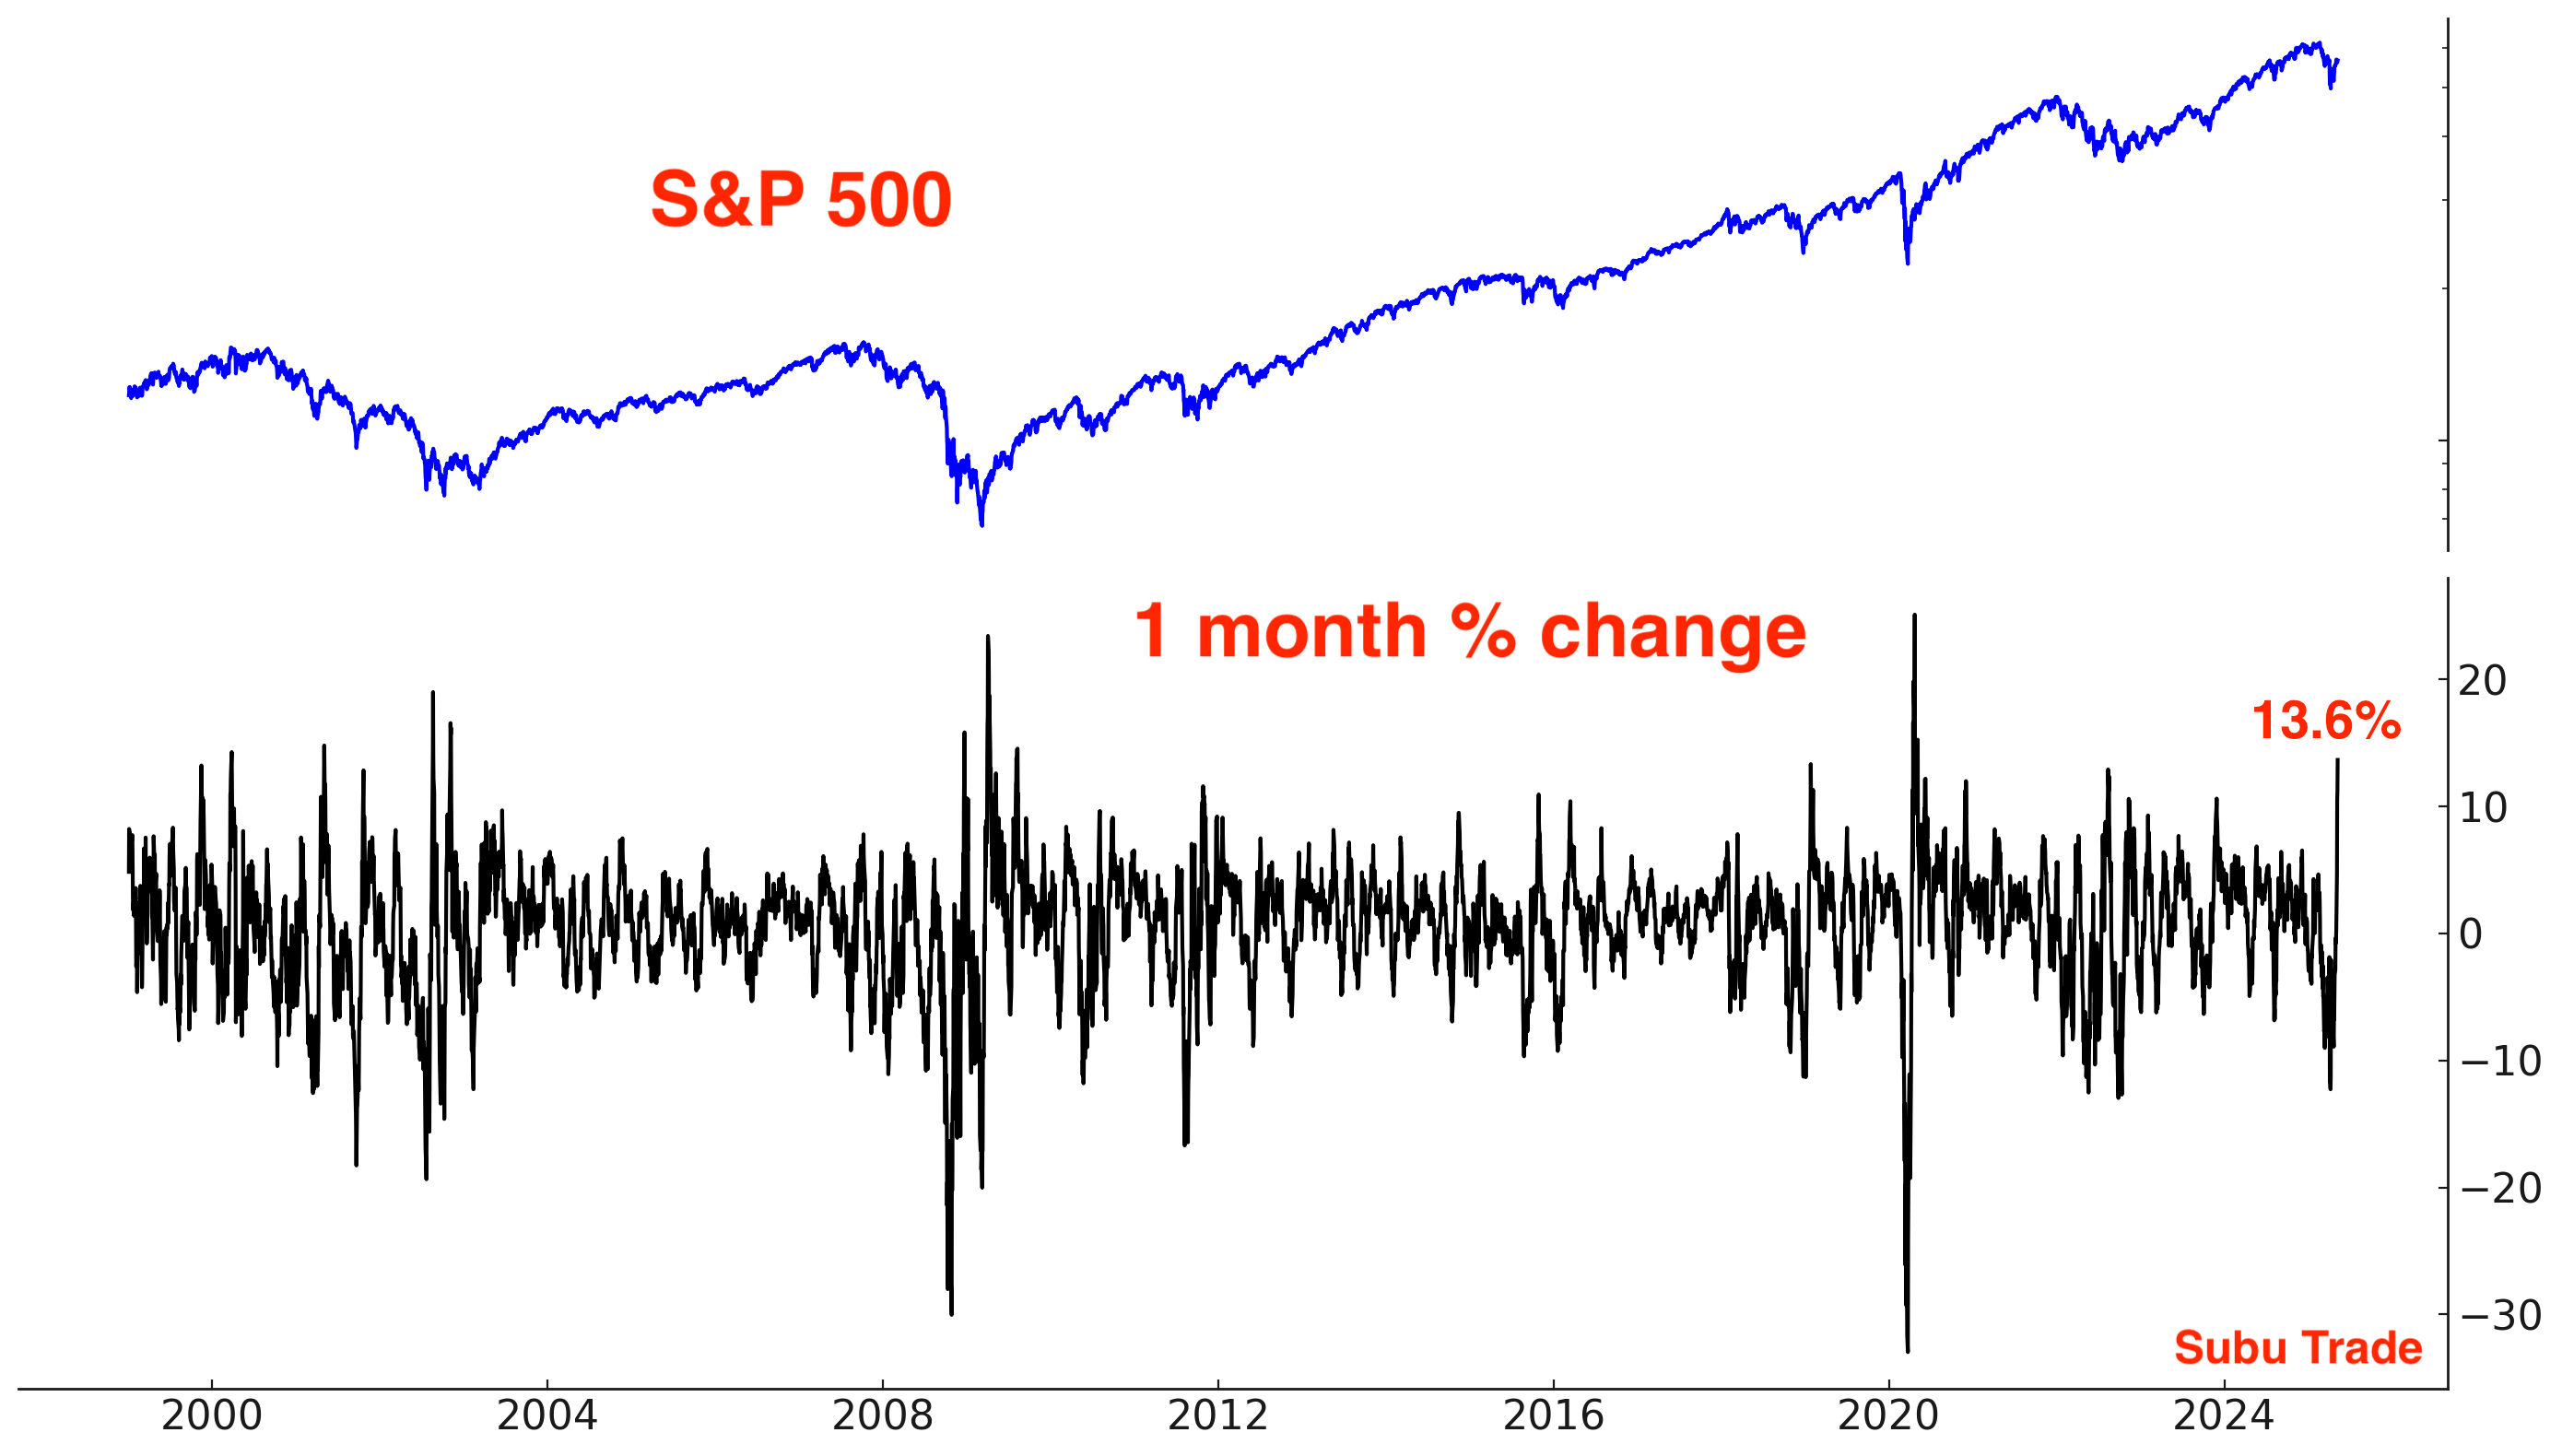
Big monthly gain
The S&P 500 gained +13.6% in the past month—a surge in momentum that historically led to further gains over the next 6 months. The key exceptions were during the 2000–2002 bear market, when short-lived bear market rallies fizzled out.

Meanwhile, VIX fell 5 straight weeks:
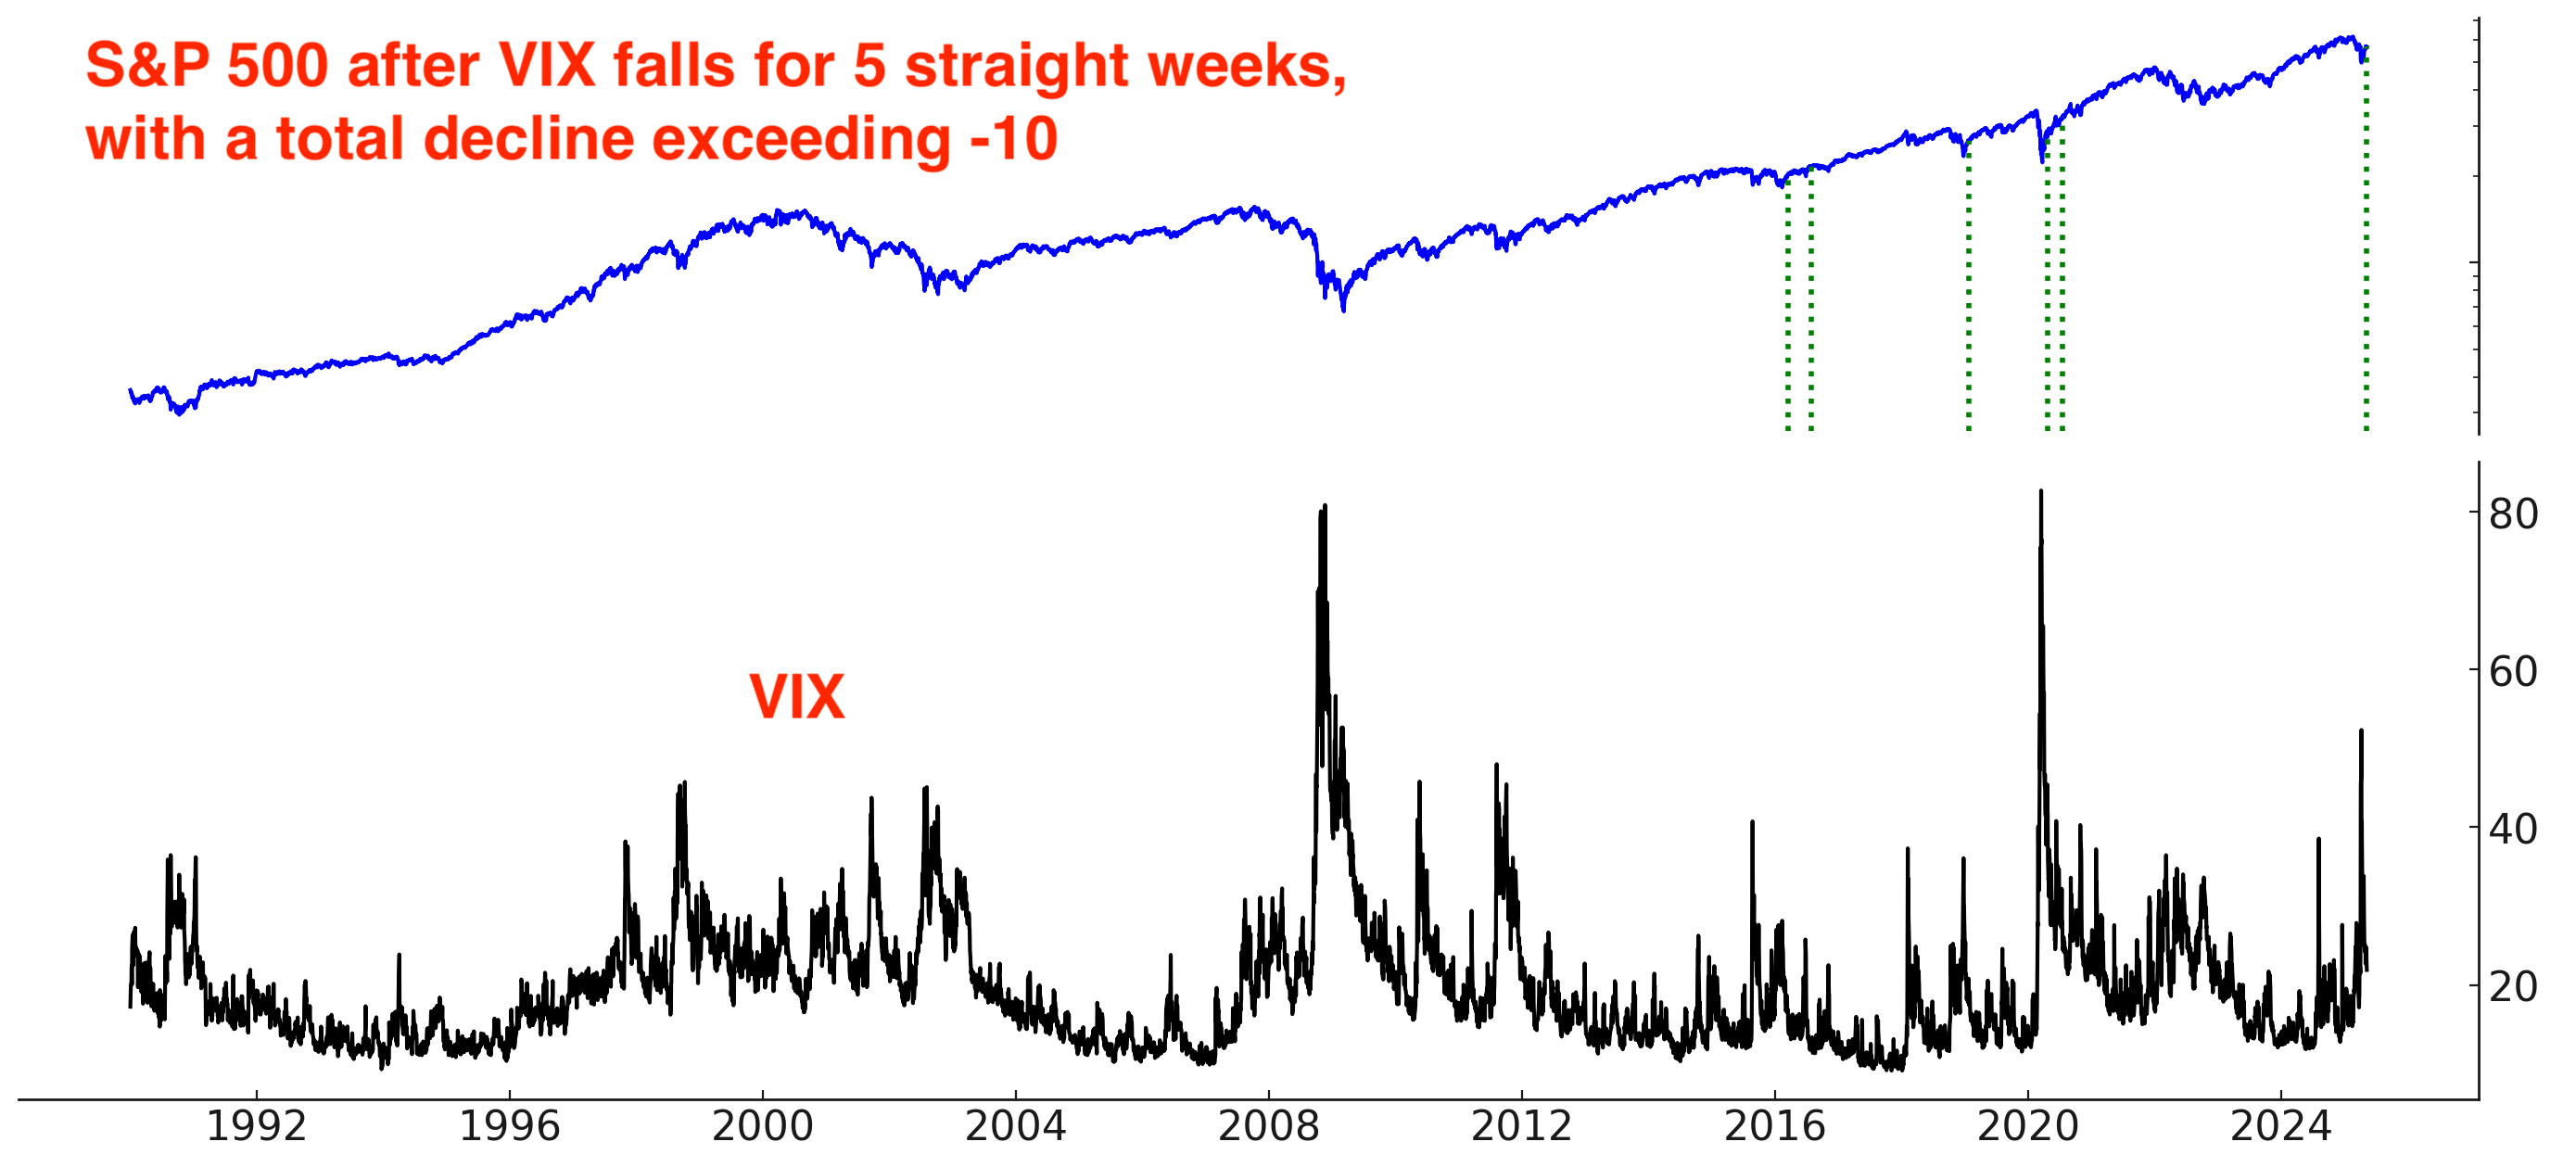
A large 5 week drop in VIX tends to be bullish for stocks. Here’s every case in which VIX fell 5 straight weeks, with the total 5-week decline exceeding -10:

We can increase the sample size by loosening the study’s parameters. Here’s every case in which VIX fell 5 straight weeks, with a total decline exceeding -5:

Sentiment Surveys
The latest reading for AAII Bears came in at 51.5%:

This is the 11th consecutive week in which AAII Bears exceeded 50%. A new record:

The latest Investors Intelligence Bulls-Bears reading is still below 0%. This is the 5th straight week in which Bulls-Bears was under 0%.

Long streaks of bearish sentiment are common when the stock market is deep in bear market territory. It’s not so common when the S&P 500 is within -10% of a 52 week high:

In contrast with the AAII and Investors Intelligence sentiment surveys, the NAAIM Exposure Index saw a big rebound this week. Asset managers significantly increased their exposure to stocks as they chased the rally:

Breadth
Last week I wrote “Breadth remains strong. The S&P 500 McClellan Oscillator is climbing. This could lead to a short term pullback.”
We got a small pullback earlier this week. The S&P 500’s McClellan Oscillator dipped:

Here are the % of S&P 500 stocks above their 200 and 50 day moving averages:

Here are the % of NASDAQ 100 stocks above their 200 and 50 day moving averages:

Options
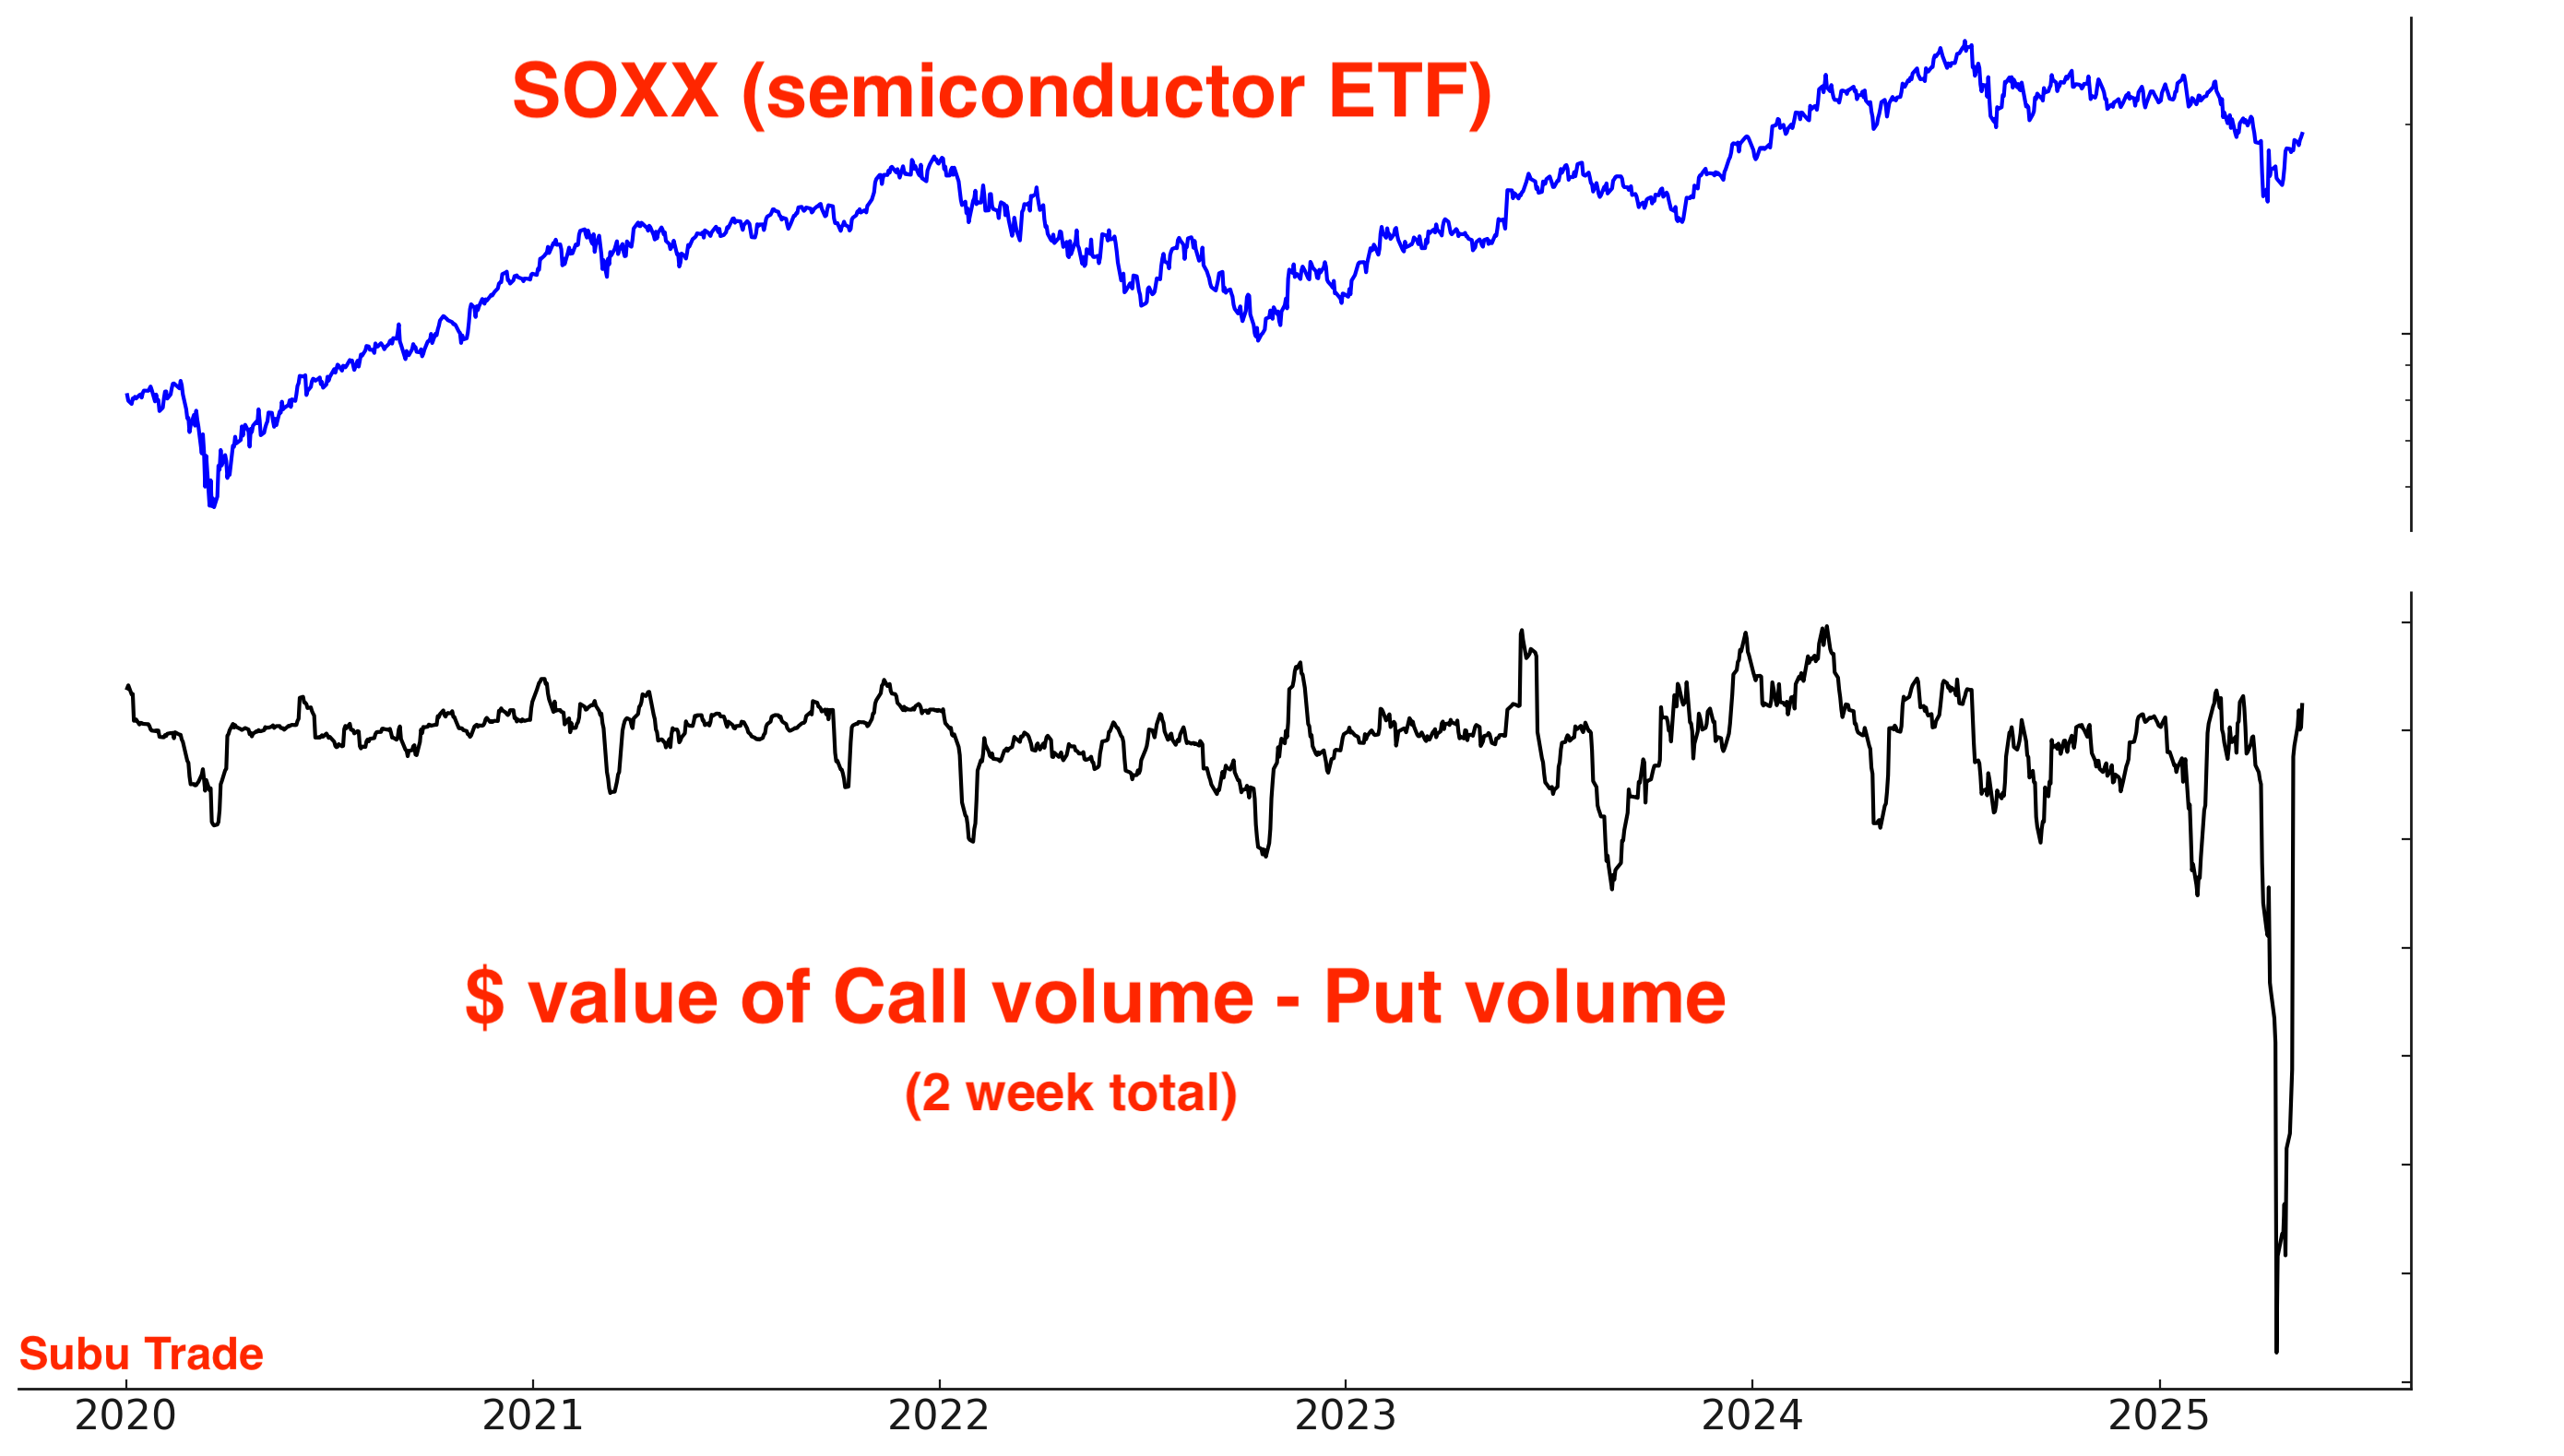
After a historic spike down, the $ value of SOXX Call volume - Put volume recovered:
The dollar value of SPY Call volume - Put volume also recovered:

So has that of S&P 500 options:

The SKEW Index is low. The probability of another stock market crash is small:

Other sentiment
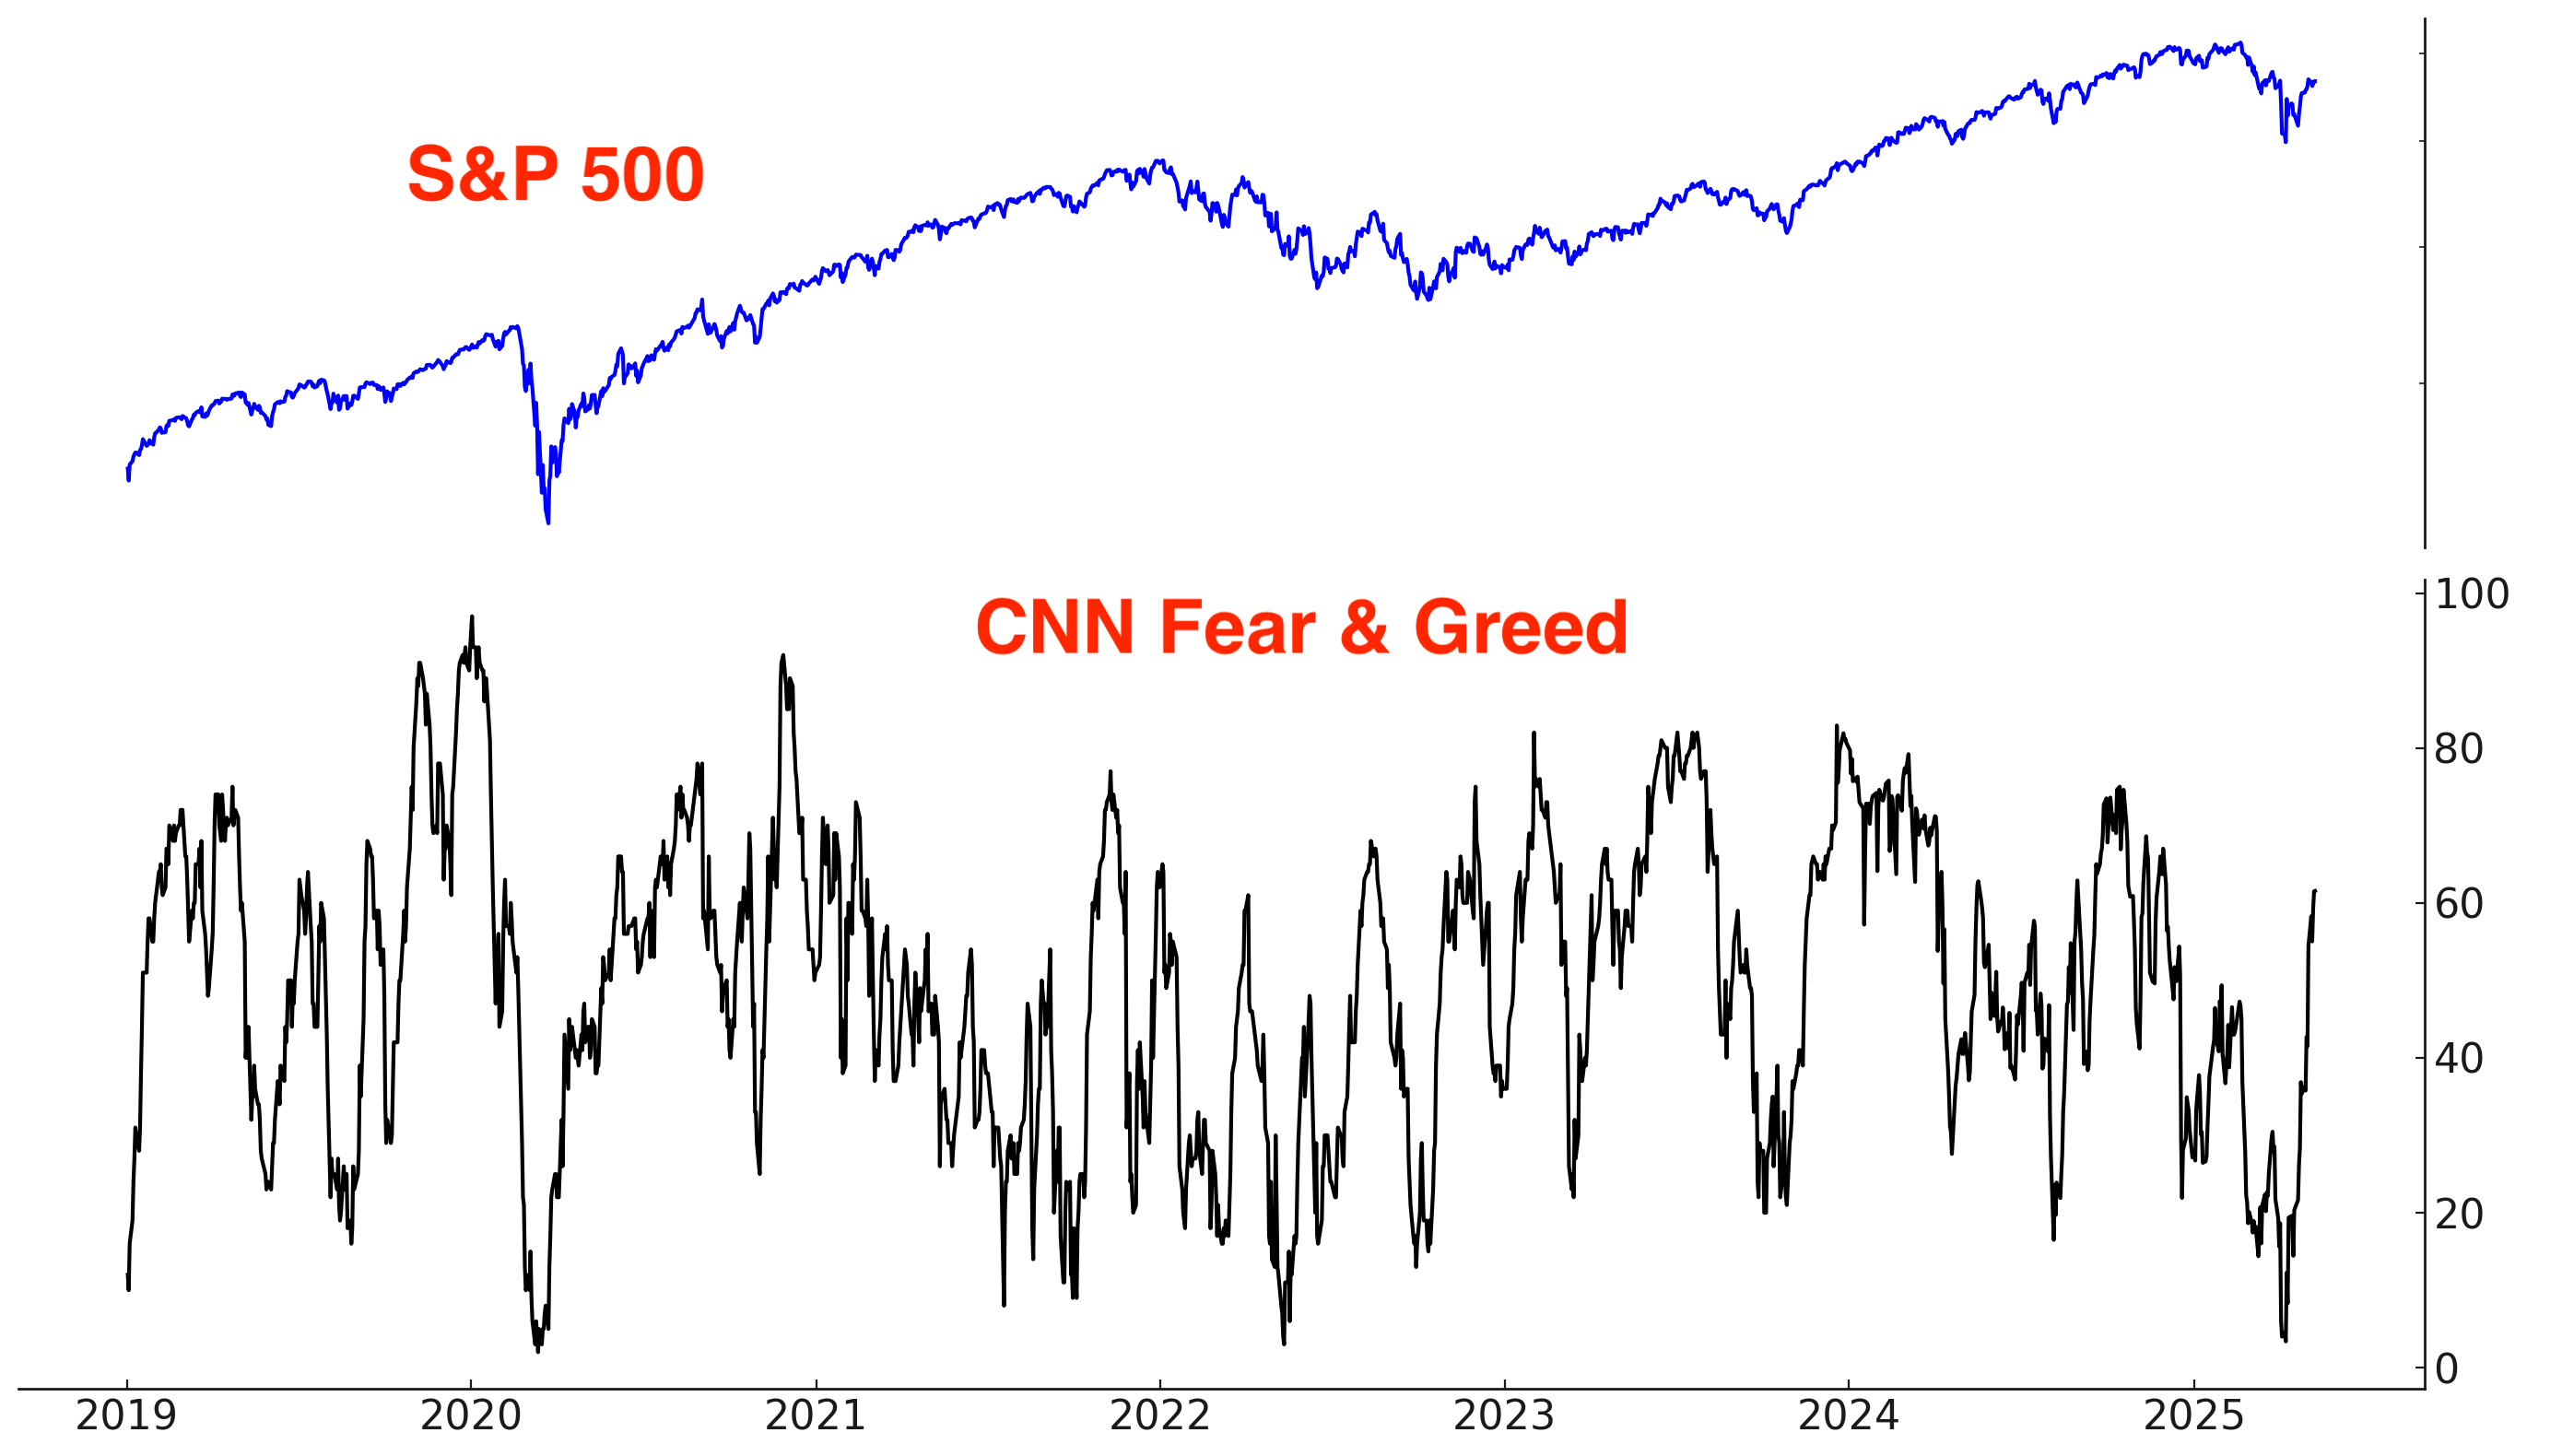
CNN Fear & Greed recovered from deep pessimism:
The S&P 500’s Daily Sentiment Index recovered from deep pessimism:

VIX’s Daily Sentiment Index is falling. Fear is subsiding:

COT Report
The latest COT Report demonstrates that Large Speculators are the most net long VIX futures in years…

While Commercials are the most net short in years:

This is a bullish sign for stocks.
Corporate Insiders
The Corporate Insider Buy/Sell ratio fell a little this week:
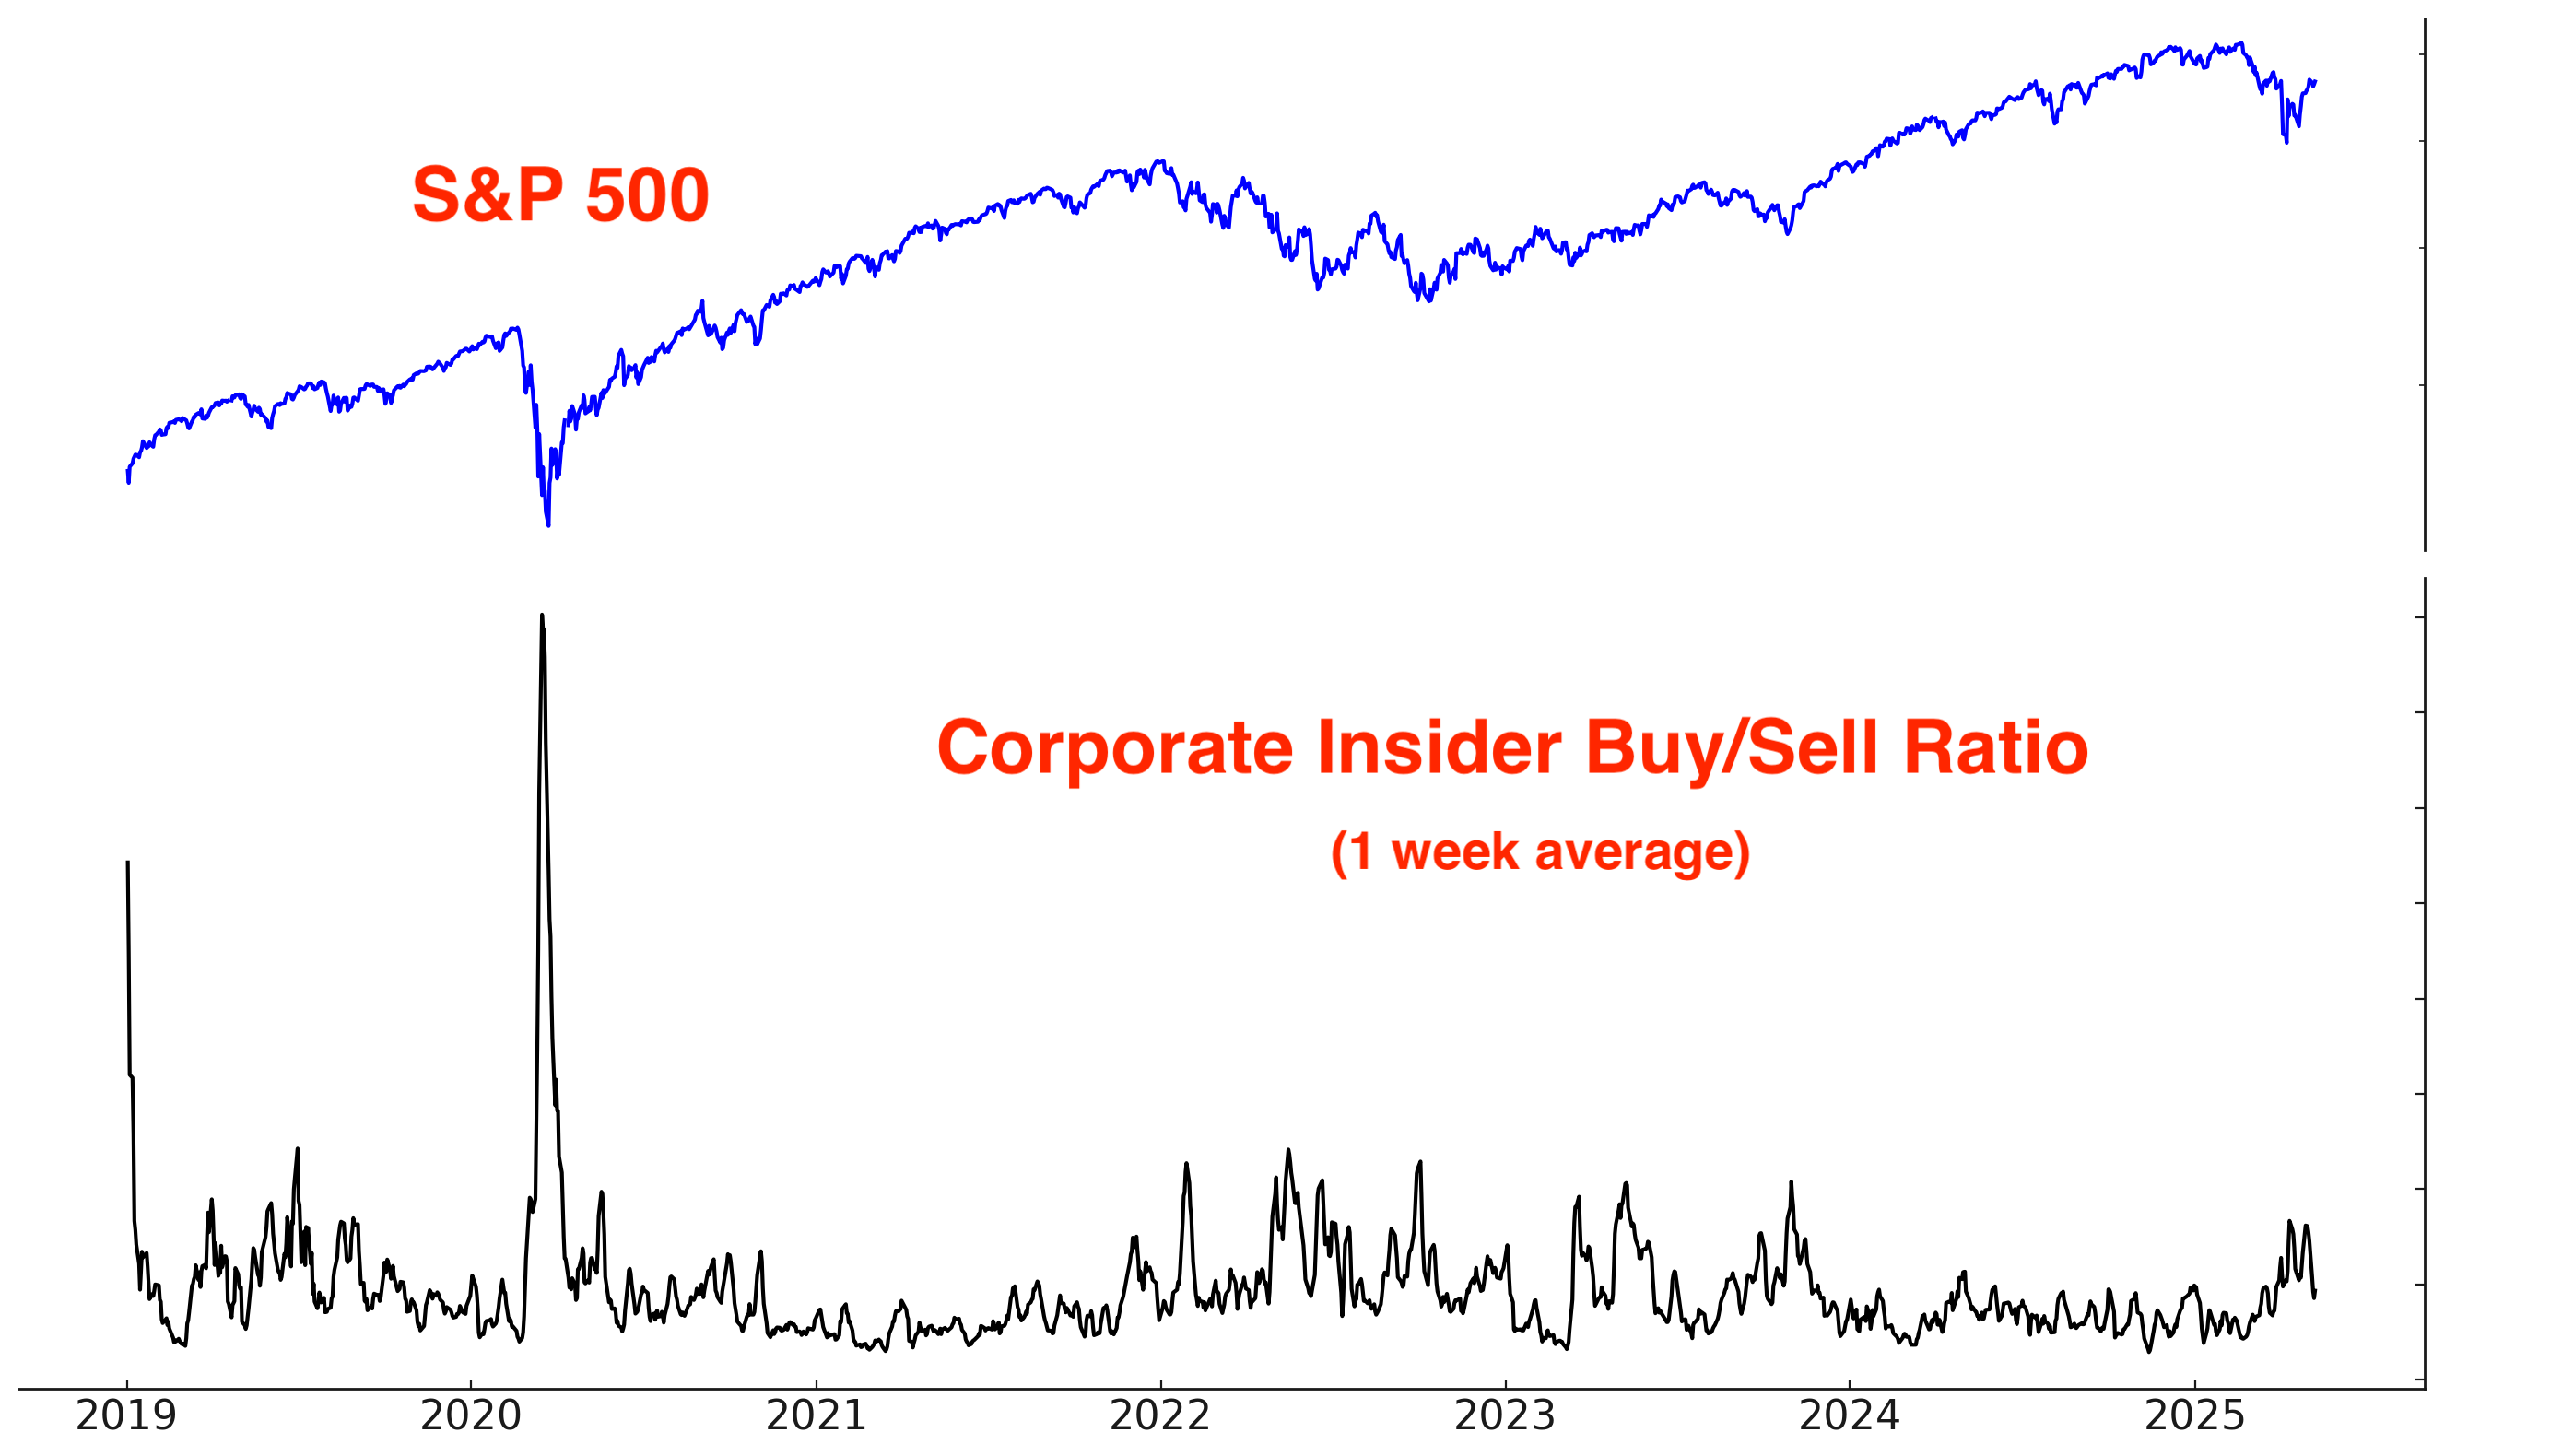
This is more obvious when displaying the same chart with a log scale:

Trend & Resistance
The trend is your friend, until it ends. The U.S. stock market is no longer trending down:

Why does this matter? Because at least from a trend following perspective, it’s better to buy when the market is trending Up (e.g. above its 200-DMA) than when the market is trending Down (e.g. below its 200-DMA). This doesn’t mean that the market can’t rally from below it’s 200-DMA. It simply means that risk and volatility are higher down there.

Stocks have already mean-reverted upwards. Now comes the hard part. Risk/Reward favors neither bulls nor bears right now. The next move (Up or Down) is dependent on the outcome of trade negotiations.
Many indices and sectors are sitting at major resistance.
S&P 500:

NASDAQ 100:

Financial sector:

Germany:

Could 2025 be similar to 2015-2016, when markets chopped around sideways in a massive range?

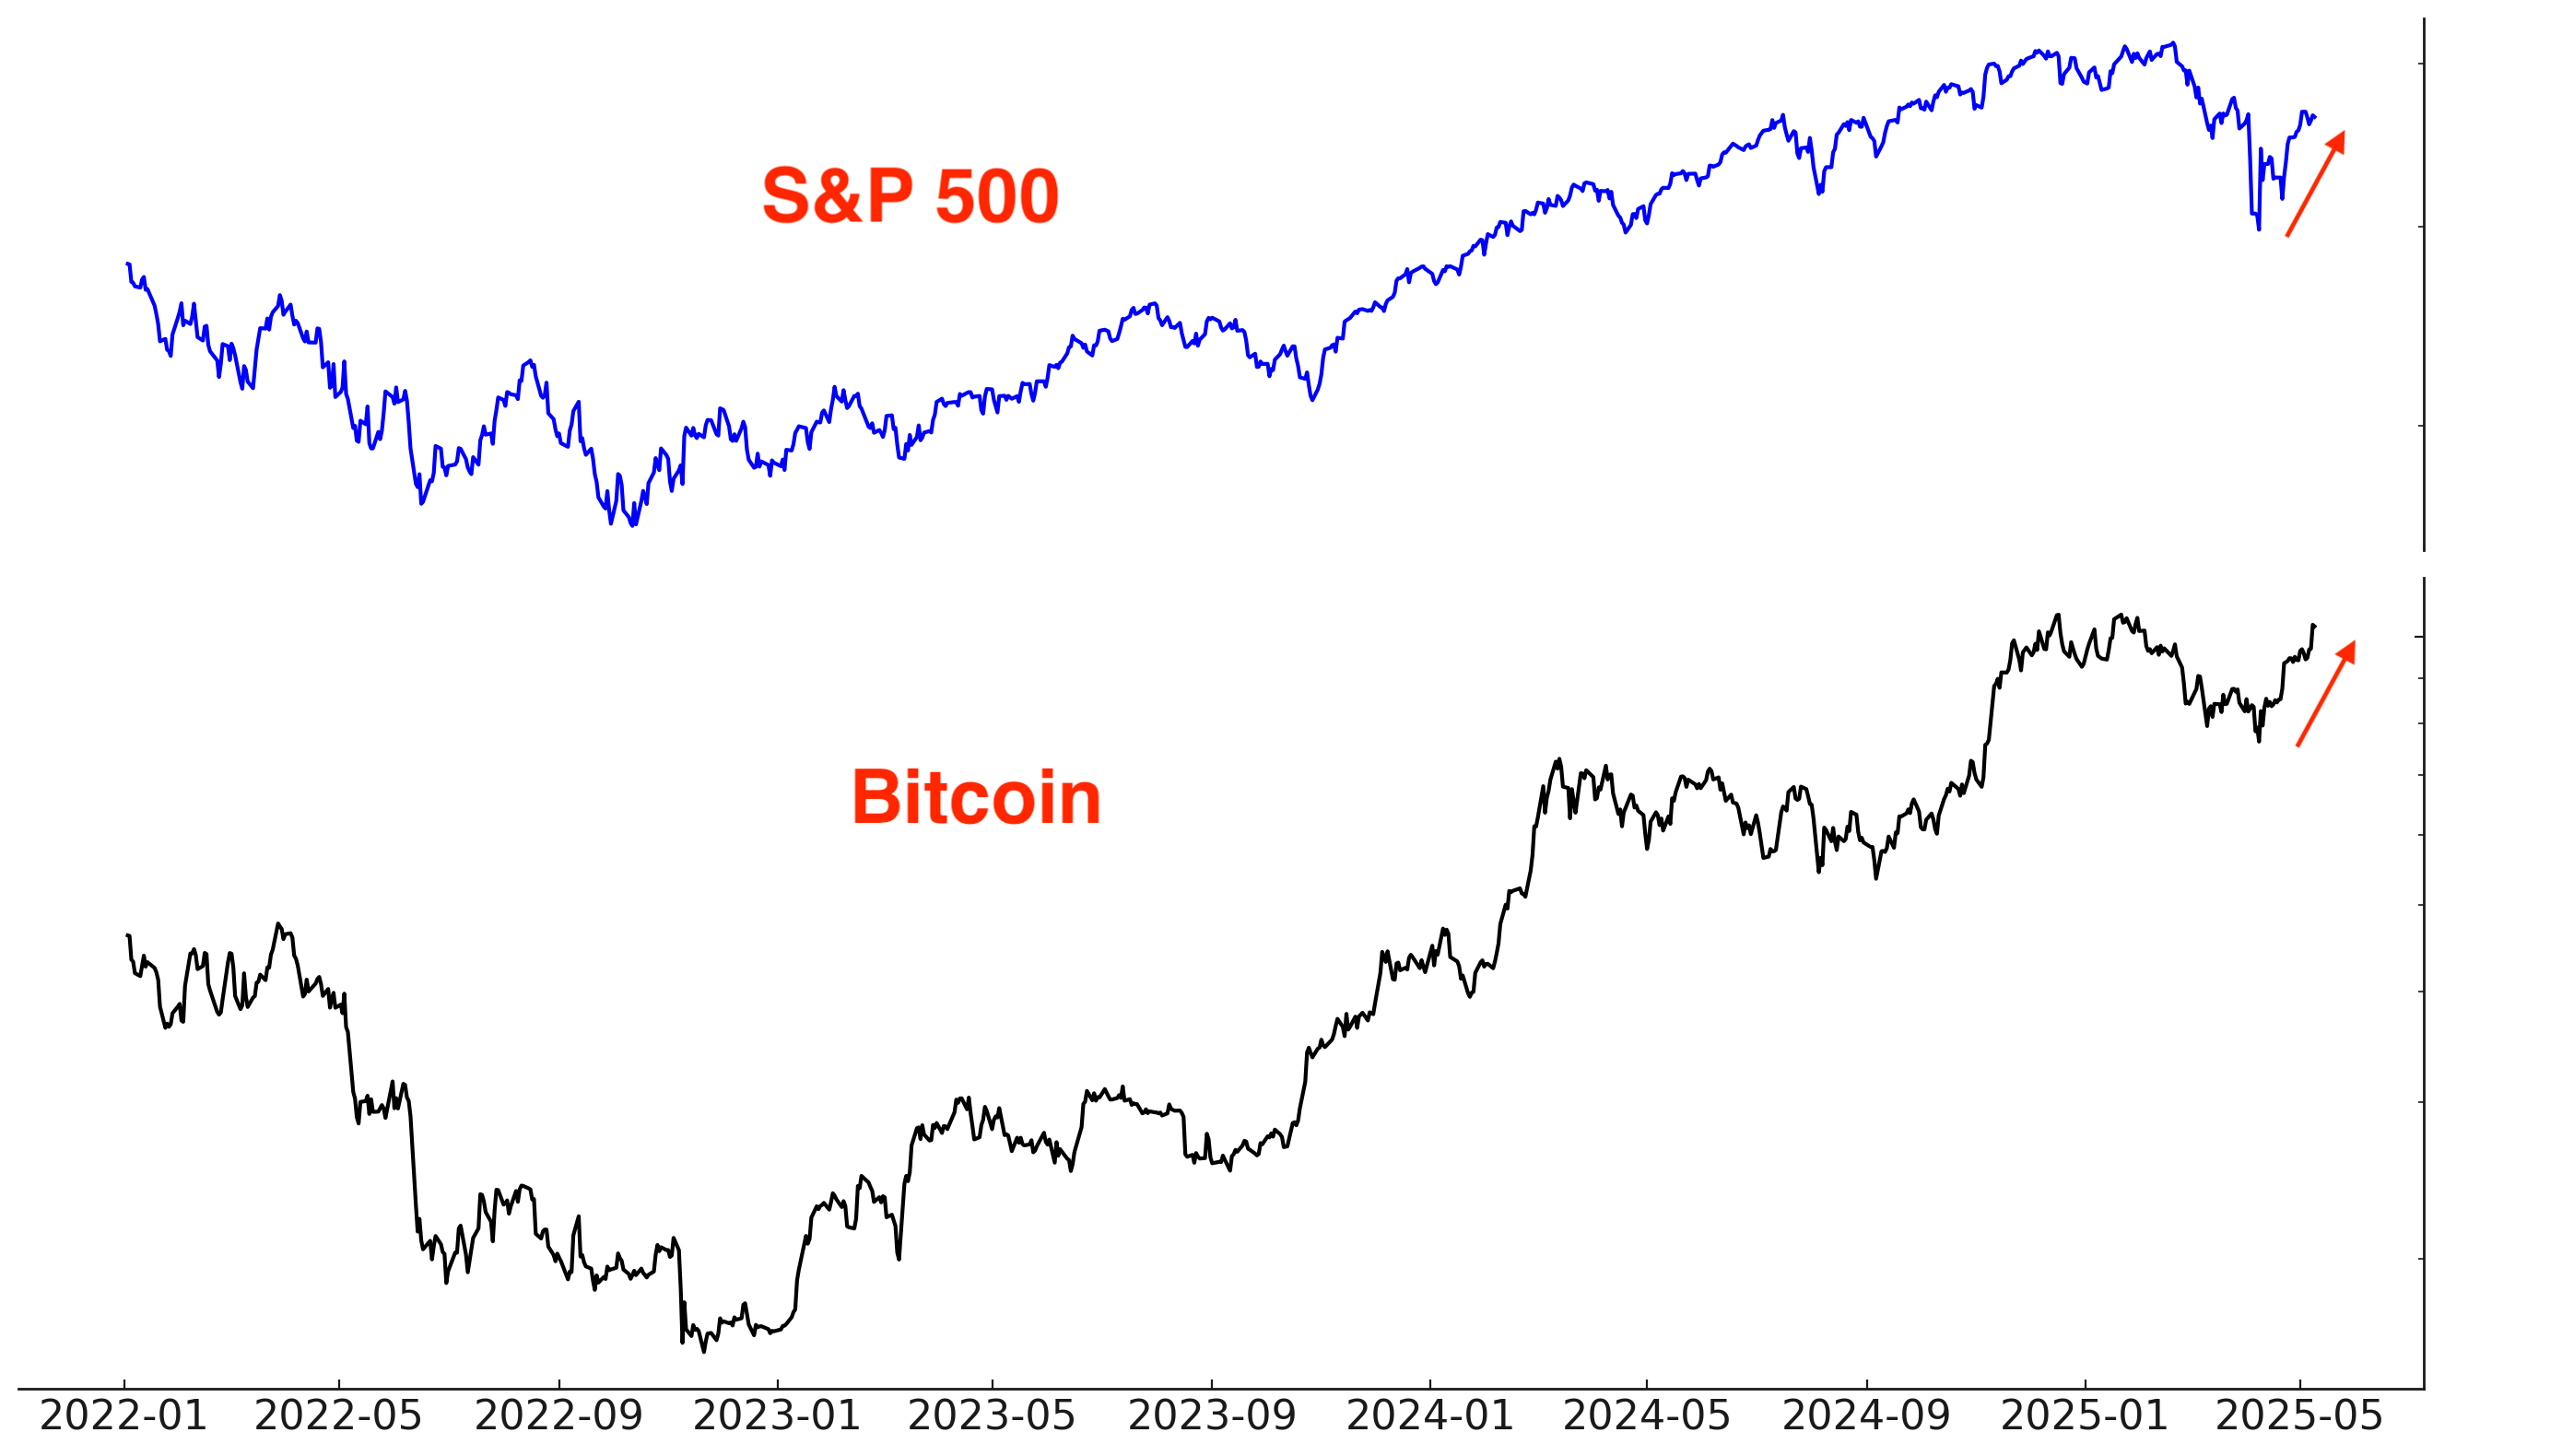
Bitcoin
Bitcoin is a high-beta, risk-on asset that generally rises when stocks rally and struggles when stocks fall. While its directional correlation with stocks is clear, its price action is unique—less wave-like, more staircase: sharp moves followed by prolonged consolidations.
Bitcoin performed relatively well when stocks fell in February-April. Now that stocks are rallying, Bitcoin is also rallying. Bitcoin’s price action has been exemplar over the past few months.
Trend
Bitcoin is trending up, but has yet to break out above its all-time high:

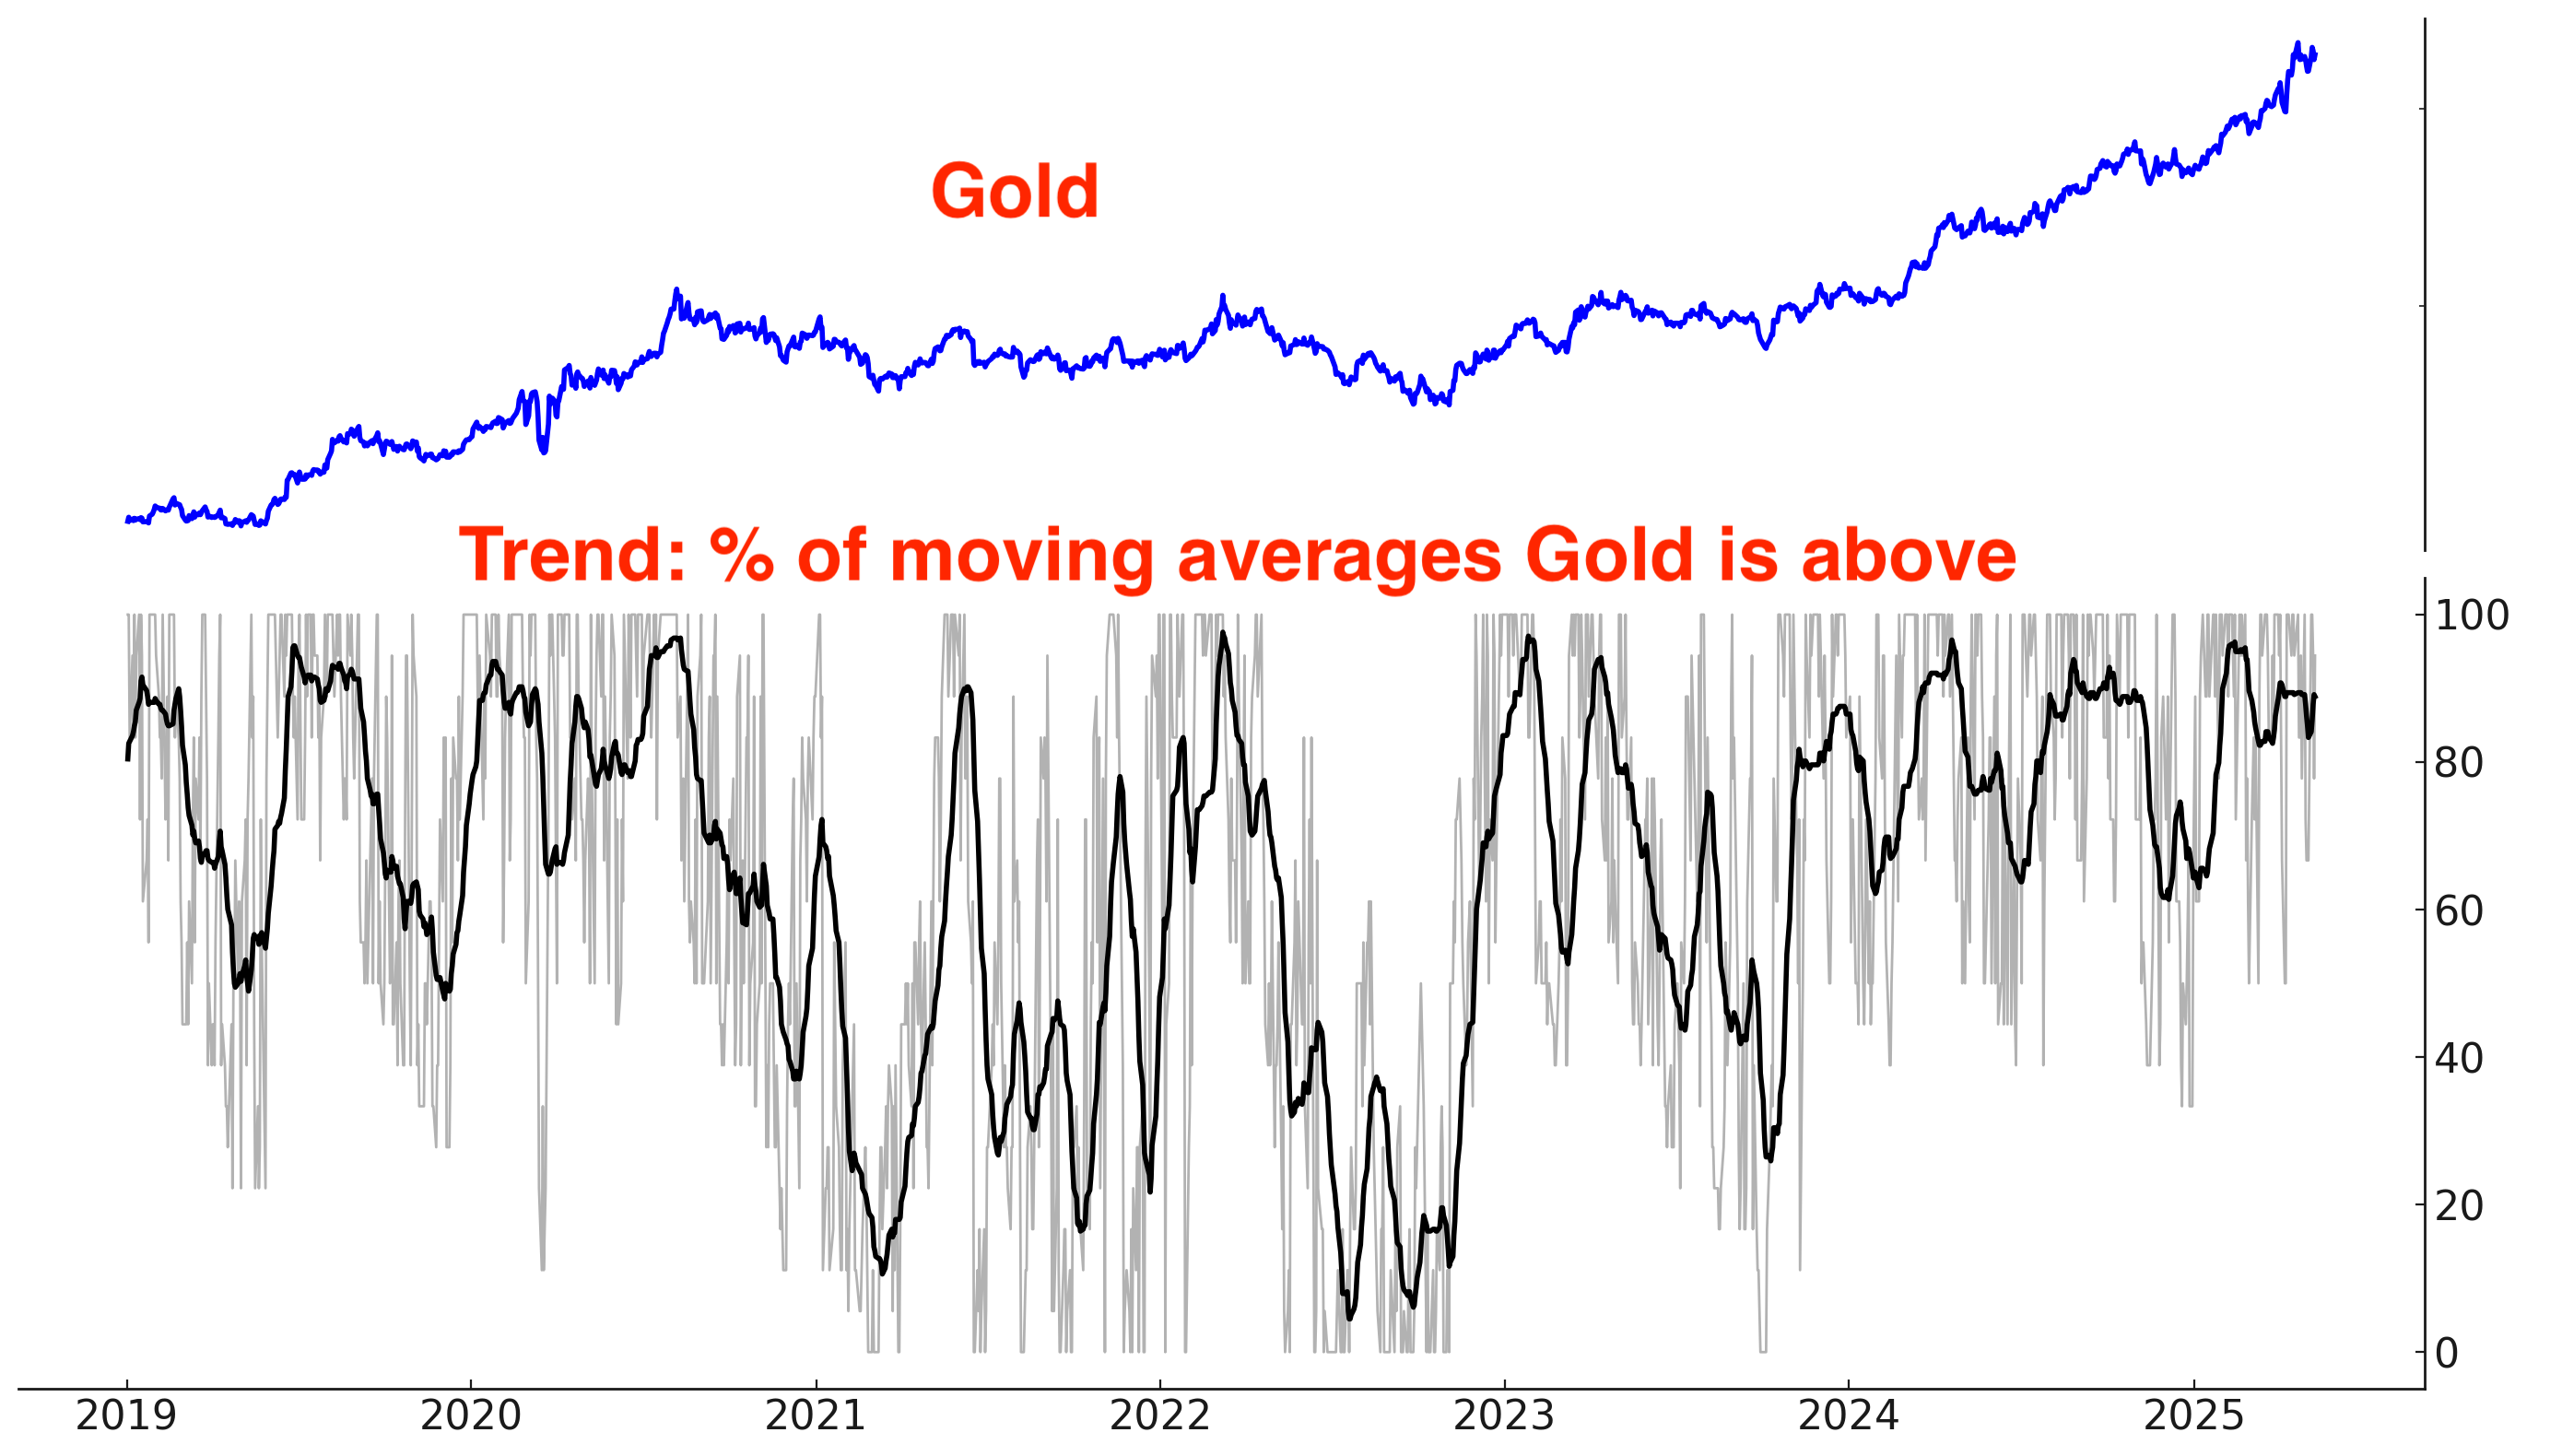
Gold, silver, and energy
After a massive spike, gold is in a consolidation phase.

Gold could take several weeks/months to work off its extreme overbought conditions. The bullish theme/narrative for gold is still alive, but I will re-evaluate the bull case later when this correction/consolidation is over.
Trend
After a huge spike, gold is trending sideways:
Options
The massive spike in the $ value of GLD call volume - put volume is coming down:

Sentiment
Gold’s Daily Sentiment Index is no longer elevated:

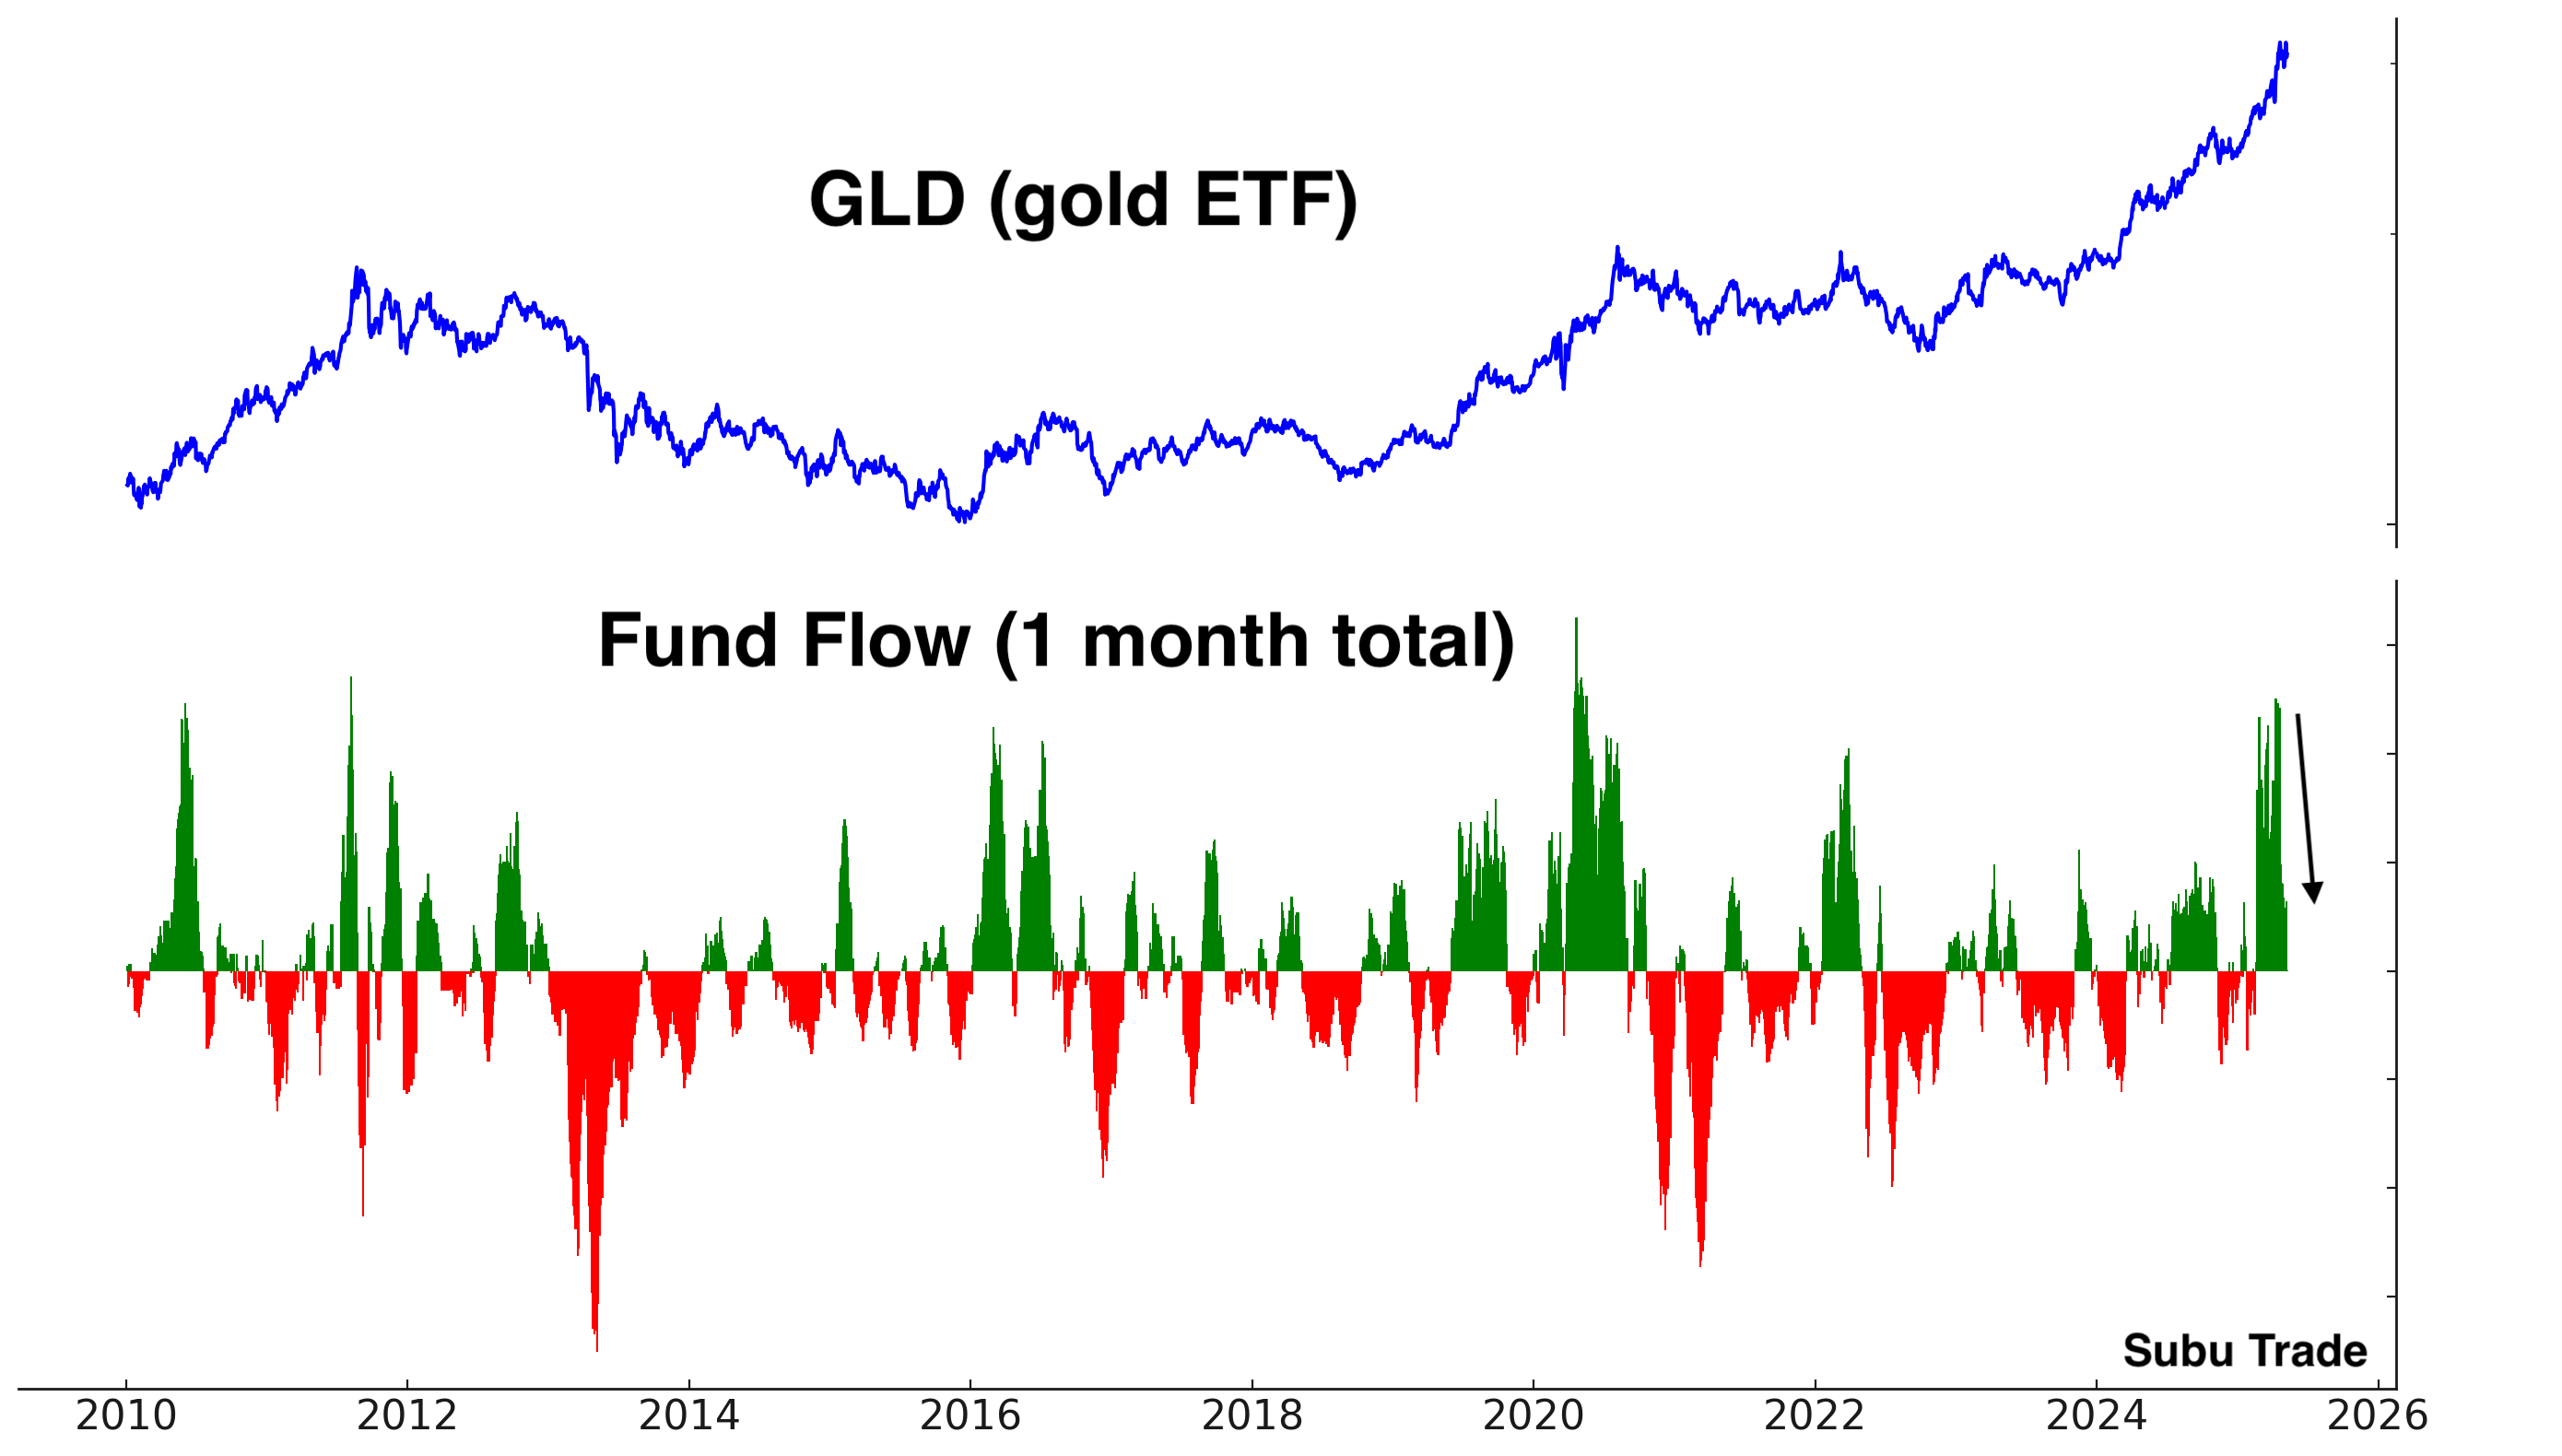
Fund Flows
Inflows into GLD are falling:
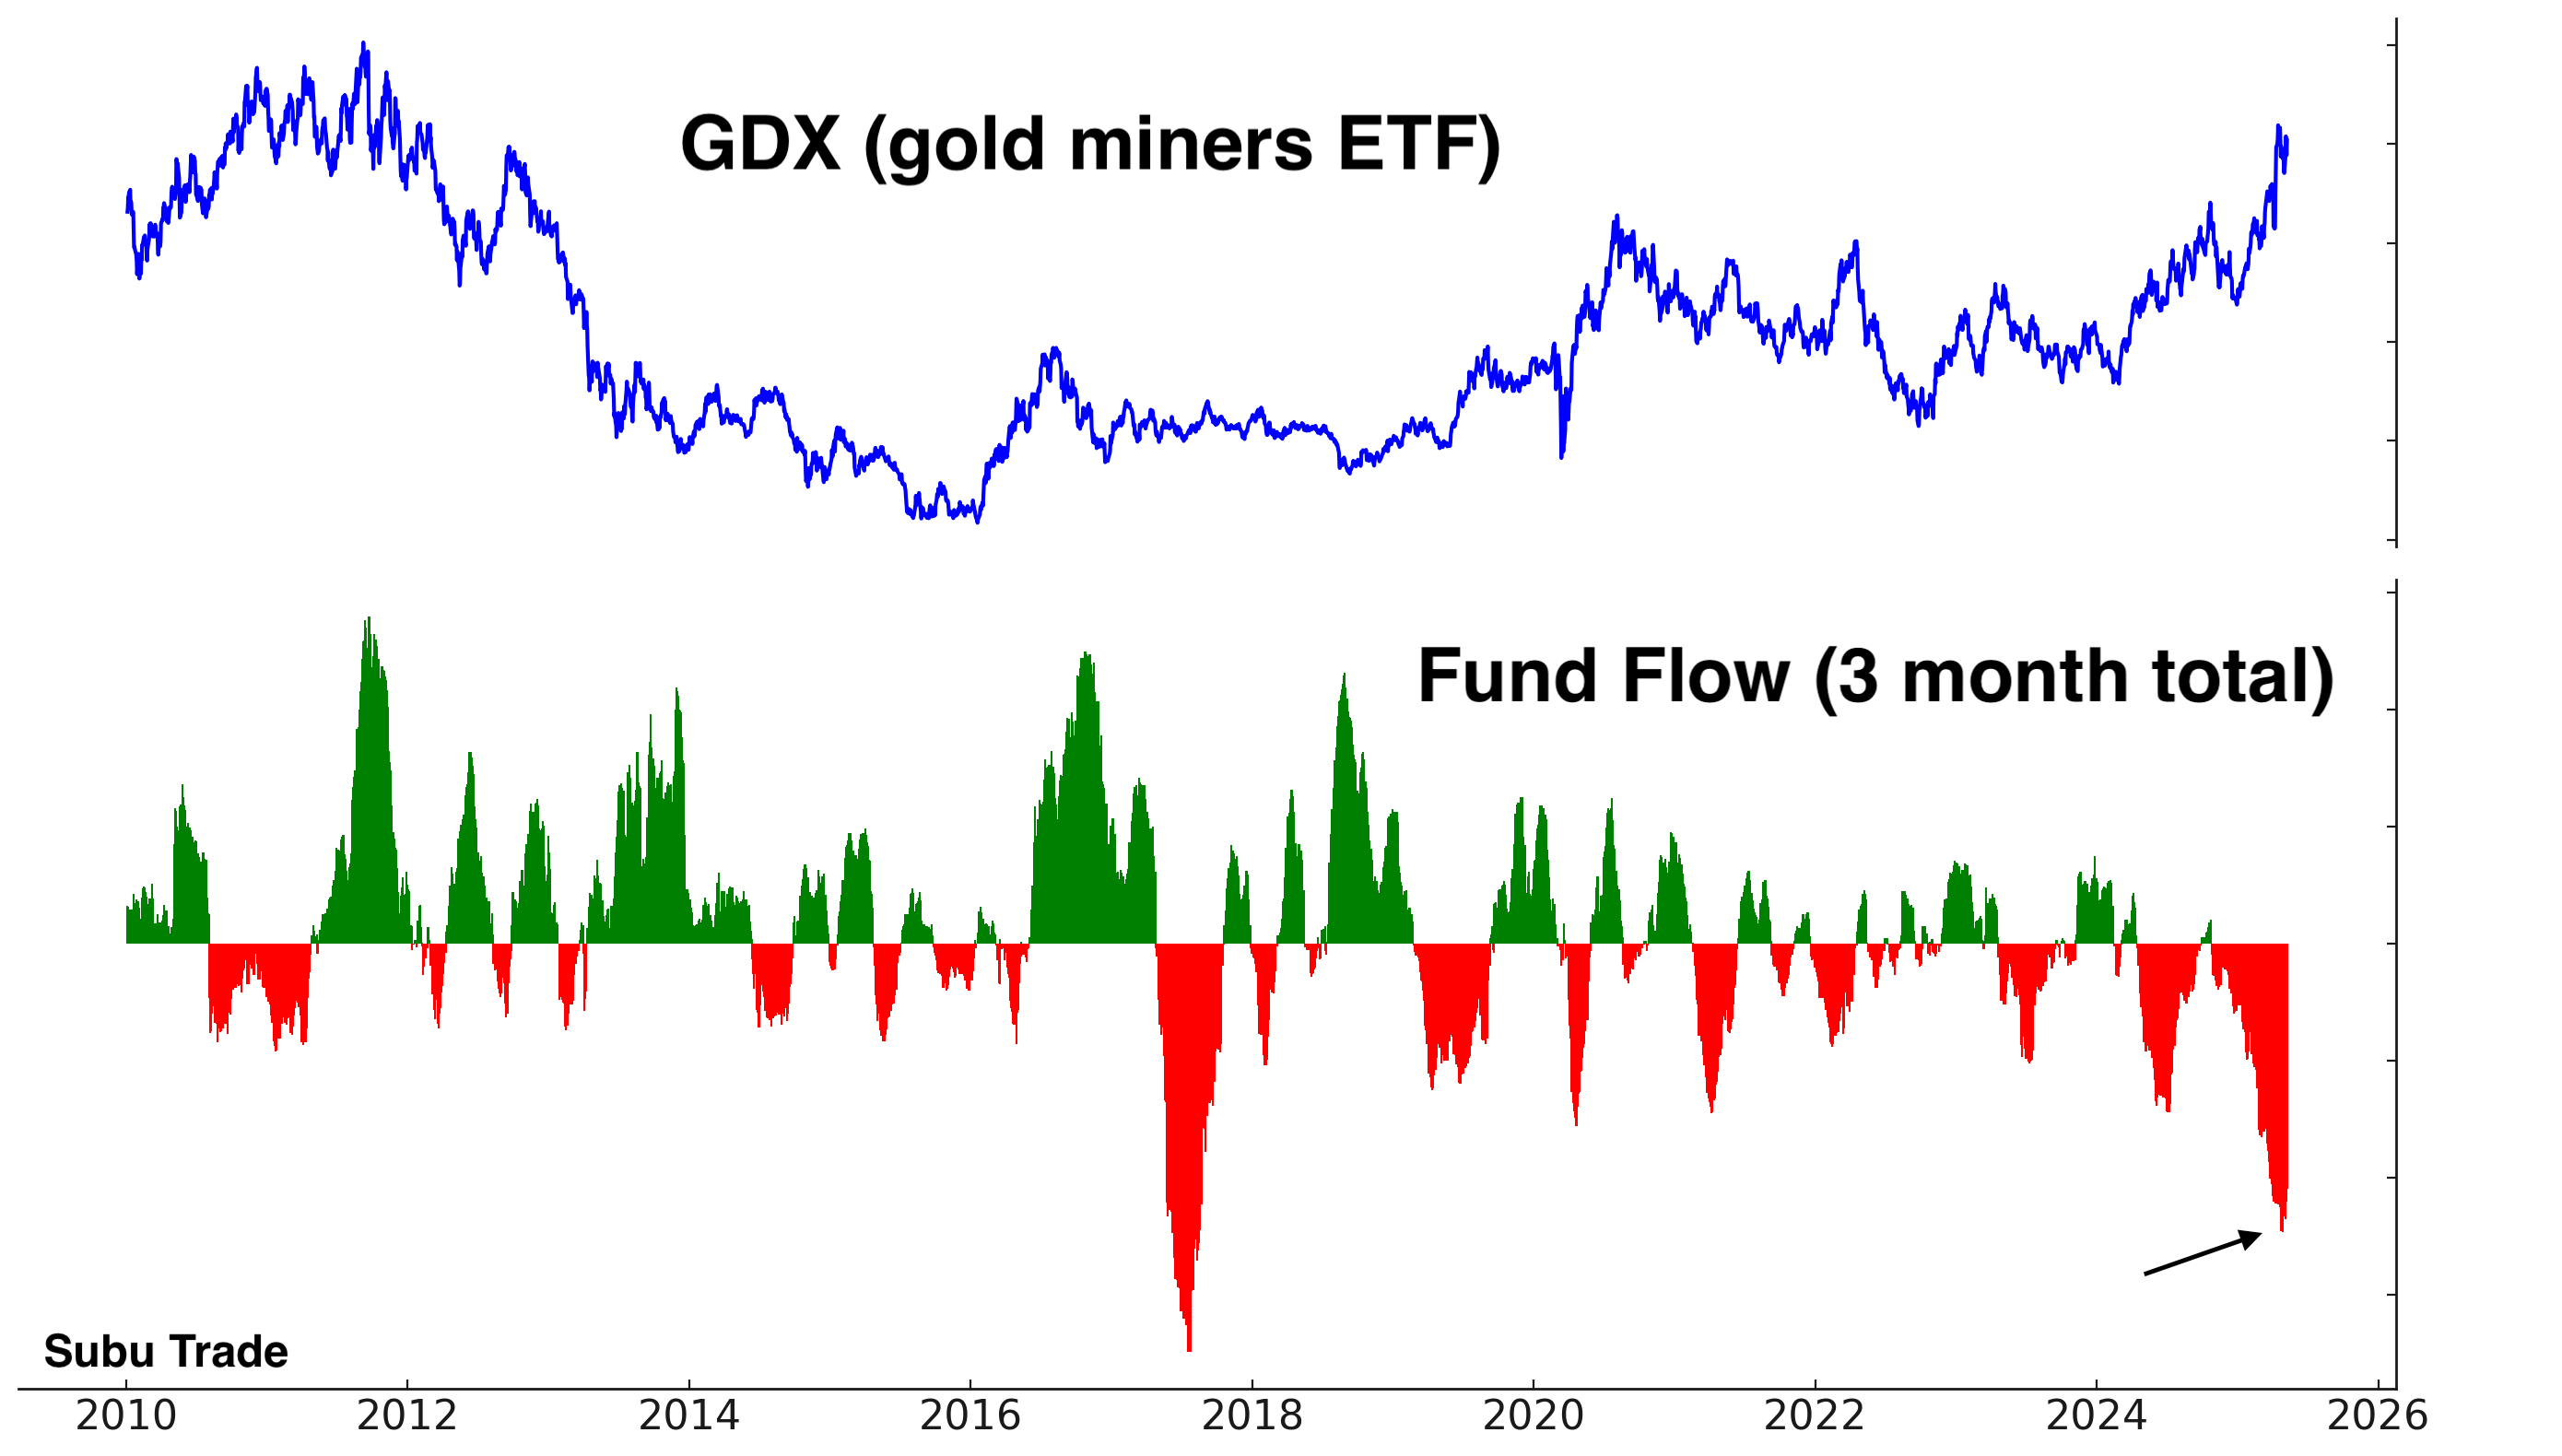
GDX fund flows have been interesting. When gold miners rallied from January-April, GDX saw non-stop outflows. Perhaps investors were selling GDX (a sector ETF) and buying individual gold mining stocks instead:
Theme/narrative
The long term bullish theme/narrative for gold remains: global central banks (primarily China) need to diversify their reserve holdings away from U.S. Treasuries. Gold will pick up some of that diversification:

Energy
Crude oil double-bottomed this week. I remain cautiously optimistic. I’m looking for a mean-reversion bounce.
The COT Report demonstrates that Dealers (smart money) are the most net long energy since the COVID bottom. On the other hand, Asset Managers (dumb money) are net short:

*There is nothing inherently “smart” about “smart money” or “dumb” about “dumb money”. “Smart money” mostly refers to market participants who are contrarian. “Dumb money” mostly refers to market participants who are trend followers.
Energy Sentiment
Oil sentiment is starting to bounce from extreme pessimism levels:

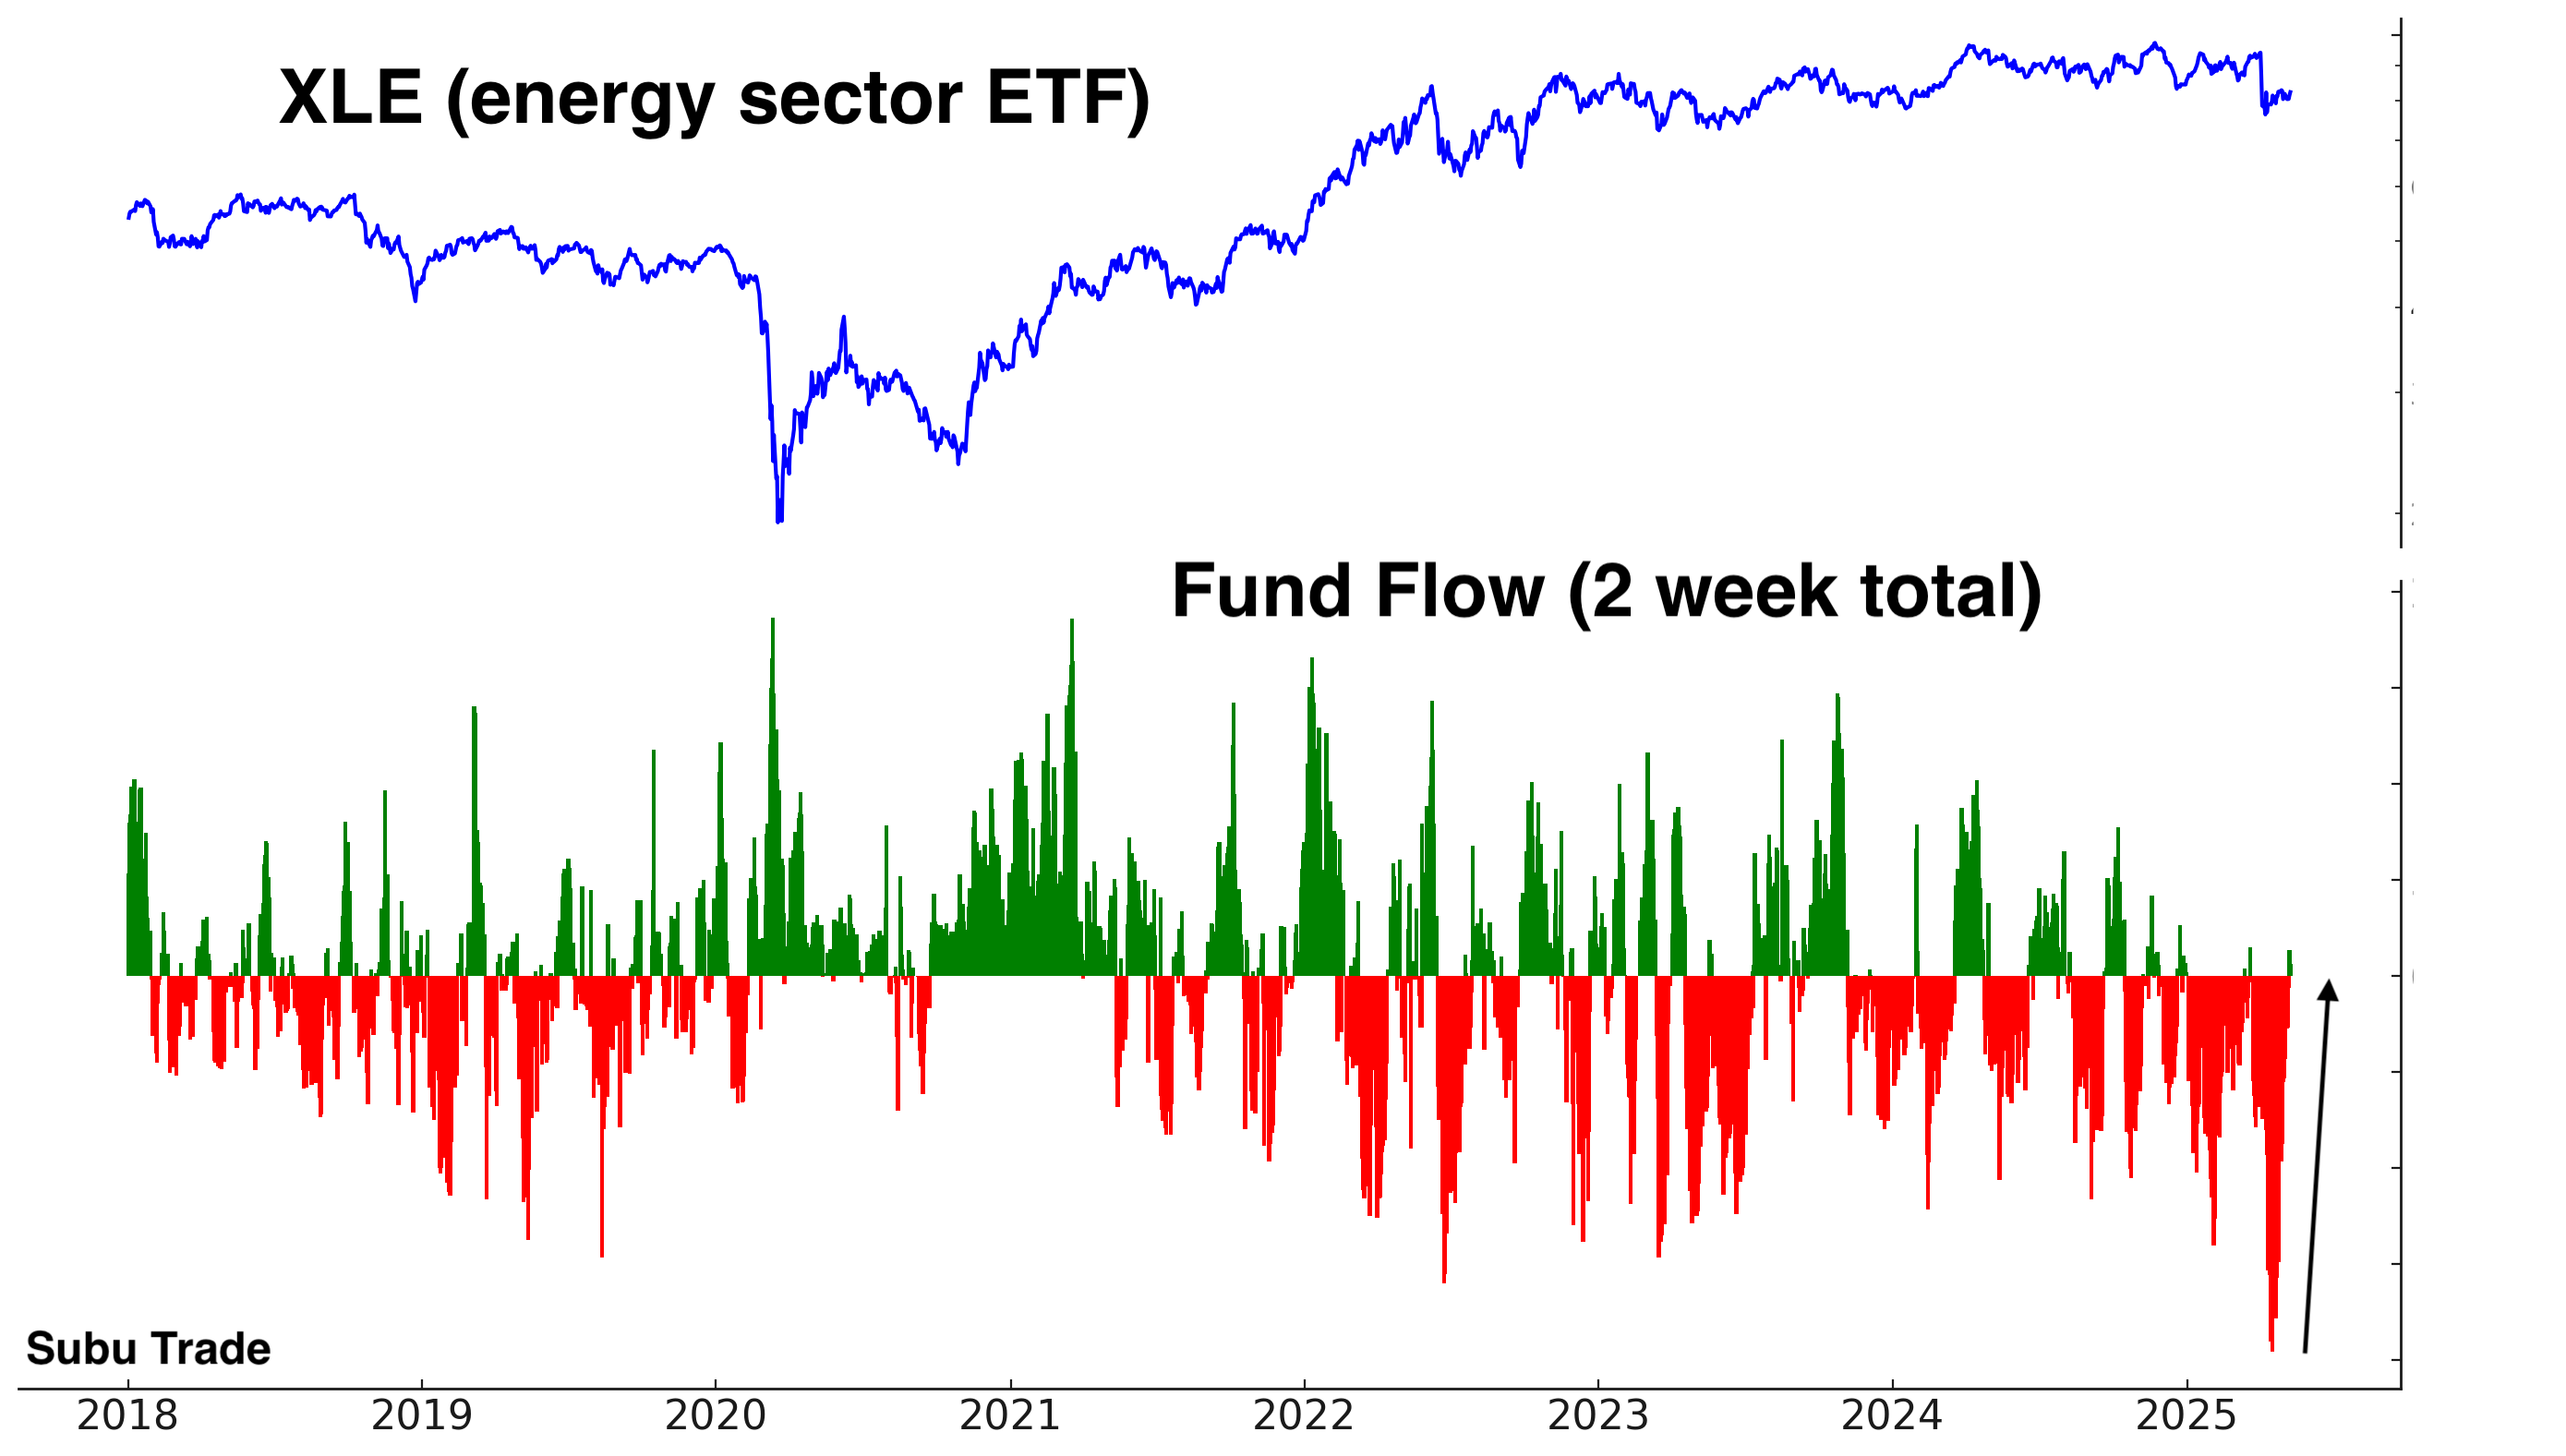
Fund Flow
Outflows from XLE are starting to stabilize:
There is one problem with the bullish case for oil. If the U.S. Dollar rallies, will that put downwards pressure on oil?
India & China
I’m bullish on India and believe that this is India’s Century. Trump’s tariffs may bring back some high-end manufacturing to the U.S., but they won’t revive labor-intensive manufacturing. Labor-intensive manufacturing for textiles, electronics etc. will likely move from China to India. India will become a “triple-engined” economy, relying on service exports (office jobs outsourced to India), manufacturing exports, and foreign remittances to grow its economy.
Indian stocks were hurt this week by the India-Pakistan conflict, with the Indian Rupee also losing ground against the U.S. Dollar. India and Pakistan have agreed to a ceasefire. This conflict is unlikely to alter the long-term bullish outlook for India.
India Trend
Indian stocks were trending higher before this week’s India-Pakistan conflict:

India Breadth
Here are the % of Nifty 50 stocks above their 200 and 50 day moving averages:

India Fund Flows
Indian ETFs are seeing inflows:

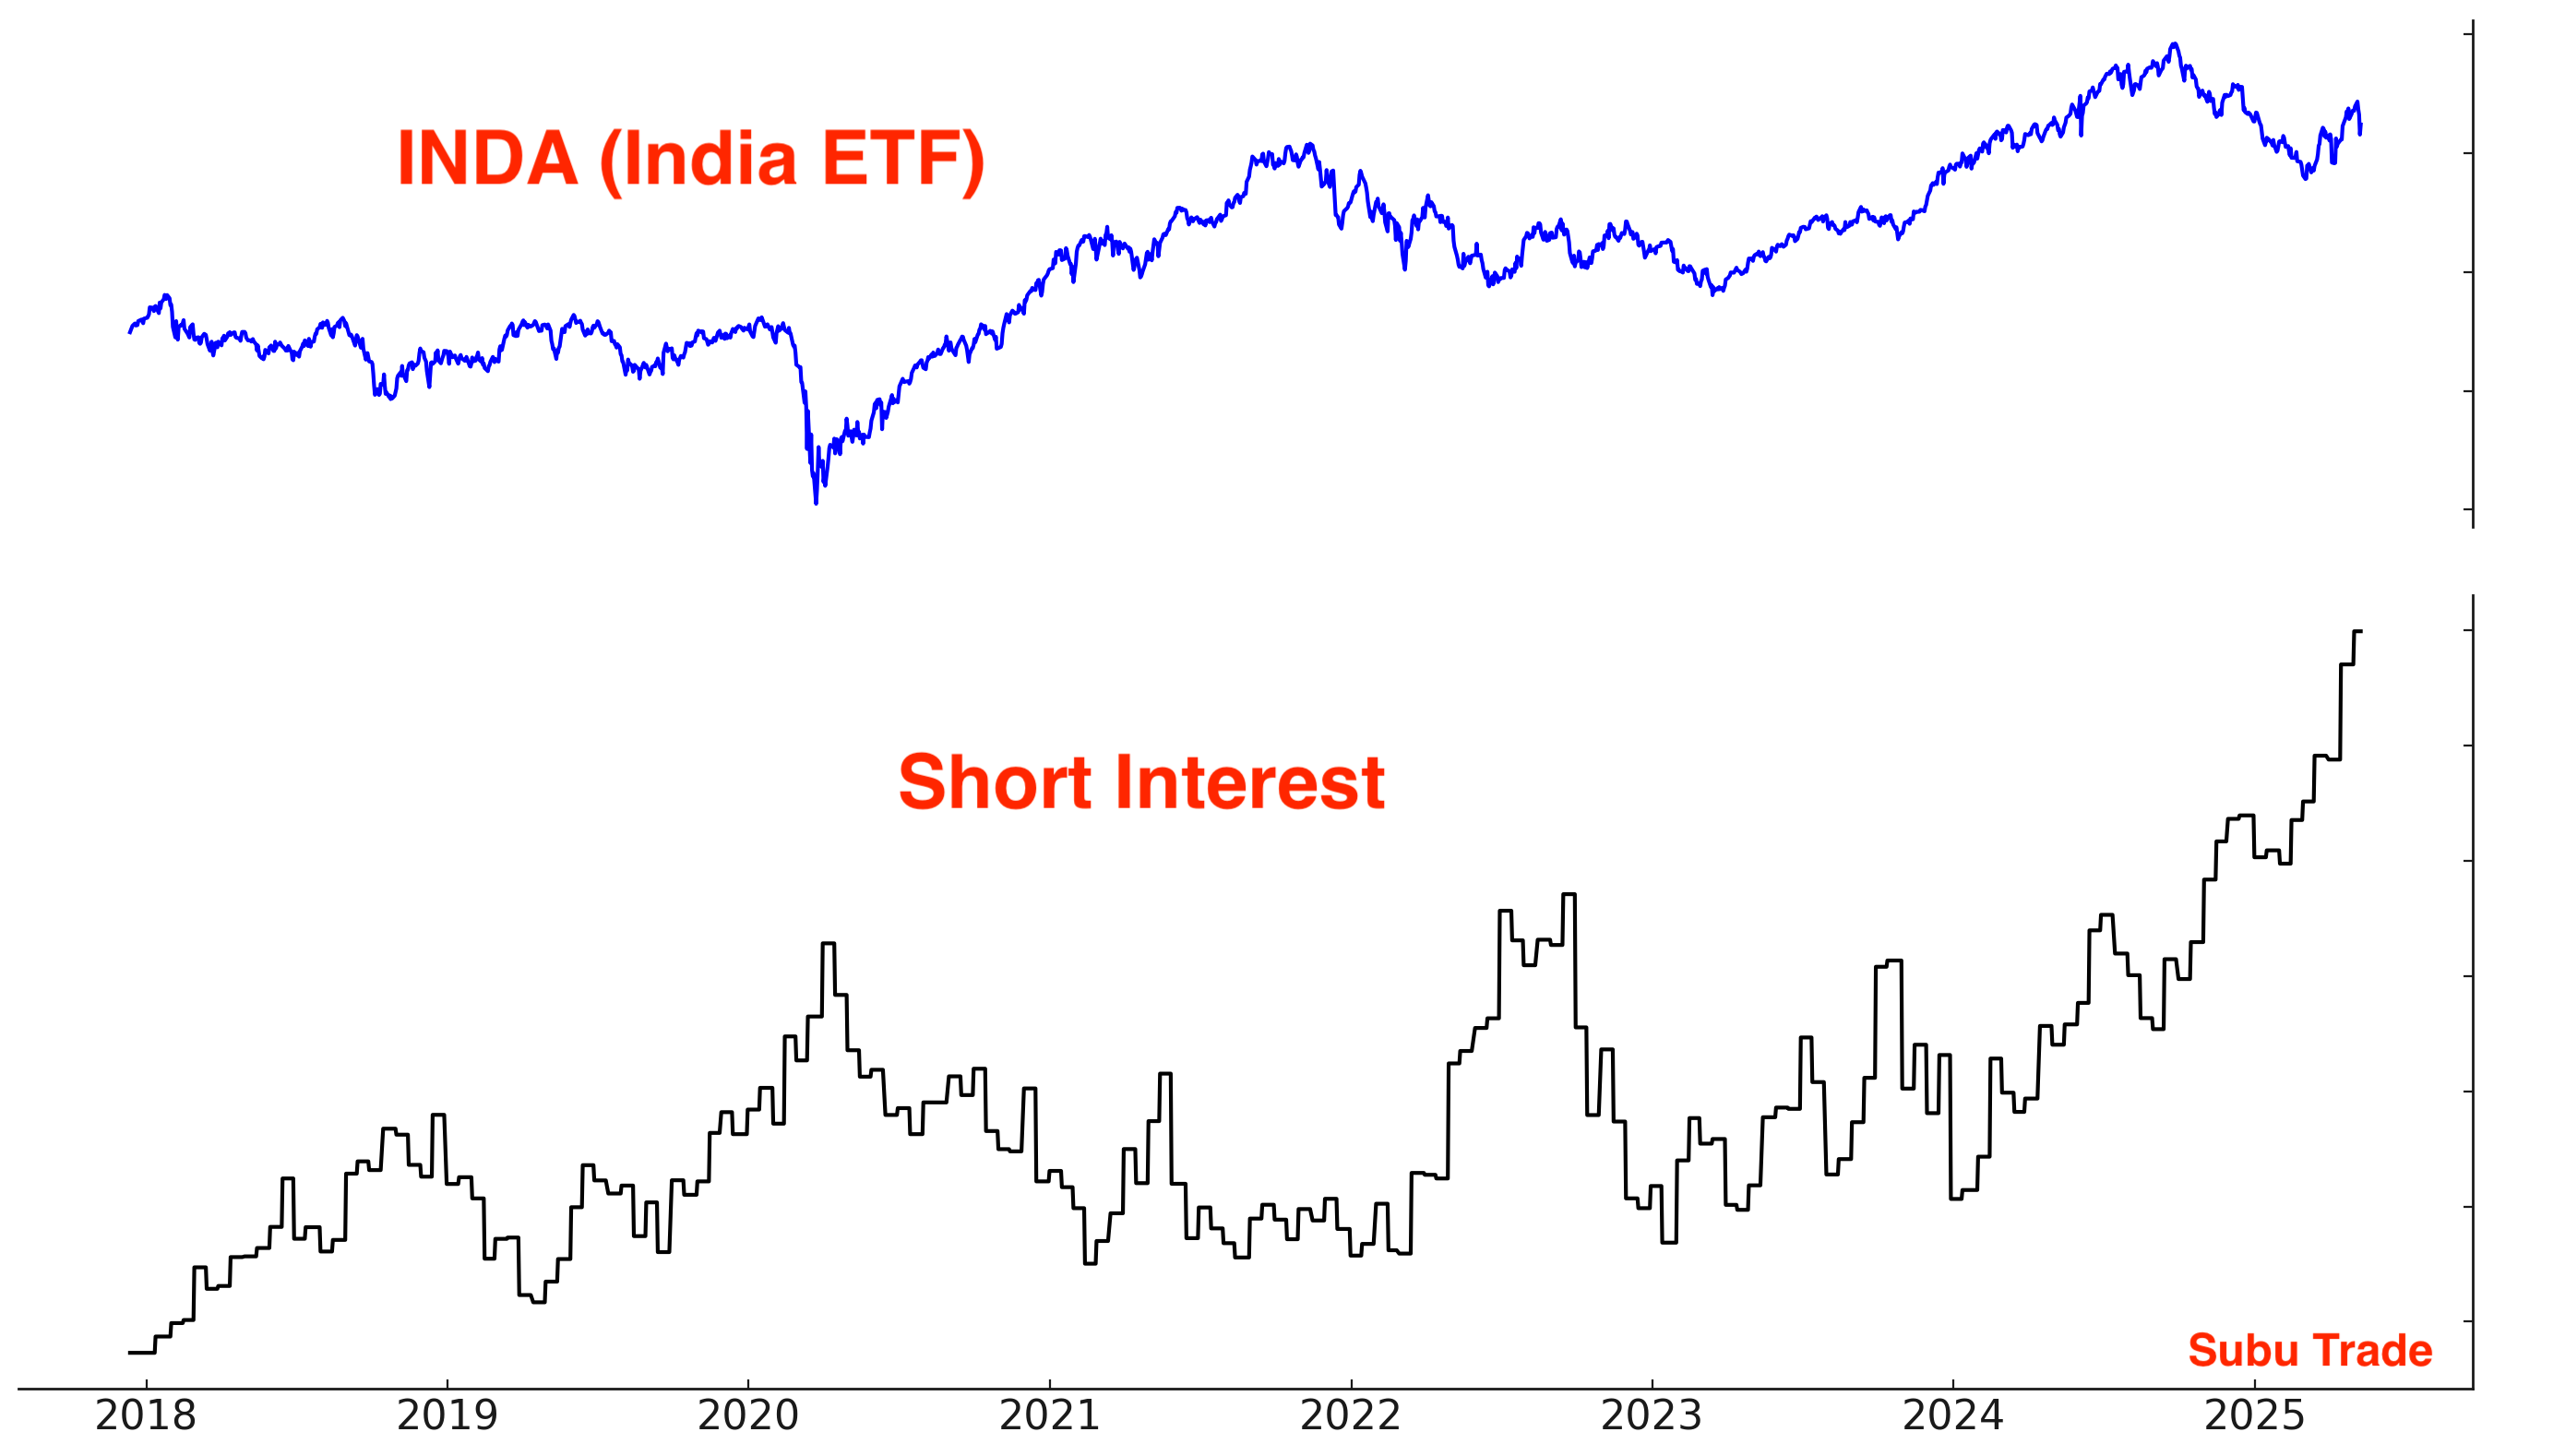
INDA short interest
Chinese Equities
The U.S. and China are currently engaged in trade negotiations. Should a deal materialize in the coming weeks, Chinese equities could see further upside. Overall, I don’t think it’s a great time to be trading Chinese stocks right now. There’s too much uncertainty, and good traders do not gamble on the news.
China Trend
Chinese stocks are trending higher:

China Fund Flows
Outflows from major China ETFs have stabilized:

I have no Chinese equities position.
Bonds
Themes/narrative
The bond market is being pulled by conflicting forces, making a sustained trend unlikely. The most probable outcome is continued choppy price action within a broad range.
On one hand, inflationary fears from tariffs could be bearish for bonds. However, this is not enough of a bearish factor that it would cause bonds to crash.
On the other hand, both the U.S. Dollar and U.S. Treasuries are trying to mean-revert upwards after their recent crash.
The Fed is neither interested in rate cuts nor rate hikes right now. This is a neutral factor for bonds (neither bullish nor bearish).
Outside of short-term traders seeking a mean-reversion bounce, I believe the bond market is best avoided for now. Neither bulls nor bears have an edge here.
Trend
No real trend; bonds have been swinging sideways within a wide range since late-2022:

Sentiment
Sentiment remains in neutral territory:

I hold a small long position in bonds, but the position size is small and has little impact on my portfolio’s performance.
Currencies
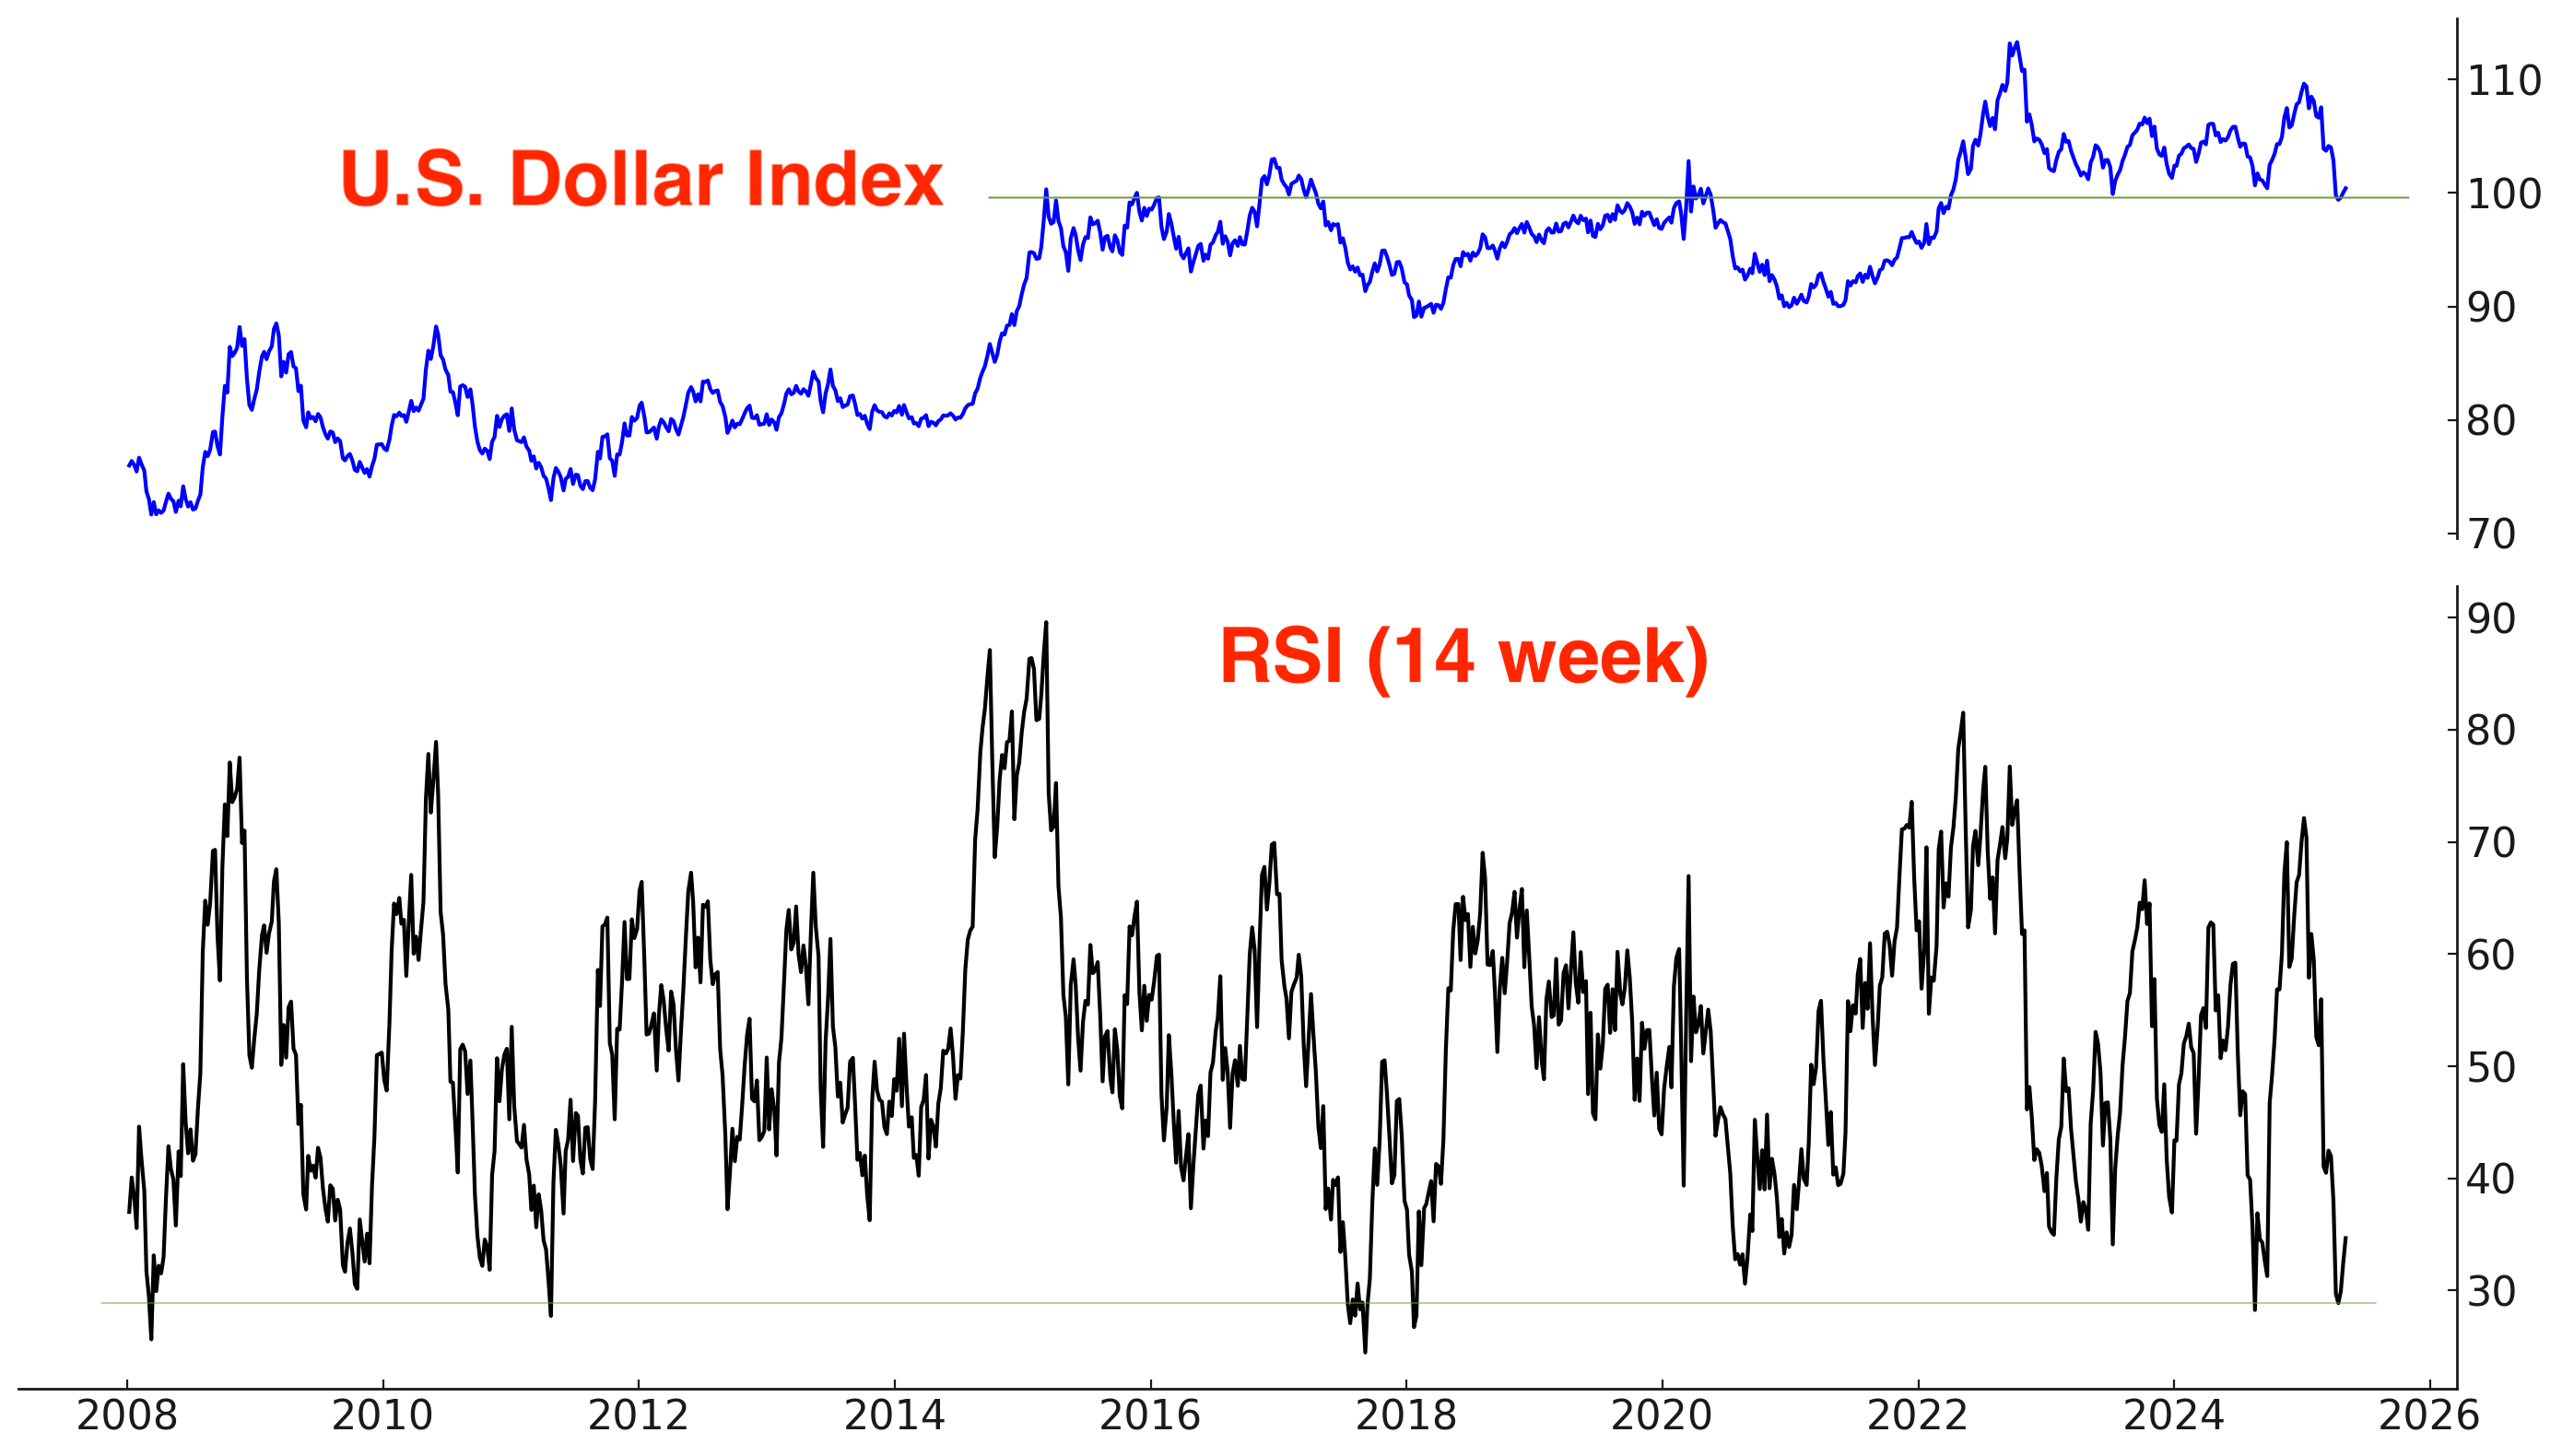
The U.S. Dollar stabilized and is attempting to bounce:
COT Report
The latest COT Report demonstrates that Asset Managers are short the U.S. Dollar. What’s remarkable about this positioning is that they’ve never been right before!
A mean-reversion rally for the U.S. Dollar is highly probable:

Trend
After trending down from January-April, the U.S. Dollar is trying to turn up:

Sentiment
Sentiment is coming up from “pessimistic” territory:

I do not have a currencies position, but I believe that the U.S. Dollar will bounce here.
Summary & My Portfolio
Mean-Reversion Position – Long Oversold Tech Stocks: Currently my largest position. Sold 1/4 of my position the prior week, kept the remaining 3/4 position. Mean-reversion rally already occurred, now comes the hard part.
*A rally in stocks could also push Bitcoin higher.
No position in Gold. Gold could correct/consolidate for weeks/months to work off the recent excess.
Mean-Reversion Position (Non-Core): long energy stocks. Small position size, will increase position size if energy stocks fall.
Mean-Reversion Position (Non-Core) - Long Indian Equities: Big beneficiary of U.S.-China trade war. Small position size. Temporarily hurt by India-Pakistan conflict.
Mean-Reversion Position (Non-Core) – Long U.S. Treasury Bonds: Small position size.
This content is for informational purposes only and is not financial or investment advice. I am not a licensed financial advisor. Trading involves risk, and past performance does not guarantee future results. You are responsible for your own financial decisions, and I am not liable for any losses.
Another awesome subu writeup. Always look forward to them. Thank you.
Good job!