
Markets Report: the non-stop U.S. correction
U.S. equities have fallen 4 weeks in a row while other markets rallied higher.

The U.S. stock market has fallen 4 weeks in a row, diverging notably from the strength observed in other markets such as Chinese equities and gold. Market sentiment is predominantly driven by developments surrounding tariffs and trade policy.

My Portfolio & Market Outlook
*Click here if you don’t understand how I trade
Mean-Reversion Position (Non-Core) – Long Oversold Tech Stocks:
Currently at 40% of the potential max size. Will scale into the position if the market falls more. Targeting AT LEAST a short-term bounce over the next few days/weeks.Black Swan Position – Long Chinese Equities: long with a trailing stop. INCREASED position size.
Core Position – Long Gold and Silver: long with a trailing stop. INCREASED position size.
Mean-Reversion Position (Non-Core) - Long Indian Equities: Extremely oversold, looking for at least a mean-reversion rally.
Mean-Reversion Position (Non-Core) – Long U.S. Treasury Bonds: Small position size.
In today’s highly volatile market where geopolitical headlines unfold rapidly, traders must focus on Risk:Reward and position size management to account for various scenarios and their respective probabilities.
U.S. Equities
The U.S. stock market has declined significantly and is due for at least a short-term oversold bounce.
It remains to be seen whether this downturn signals the start of a bear market or is merely a bull market correction. Observing the strength of the anticipated rebound will provide greater clarity. Until then, there are easier trading opportunities in other markets.
If the market “should” bounce here, why have I scaled in? Why not go all-in, max long right now?
Extreme oversold conditions can always become more oversold, and rare events, such as the October 1987 crash, underscore the importance of cautious positioning in mean-reversion trades that have no stop-loss.
Now let's examine several key indicators that signal a potential market rebound.
Option Flows
The QQQ Options Flow Index has fallen significantly:
There has been a record breaking spike in HYG put volume. The last 2 spikes marked the exact bottom in High Yield bonds, which often move in-line with equities:
Traders are extremely bearish on small caps:

Here’s the S&P 500 combined Options Flow Index:
The SKEW Index has fallen significantly from its all-time high:
Sentiment surveys
AAII Bearish % is at 59.2%, marking the 3rd consecutive week in which it has remained above 55%. Historically, the only other time bearish sentiment has remained this elevated for 3 weeks in a row was March 4, 2009. That was the bottom of the 2007-2009 bear market:

This does not imply that current conditions mirror March 2009. History does not repeat exactly, and directly comparing today's environment to the bottom of a massive bear market would be inappropriate. However, this does illustrate that sentiment is extremely pessimistic, particularly for traders who held highly speculative stocks WITH LEVERAGE.
The latest Investors Intelligence survey aligns with the AAII data, showing a sharp decline in bullish sentiment:

It's important to note that the latest Investors Intelligence data reflects sentiment as of Friday March 7, prior to this week's market sell-off. Given the subsequent decline, it's reasonable to anticipate an even lower bullish reading in the upcoming report.
Here’s what happened next (historically) when Investors Intelligence Bulls was this low:

We can further filter for historical cases in which Bullish sentiment collapsed in 1 week:


The NAAIM Exposure Index diverges notably from the AAII and Investors Intelligence surveys, reflecting a less extreme level of pessimism:

Other sentiment indicators
Here’s the S&P 500’s Daily Sentiment Index:
Here’s the VIX Daily Sentiment Index:

Here’s CNN Fear & Greed:
Overall, sentiment is quite pessimistic, which is not surprising considering that the U.S. stock market has fallen non-stop.
Fund Flows
One of the most interesting ETF flows to look at is TQQQ. Most people assume that ETF Fund Flows represent dumb money: you should be bearish when there are large inflows and bullish when there are large outflows.
Things are not that simple.
The past few weeks have seen massive inflows into TQQQ, which is the 3x leveraged NASDAQ ETF.
TQQQ traders tend to be contrarian: they buy when stocks crash (inflows) and sell when markets rally (outflows). And right now, these contrarian traders are buying hand-over-fist in anticipation of a rally:

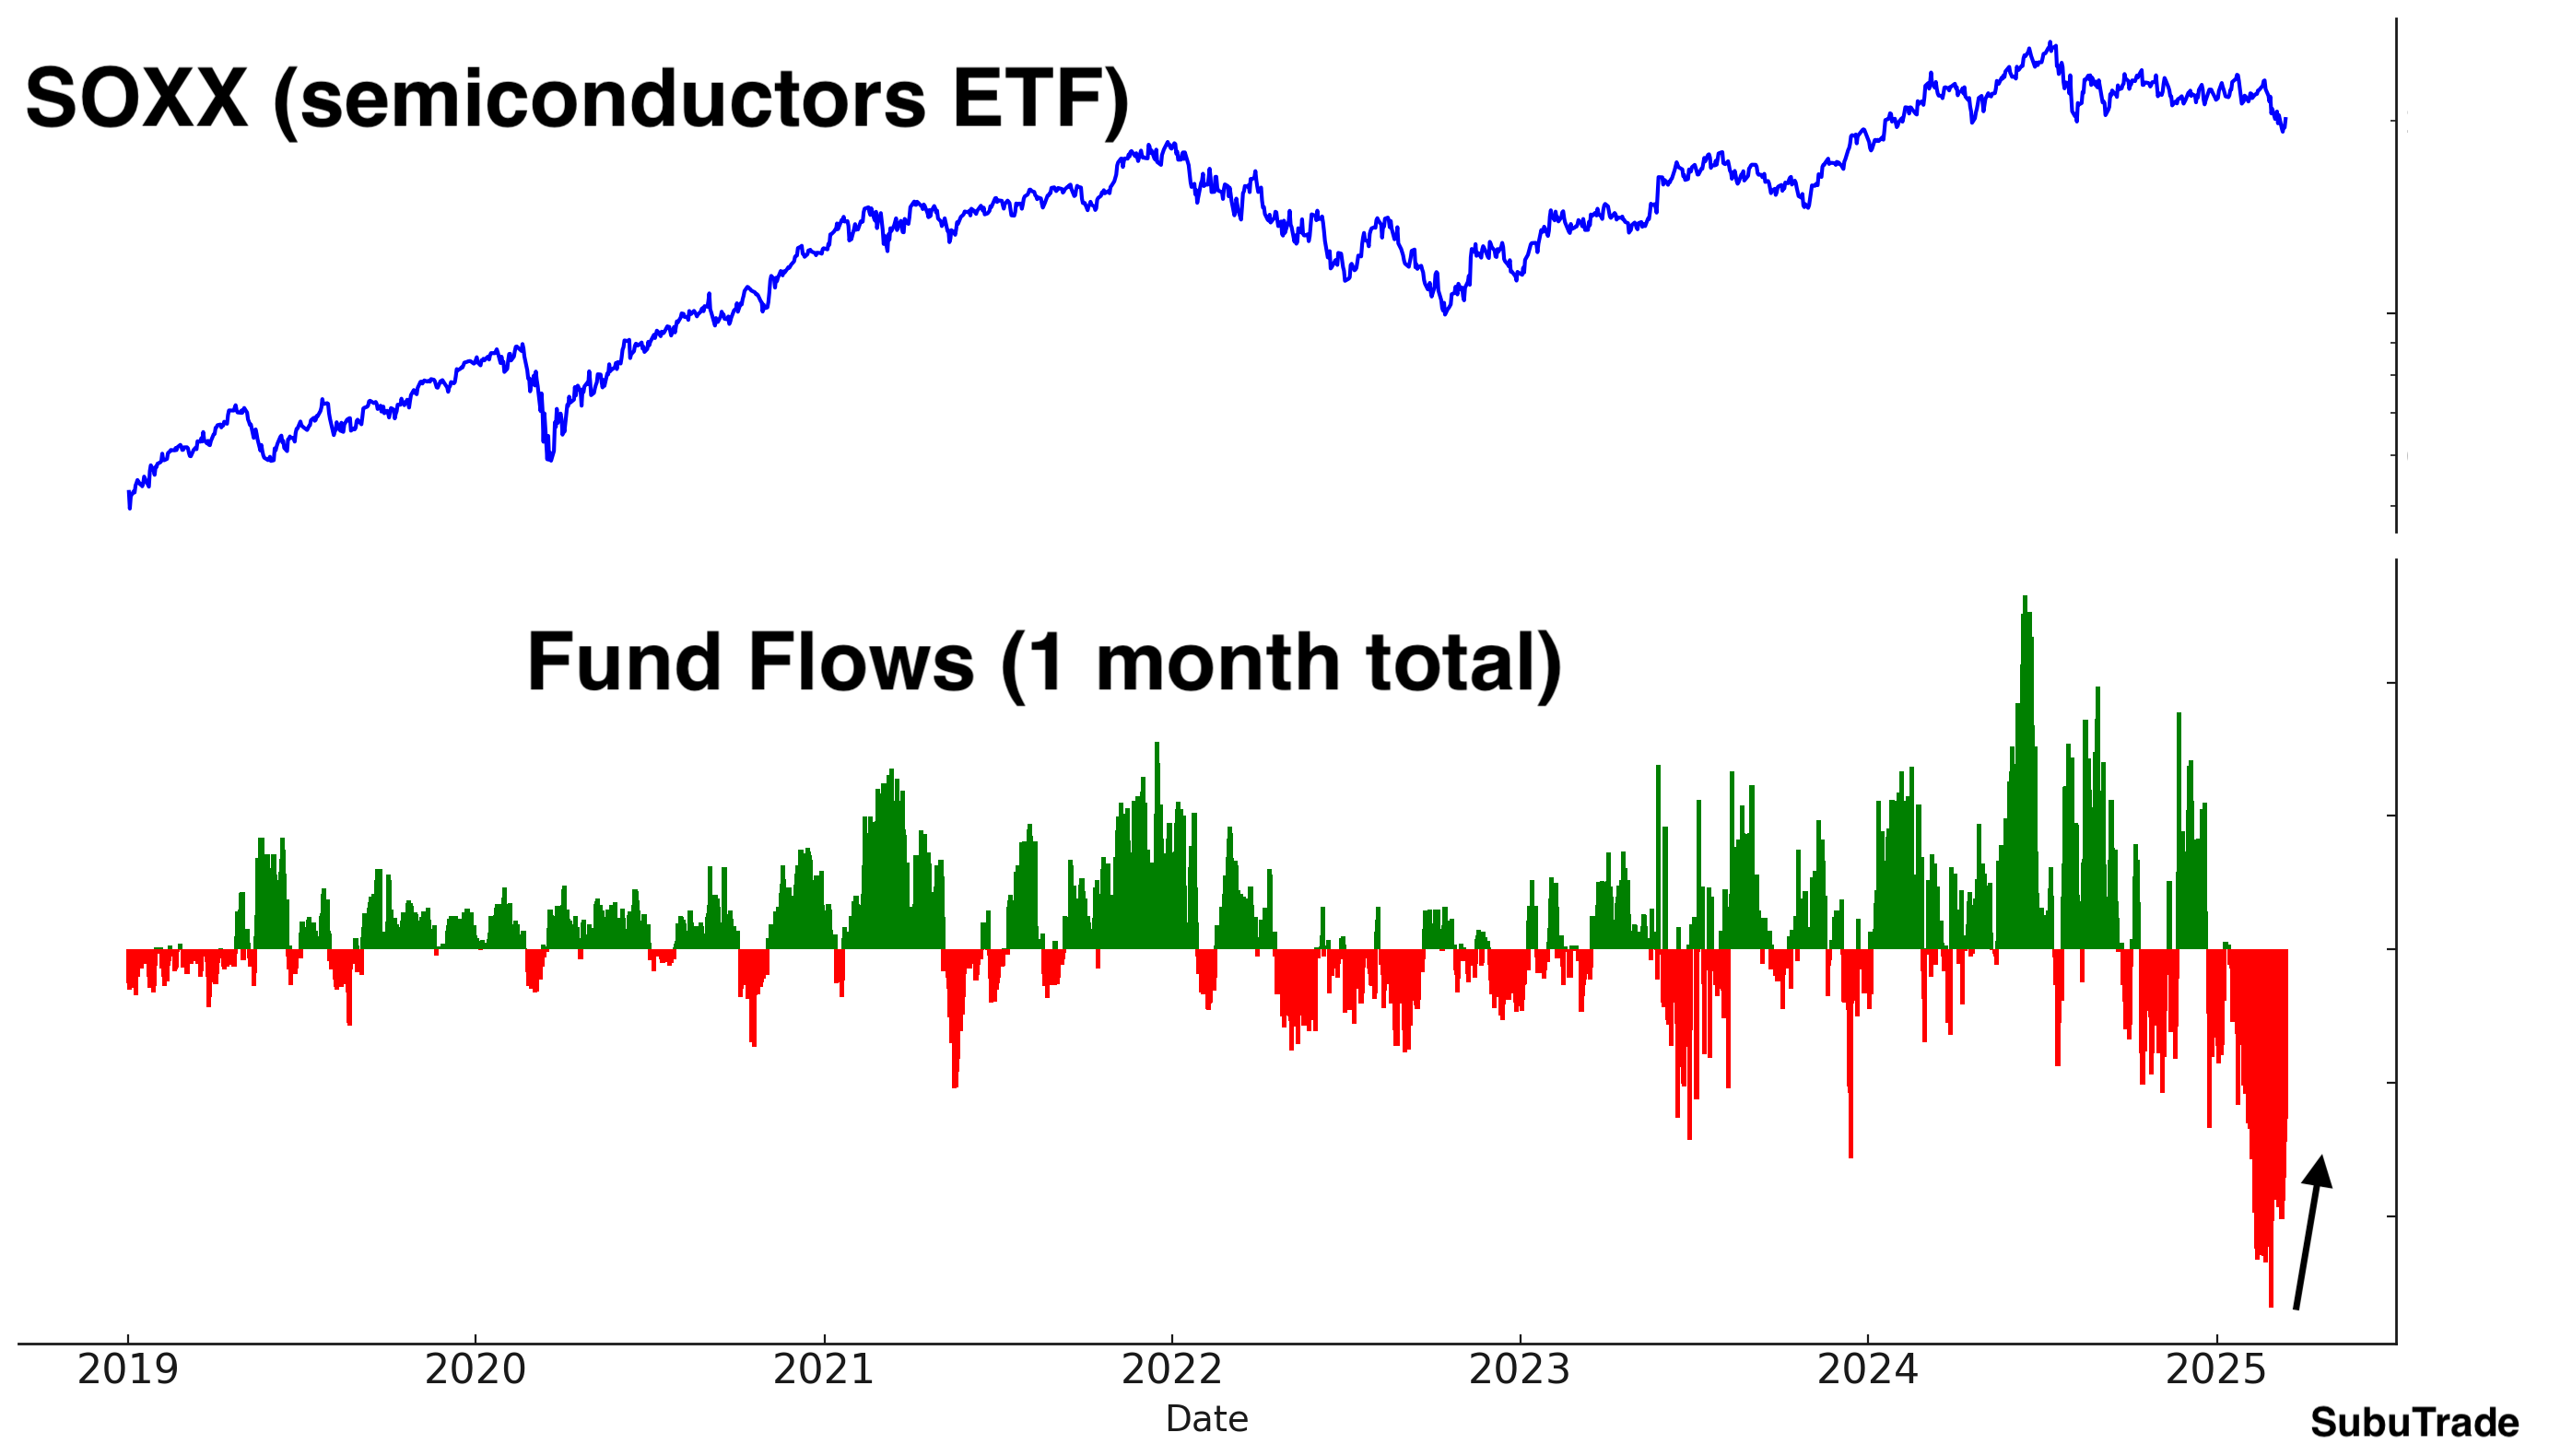
Meanwhile, flows into semiconductors are starting to stabilize. Semiconductors have been one of the worst hit sectors after driving the 2023-2024 rally:
Volatility
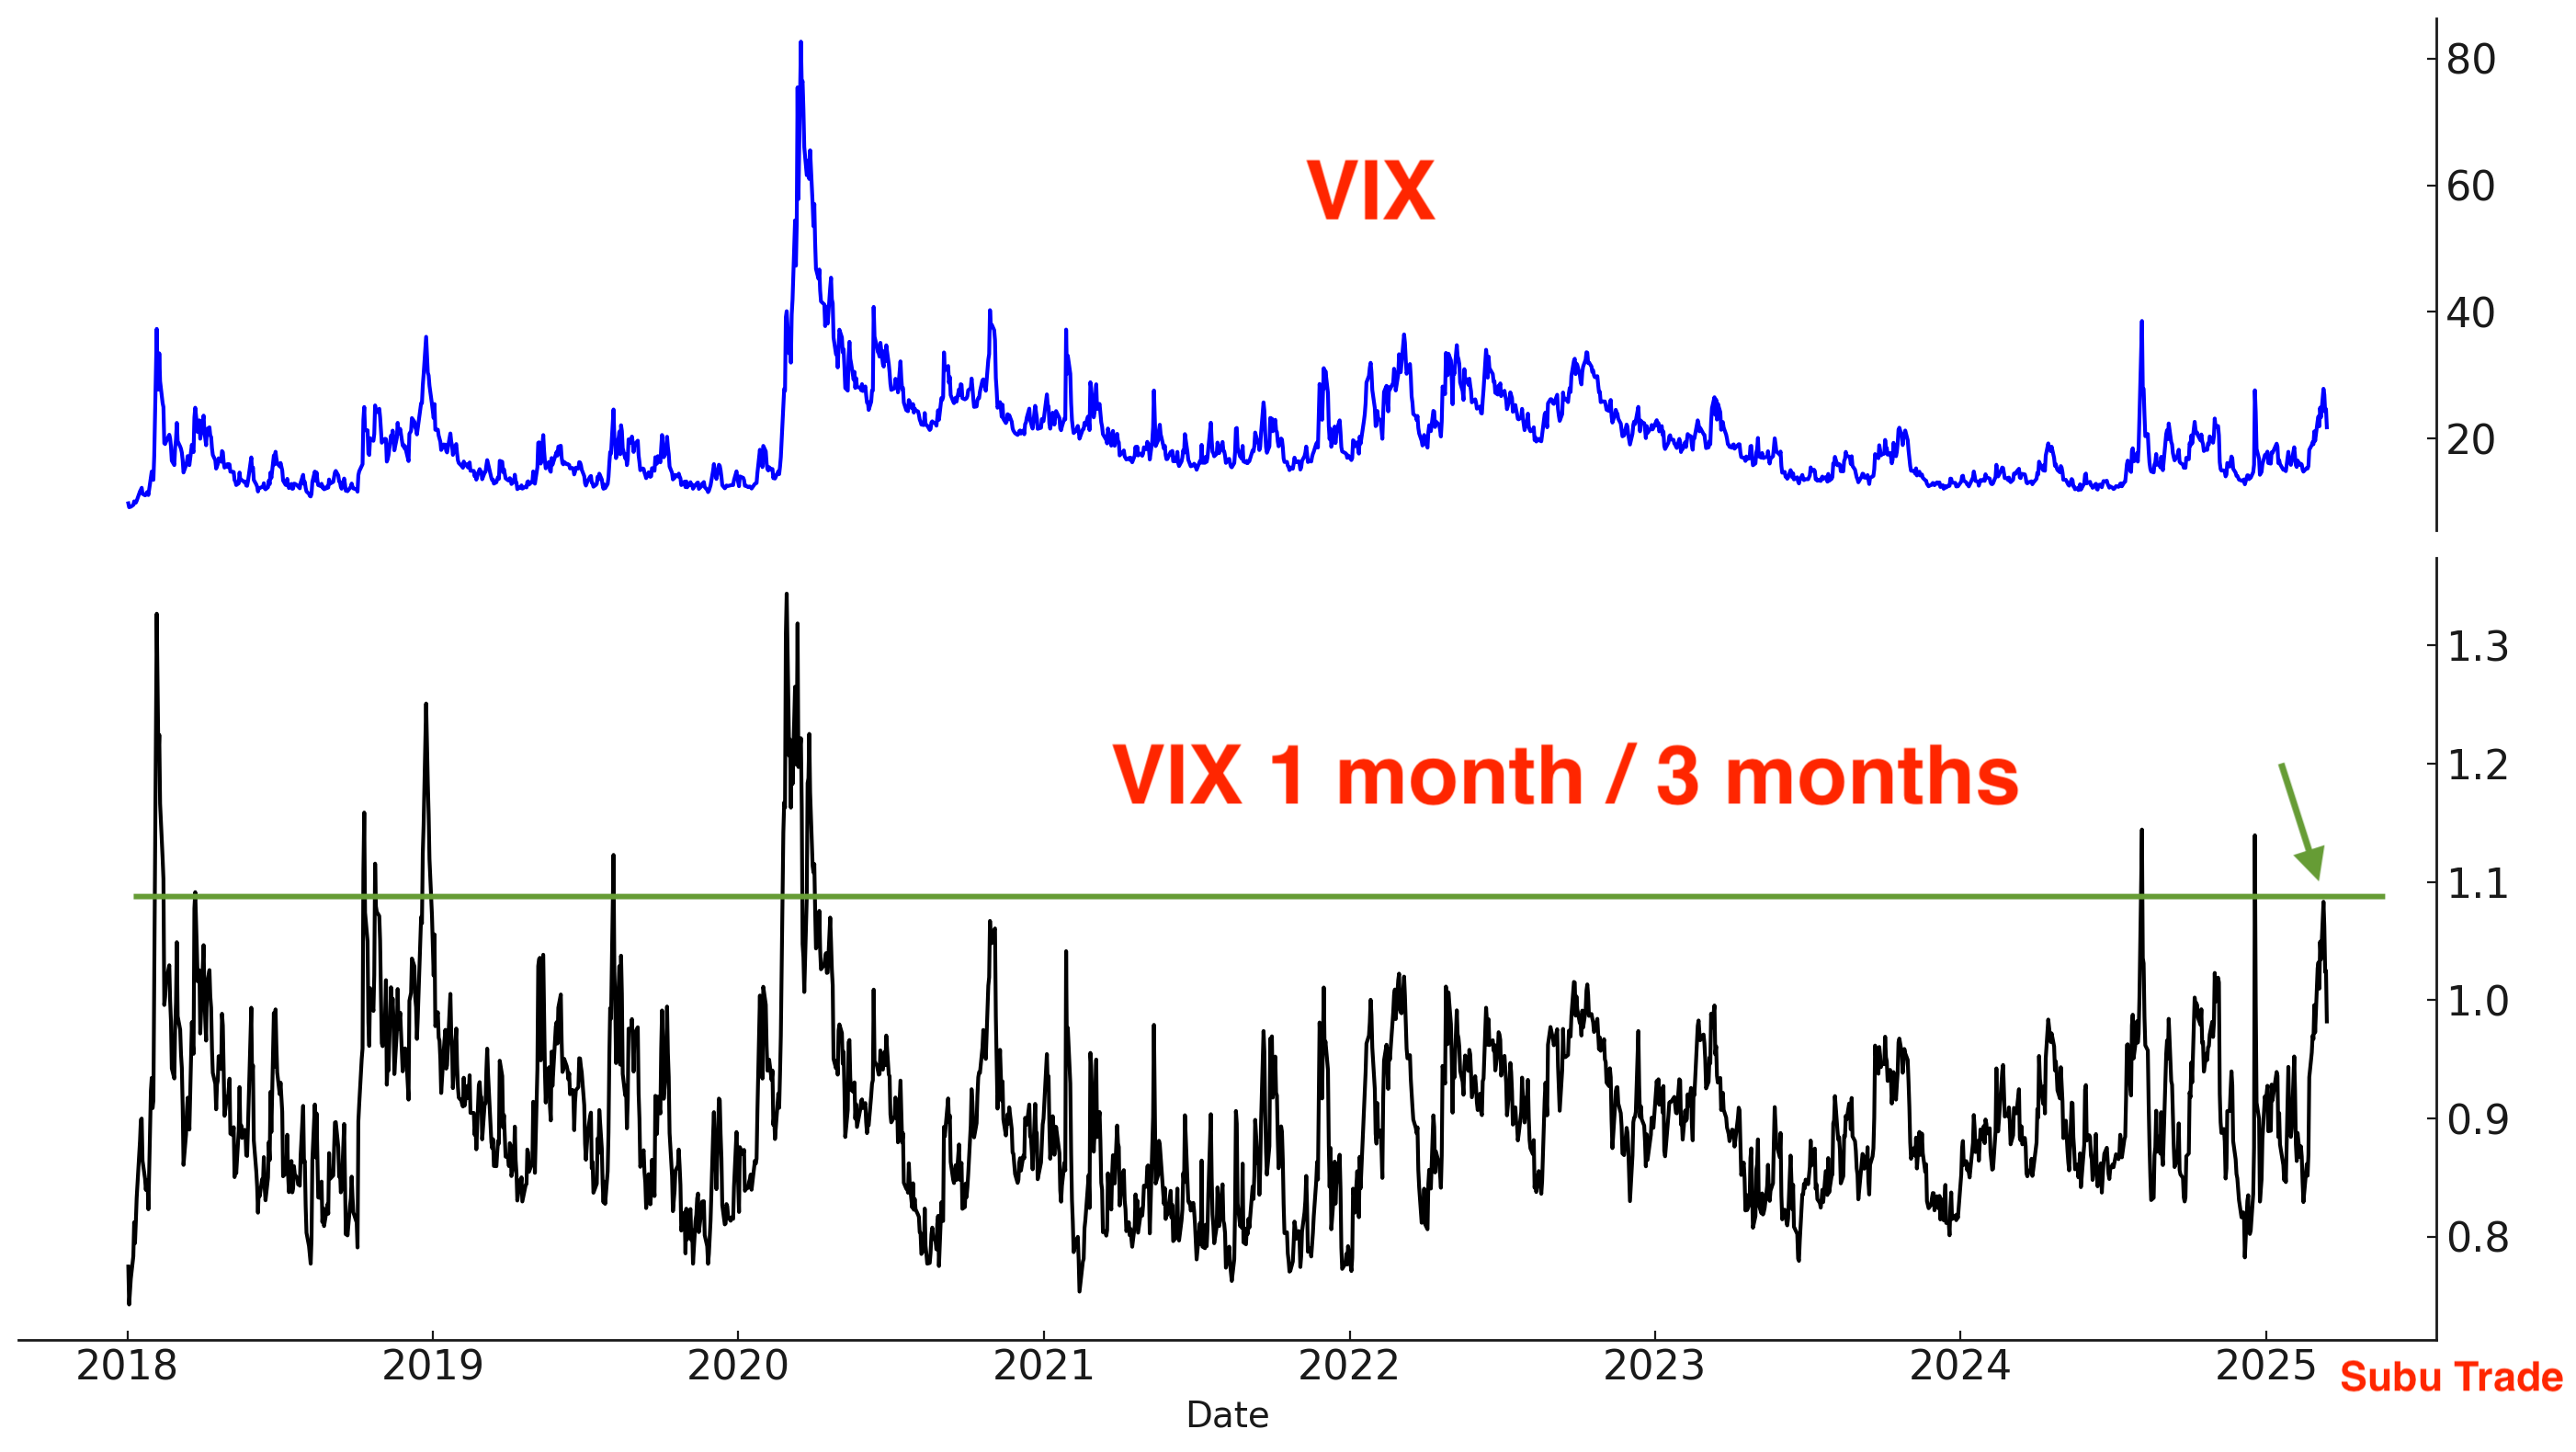
Here’s VIX 1 month / 3 months. Previous spikes marked VIX tops:
Corporate Insiders
To be clear, I am looking for a mean-reversion rally. This is not a “once in a generation buying opportunity”.
While insider buys have increased a little, insider sales have not fallen significantly. Hence there has been no spike in the Insider Buy/Sell Ratio. Historically, massive stock market bottoms coincided with large spikes in the Insider Buy/Sell Ratio:

Breadth
This week saw an increase in the % of stocks that are oversold:
Here are the % of S&P 500 stocks above their 200 and 50 day moving averages:
Trend and momentum
The U.S. stock market is no longer in an uptrend:
Why does this matter? Because from a trend following perspective, it is far better to buy when the stock market is trending higher than when it’s not:
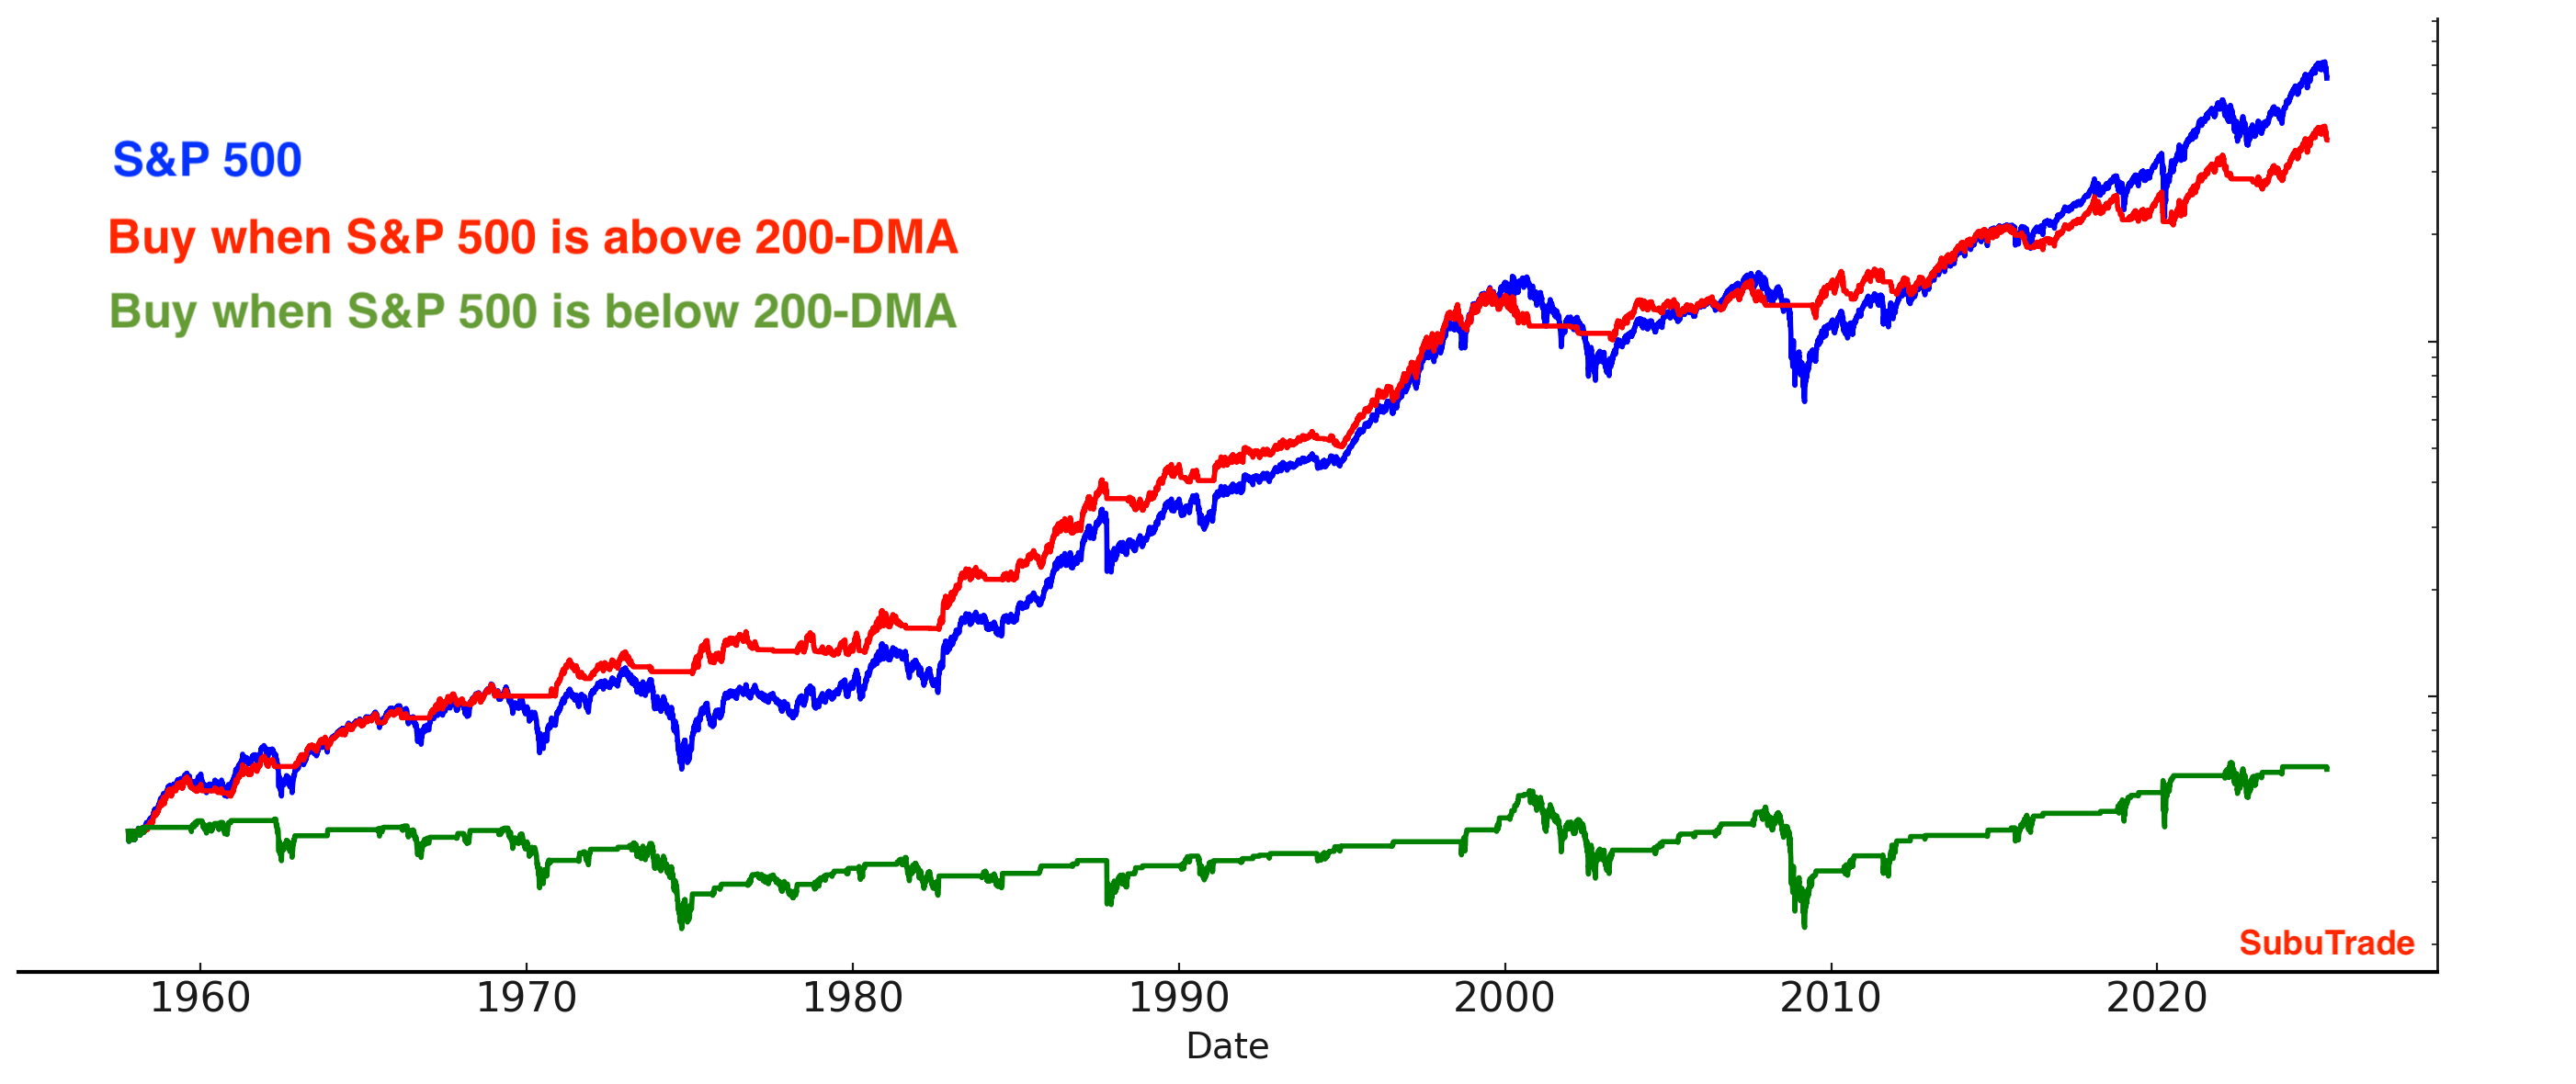
Although the stock market is not currently trending upward, conditions still support the potential for at least a short-term bounce.
Small caps are down 7 weeks in a row:
High Beta stocks are no longer underperforming Low Volatility stocks:

Overall, I expect 2025 to be characterized by significant Up and Down volatility without a clear long term trend for U.S. equities. While these conditions favor short-term and day traders, they are less ideal for traders with longer time frames. Consequently, my focus remains on alternative markets that better align with my trading strategy.
One final note with regards to U.S. equities. Here’s Google Trends for the word “recession”. This matches the huge spike in U.S. economic policy uncertainty which I illustrated at the start of this Markets Report. We shall see whether such fear is warranted or not:

Chinese Equities
After years of underperformance, Chinese tech stocks have delivered strong gains so far this year, significantly outperforming U.S. equities. Based on conventional mean-reversion metrics, the current rally is over-extended, suggesting a downwards reversal.
However, I believe there is a possibility that this is just the first leg of a larger rally in Chinese equities. As I wrote last week:
The Chinese stock market does not follow the same technical patterns as U.S. markets. Culturally, China has a strong gambling mindset, and domestic investors tend to be momentum-driven, aggressively piling in as prices rise. Ultimately, it is local investors, rather than foreign capital, that will dictate the trajectory of a large stock market like that of the U.S. or China.
This explains why Chinese equities periodically experience sharp, parabolic rallies (see 2015).
Historically, Chinese investors have not prioritized equities, with the majority of their wealth concentrated in real estate. Chinese equity ownership is much lower than U.S. equity ownership. However, with the property market under pressure and interest rates at low levels, domestic investors are increasingly seeking alternative investment opportunities. As a result, a substantial pool of Chinese savings is awaiting deployment into other asset classes such as Chinese equities and gold.
If Chinese policymakers successfully create market momentum, a wave of Chinese retail investors (momentum chasers) could chase the rally and push prices higher. At present, the Chinese government is actively promoting a transition toward a stronger equity investment culture.
China’s recent price action is bullish. Chinese equities have not been dragged down by the U.S. stock market. In the past, a U.S. stock market decline would drag down other markets as well.
For now, focus on the trend in Chinese equities, which remains UP:
KWEB Call Volume - Put Volume is starting to come down:
KWEB’s inflows have come down. Foreigners are taking profits and selling Chinese equities, while Chinese investors are aggressively buying the dip:

As David Ingles from Bloomberg noted, mainland Chinese investors are aggressively buying every dip:

Meanwhile, FXI short interest remains extremely high:

I would like to reiterate that while mean reversion metrics suggest that a pullback is likely, Chinese equities may continue to rally higher. This is not a certainty, hence bullish traders should have a stop loss in case the market reverses lower.
India
Indian stocks have fallen significantly in recent months. But while U.S. equities made new lows this week, India did not:
Indian equities appear to be stabilizing, while the Indian government is working towards a trade deal with the Trump administration:

Steve Schwarzman from Blackstone said this about China and India:
“India became top of mind for the business community as an alternative [to China]. It’s got sort of low-cost labor, smart people. It’s got some challenges with logistics in the internal infrastructure compared to China. But there is a sort of curiosity about India now. You must look at it if you’re a corporate executive that’s manufacturing offshore. And so, it should work out quite well for India.”
The big winner of the U.S.-China economic war will be India. If the U.S. wants a China-free supply chain, only India has the population size to accomplish that.
Meanwhile, India outflows are starting to stabilize:

From a trading perspective, I am long India for a mean-reversion trade.
From a long term perspective, I am not bullish on China. This is the Indian Century.
Precious Metals
Gold made new all-time highs this week, crossing the $3000 threshold. Gold is in a solid Uptrend:
Gold’s Daily Sentiment Index and its 1 month moving average remain elevated. This is no surprise, since sentiment and price typically move together:
GLD’s Call-Put $ Value has come down a little:

SLV short interest remains extremely high:

I remain bullish on precious metals.
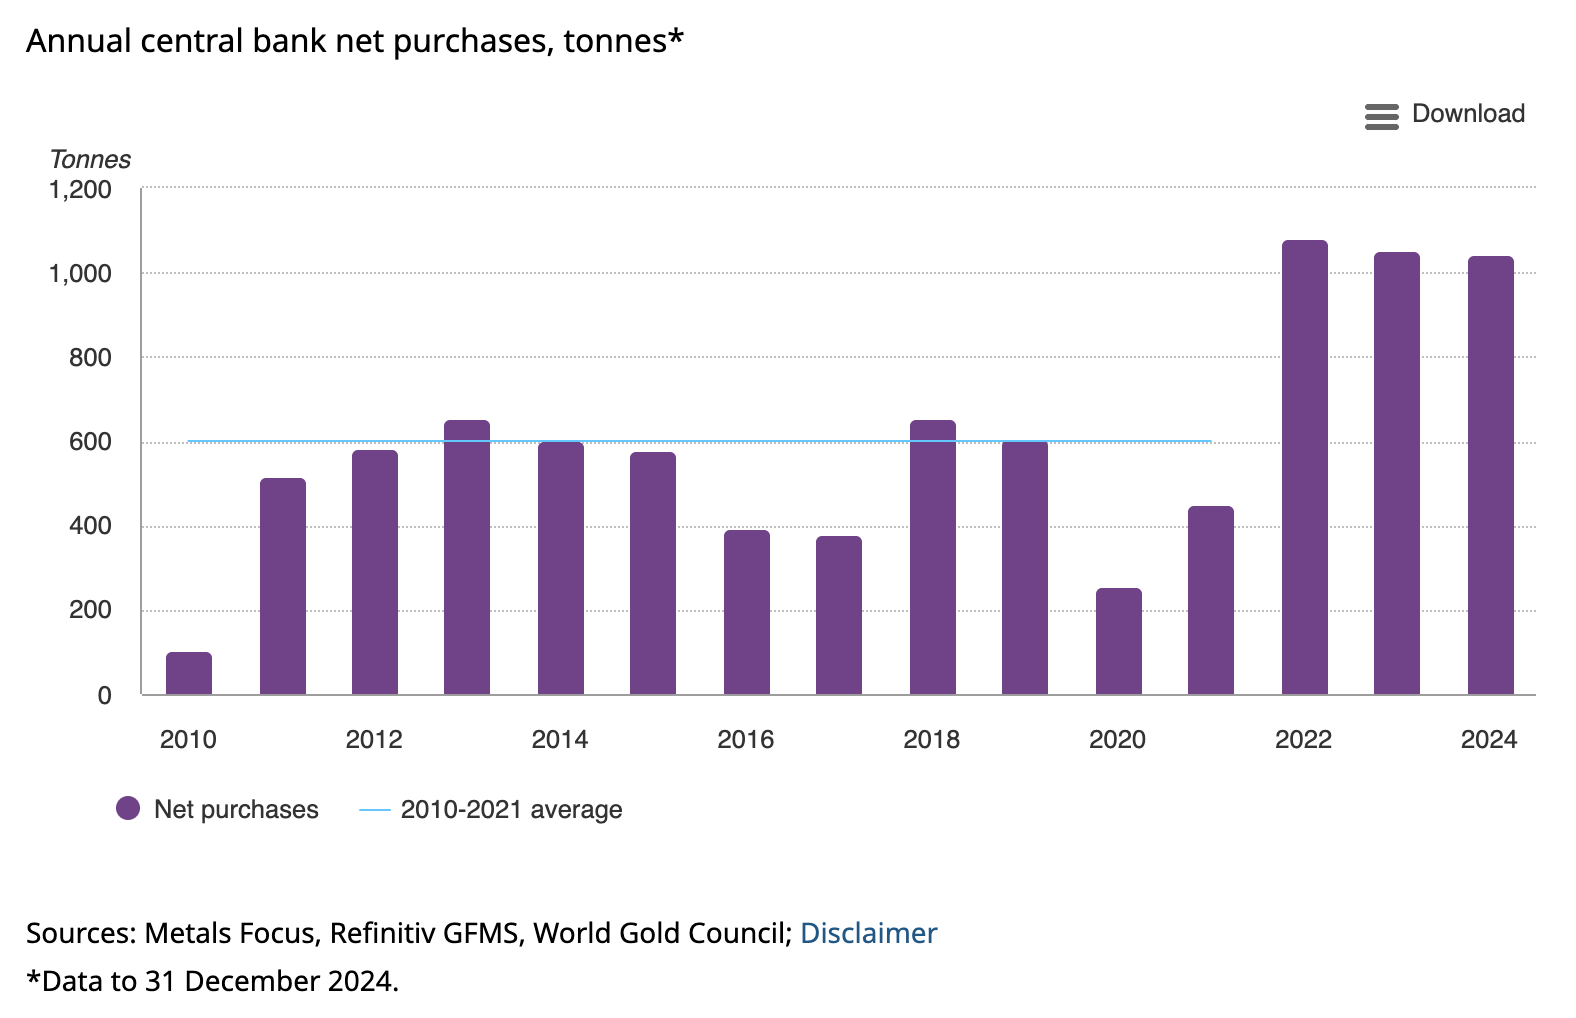
The bullish narrative/theme for gold remains and price (the trend) reflects that. Global central banks are buying gold because they fear holding U.S. Treasuries that could be confiscated in the middle of a geo-political conflict (e.g. U.S.-China economic war). As the US. ratchets up trade pressure on allies and foes, expect the demand for gold to increase. Here are the annual purchases of gold by central banks:
Bonds
Currently, I hold no strong conviction toward bonds.
Know what you know, and more importantly, know what you DON’T know. Too many people have a strong opinion on everything.
Overall, I expect bonds to swing within a range in 2025. I do not expect a strong trending environment.
However, a sustained economic slowdown could trigger a substantial rally in bonds. Thus, long bonds offers an asymmetric risk/reward trade:
If the economy does not continue to slow down, bonds may fall but not significantly.
If the economy does continue to slow down, bonds will rally significantly.
Here’s the 30 year’s Daily Sentiment Index and its 1 month moving average:
Interestingly, TLT call - put volume soared, while TLT short interest is also near an all-time high:
Here’s TLT short interest:

Currencies
The U.S. Dollar is trending downwards:

Here’s the U.S. Dollar’s sentiment and its 1 month moving average:

I do not have a currencies position.
My Portfolio
Mean-Reversion Position (Non-Core) – Long Oversold Tech Stocks:
Will scale into the position if the market falls more. Targeting AT LEAST a short-term bounce over the next few days/weeks.Black Swan Position – Long Chinese Equities: long with a trailing stop. INCREASED position size to account for the possibility that Chinese stocks may rally higher (see 2015 bubble).
Core Position – Long Gold and Silver: long with a trailing stop. INCREASED position size.
Mean-Reversion Position (Non-Core) - Long Indian Equities: was extremely oversold, now stabilizing. Looking for at least a mean-reversion rally.
Mean-Reversion Position (Non-Core) – Long U.S. Treasury Bonds: Small position size. Given the potential for further economic slowdown, bonds may see more upside.
This content is for informational purposes only and is not financial or investment advice. I am not a licensed financial advisor. Trading involves risk, and past performance does not guarantee future results. You are responsible for your own financial decisions, and I am not liable for any losses.
Thanks for another insightful note. How do you track fund inflows and outflows?
TQQQ flows off the charts to the upside and Semiconductors flows almost a mirror image. Has to mean something.