
Markets Report: trading plan during this mini-crash
Certain sectors of the U.S. stock market have collapsed, creating the setup for a mean-reversion trade.

From top to bottom the S&P 500 fell -7.8%, the NASDAQ 100 fell -11.2%, the Russell 2000 fell -17.5%, and the Magnificent 7 fell -18.3%. Putting this decline into perspective:

In today’s highly volatile market where geopolitical headlines unfold rapidly throughout the day, traders must focus on Risk:Reward and position size management to account for various scenarios and their respective probabilities.
My Portfolio & Market Outlook
*Click here if you don’t understand how I trade
NEW Mean-Reversion Position (Non-Core) – Long Oversold Tech Stocks:
Initiated a long position in highly oversold tech stocks. As this is the first entry in a mean-reversion position, it is currently at one-third of the intended size. Will scale into the position 2 more times if the market falls more. Targeting AT LEAST a short-term bounce over the next few days/weeks.Core Position – Long Gold and Silver: Maintaining a small position with a trailing stop.
Mean-Reversion Position (Non-Core) – Long U.S. Treasury Bonds: Increased exposure to U.S. Treasury bonds this week. Given the potential for further economic slowdown, bonds may see more upside.
Mean-Reversion Position (Non-Core) - Long Indian Equities: Extremely oversold, looking for at least a mean-reversion rally.
Black Swan Position – Long Chinese Equities: Maintaining a small position with a trailing stop.
EXITED Core Position - Long U.S. Equities: I had a significantly underweight allocation to U.S. equity ETFs the prior week. I fully exited this position this week. The U.S. stock market is no longer in an Up trend.
U.S. Equities
Over the past few months I highlighted the parallels between 2025 and 2015, a year in which the U.S. stock market traded sideways for months before a significant decline later in the year.
With the U.S. economy weakening amid ongoing trade wars, could this be the start of a bear market? I don’t know. But from a risk-reward perspective, certain sectors have fallen so much that even if this is a bear market, we can at least expect a bear market rally in these beaten down sectors.
The key to navigating this environment is disciplined position sizing—starting small and scaling in gradually if the market continues to fall.
While the S&P 500 fell -7.8%, certain sectors have suffered far greater losses. Notably, high-beta stocks fell sharply relative to low-volatility stocks. A prime example of this divergence is Nvidia's substantial selloff while Berkshire Hathaway made new all-time highs.

Option Flows
The past 2 weeks saw a jump in the $ value of SPY puts traded:
The S&P 500’s Options Flow Index (grey line) and its 10 day moving average (black line) have fallen significantly. This increases the odds of a short term rally:
Tech stocks have declined significantly, accompanied by a surge in the $ value of QQQ puts traded:
The QQQ Options Flow Index, which considers both the volume and $ value of puts/calls, continued to fall this week. This typically marked the end of pullbacks/corrections in this bull market:
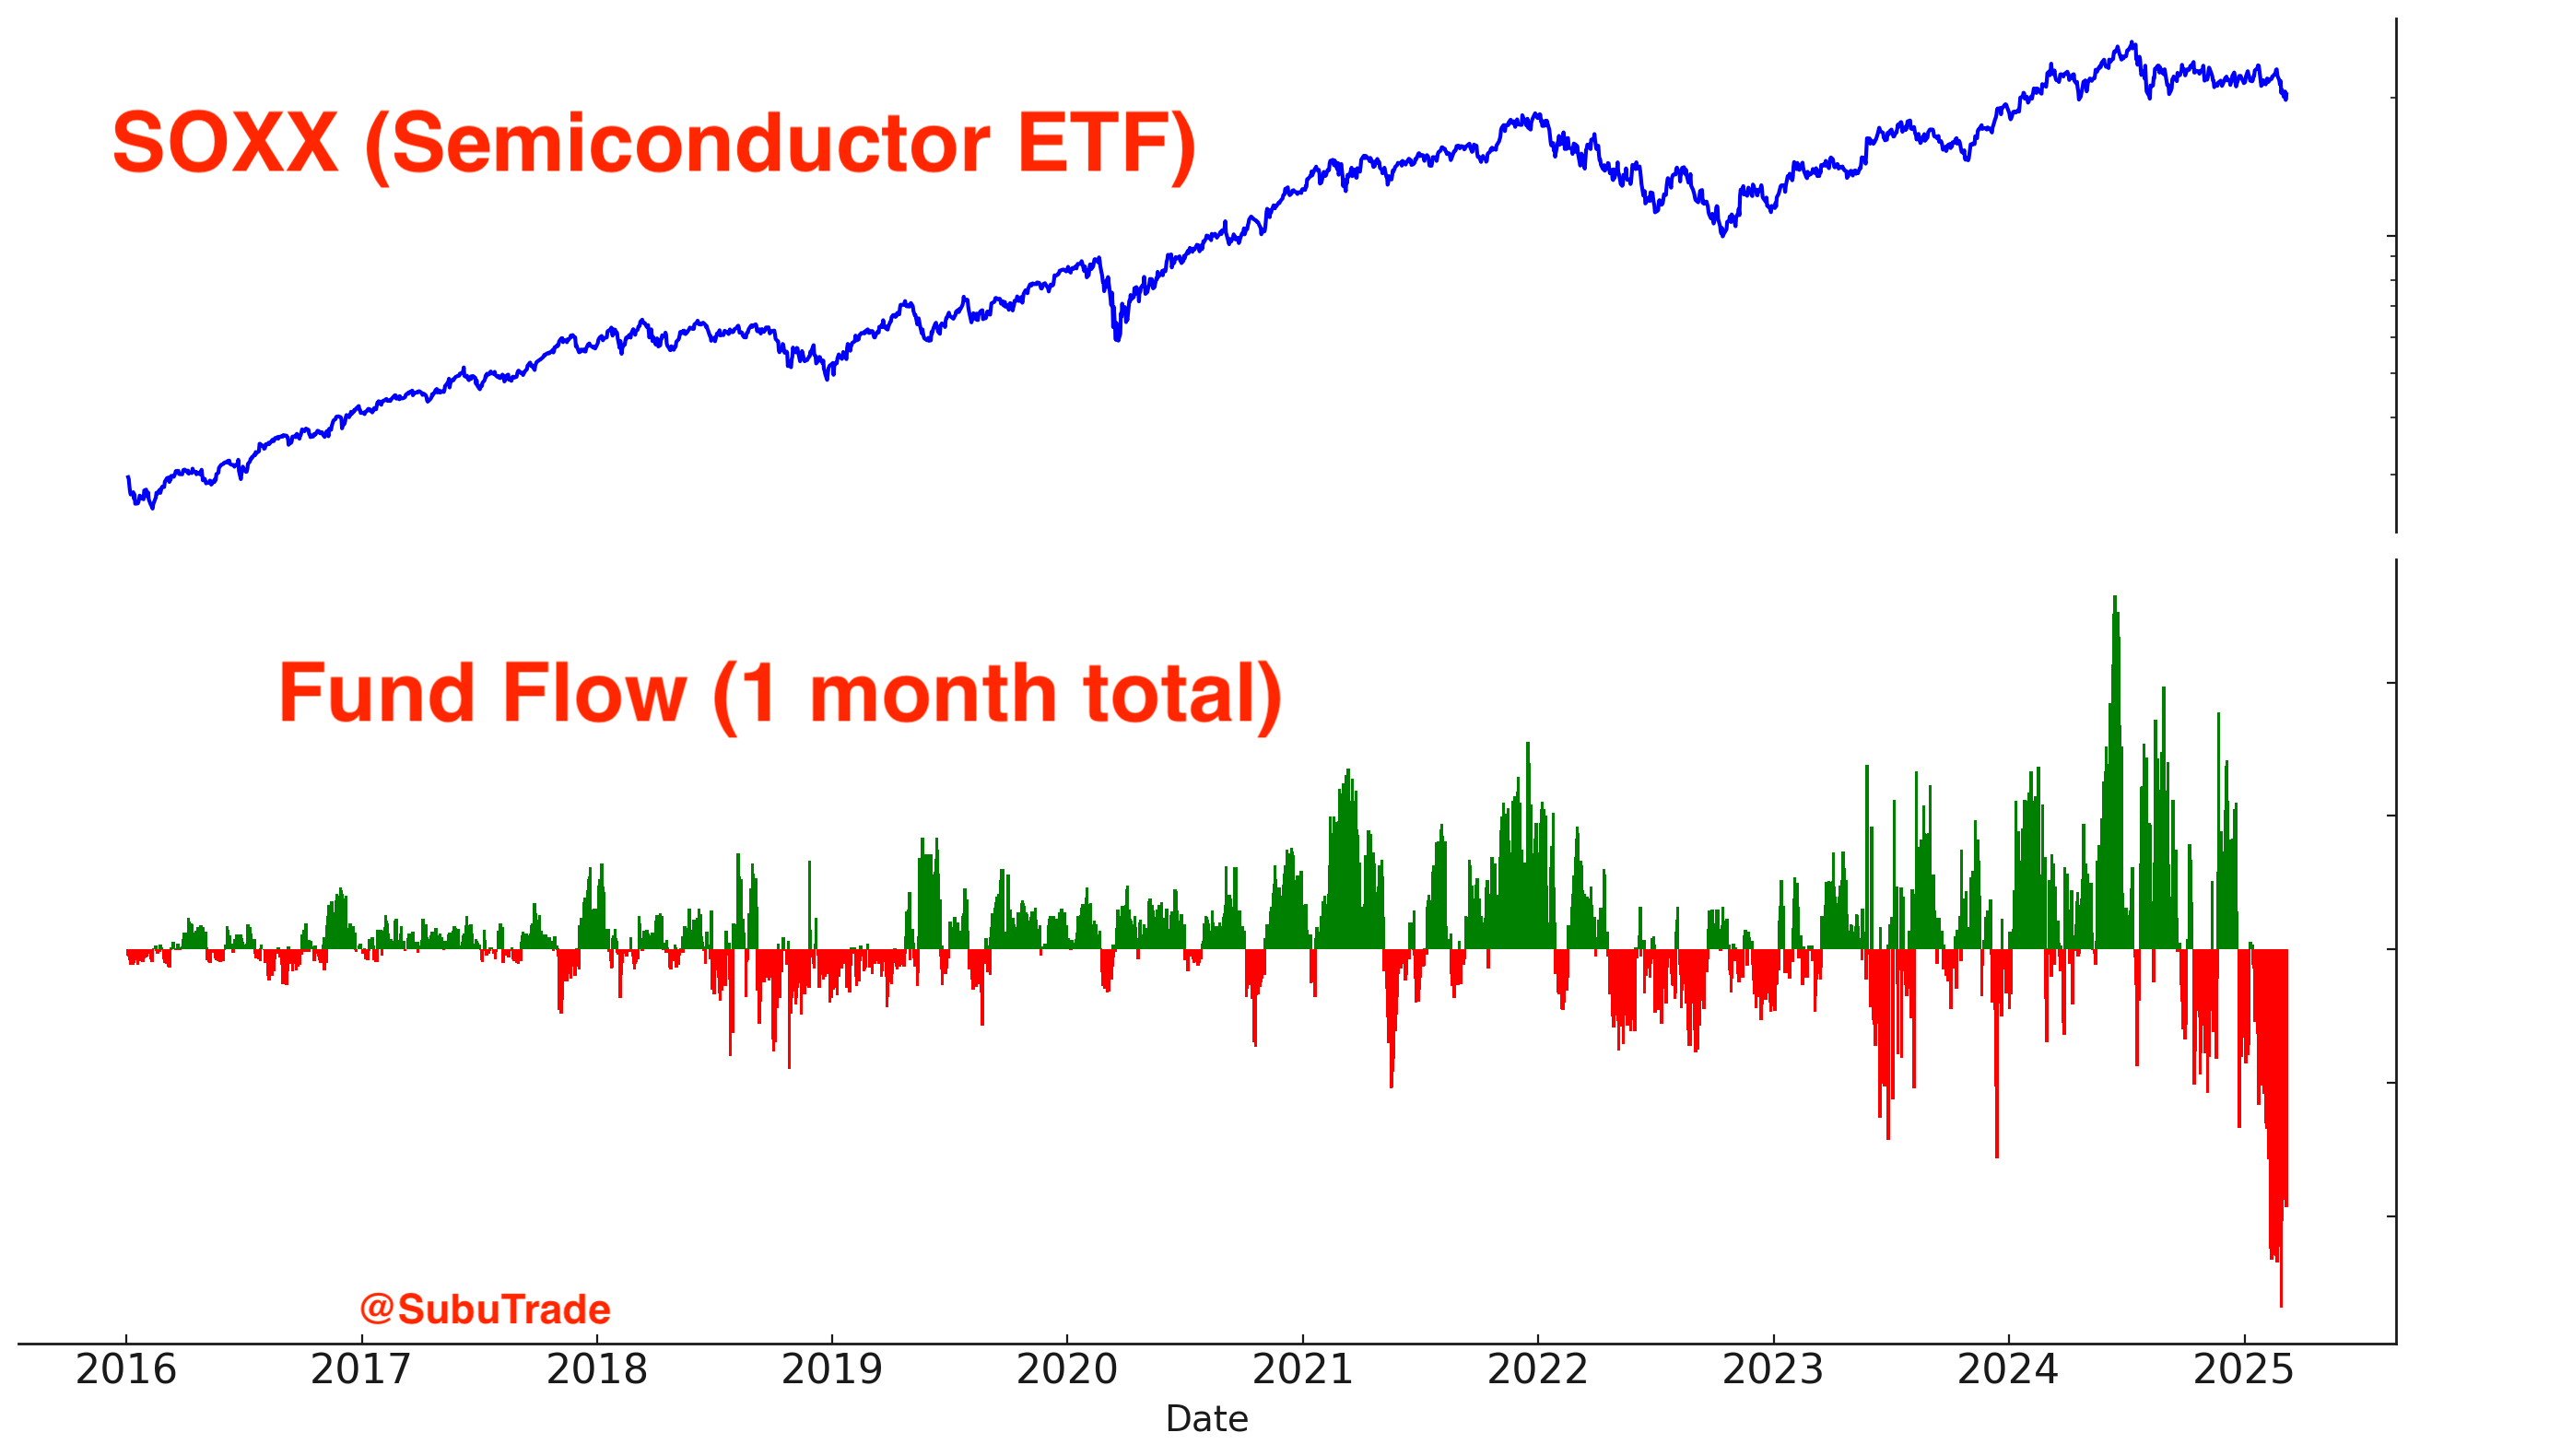
Semiconductor stocks have been crushed. The past 2 weeks saw a large spike in the $ value of SMH puts traded:

Large outflows from SOXX:
Small caps have been crushed as well. The Russell 2000 ETF (IWM) has fallen 6 weeks in a row:
IWM has never fallen 7 weeks in a row before. While there’s always a first time for everything, history suggests a favorable probability of a mean-reversion bounce. This was also bullish for large caps (S&P 500):

IWM Call-Put volume also collapsed. In a bear market this led to mean-reversion rallies. In a bull market this marked the end of corrections:

The SKEW Index has backed off from its all-time high:
Volatility
This is an extremely volatile market, with the S&P going 6 consecutive days in which it closed either 1% higher or 1% lower.
Historically this was common when the S&P was already in a bear market (i.e. when it was already down more than -20%). But this is not common when the S&P is NOT in bear market territory yet.

Historically, this was a bullish sign for U.S. equities. We can expect at least a bounce.

Does this statistic imply that the market has a 100% probability of rising within the next 2–3 months? No. Similar to other indicators and charts, market statistics should not be analyzed in isolation. Instead, they should be considered alongside other fundamental and technical factors, employing a comprehensive "weight of the evidence" approach.
With regards to volatility, VIX ETFs have experienced significant outflows over the past two weeks. This last occurred during COVID when equities crashed and VIX soared. Historically, VIX ETF traders tend to lock in profits and exit their positions as volatility spikes, which explains the pattern of outflows from VIX ETFs when VIX spikes.

Sentiment surveys
Sentiment remains a mixed picture, with certain sentiment surveys showing extreme fear while others not confirming such pessimism.
AAII still exhibits extreme fear:

The Investors Intelligence survey reflects increasing pessimism, though not to the same extent as the AAII survey. It will be interesting to see what next week’s Investors Intelligence numbers are:

NAAIM Exposure is not exhibiting a similar level of fear:
Other sentiment indicators
The S&P 500 Daily Sentiment Index continues to fall:
The VIX Daily Sentiment Index has spiked to the highest level since COVID:

CNN Fear & Greed remains extremely low:
Corporate Insiders
The Insider Sell/Buy ratio has fallen a little during the recent market selloff, but not significantly:

Breadth
Since the current market selloff is concentrated in certain sectors, there has not been a significant increase in the % of S&P 500 stocks that are oversold or at 52-week lows:
Here are the % of S&P 500 stocks above their 200-DMA and 50-DMA:
Trend
“The trend is your friend, until it ends.” The trend is changing now. The NASDAQ 100 fell below its 200 day moving average this week for the first time in almost 500 days. This was the second longest streak - now broken.

The S&P 500 is on the verge of closing below its 200 day moving average as well, ending another historic streak:

The S&P 500 is no longer in an Up trend:
Overall, the extreme sell-off in certain sectors of the market (tech, high beta, small caps etc) suggest that a mean-reversion bounce is due.
Trend followers should step away from this market. The market is no longer trending higher.
Mean-reversion traders should buy the most beaten down sectors, but use small position sizes and scale in if the market continues to fall. Focus on Risk:Reward
While U.S. equities have experienced choppy price action this year, trend-following strategies have performed well for those focused elsewhere:
China
After years of underperformance, Chinese equities have delivered strong gains so far this year. Based on conventional mean-reversion metrics, the current rally is over-extended, suggesting a downwards reversal:

However, the Chinese stock market does not follow the same technical patterns as U.S. markets. Culturally, China has a strong gambling mindset, and domestic investors tend to be momentum-driven, aggressively piling in as prices rise. Ultimately, it is local investors, rather than foreign capital, that will dictate the trajectory of a Chinese bull market.
This explains why Chinese equities periodically experience sharp, parabolic rallies (see 2015).
Historically, Chinese investors have not prioritized equities, with the majority of their wealth concentrated in real estate. However, with the property market under pressure and interest rates at low levels, domestic investors are increasingly seeking alternative investment opportunities. As a result, a substantial pool of Chinese savings remains sidelined, awaiting deployment.
If policymakers successfully create market momentum, a wave of Chinese retail investors (momentum chasers) could chase the rally and push prices higher. At present, the Chinese government is actively promoting a transition toward a stronger equity investment culture.
This scenario I’ve laid out is not a certainty, but a possibility. As such, risk management remains critical. Stay long but use a small position size.
Focus on the trend and use a trailing stop:
Thusfar Chinese and European equities have rallied higher together. Will both markets continue to push higher, or will Chinese equities leave European equities in the dust during the next leg?

I acknowledge the possibility that Chinese equities may have peaked. However, there is an equally strong case that this could be the first leg of a larger rally. Rather than attempting to call the top, a more prudent approach is to maintain a small position size, stay long, and implement a trailing stop loss to manage risk.
India
Indian stocks have been crushed in the past few months. This could be the start of a rally:

Large outflows from Indian ETFs:

The trend remains DOWN:
Trend-following strategies do not currently justify a long position in Indian equities. However, I hold a non-core mean-reversion position, anticipating a short-term bounce.
Precious metals
The bullish narrative/theme for gold remains. Global central banks are buying gold because they fear holding U.S. Treasuries that could be confiscated in the middle of a geo-political conflict (e.g. U.S.-China economic war). As the US. ratchets up trade pressure on allies and foes, expect the demand for gold to increase. Here are the annual purchases of gold by central banks:

Gold remains in an Up trend:
Gold sentiment (grey line) and its 1 month average (black line) remain elevated. Elevated sentiment is a hall-mark of bull markets:
Interestingly, gold miners have seen non-stop outflows over the past 2 months while precious metals rallied:

I am long gold, using a trailing stop.
Treasury Bonds
Treasury bonds are trending sideways/upwards:
Sentiment has recovered to neutral:
I increased my non-core long position in bonds this week. If the U.S. economy continues to weaken and a deflationary narrative takes hold, bonds are likely to rally. Conversely, if such a scenario does not materialize, I expect bonds to remain range-bound, consistent with their behavior over the past few years.
This trade offers a degree of asymmetry: if I am correct, the upside potential is significant, while if I am wrong, the downside risk is relatively limited.
U.S. Dollar
The U.S. Dollar is trending downwards:

Sentiment is falling:

I do not have a currencies position.
My Portfolio
*Click here if you don’t understand how I trade
Mean-Reversion Position (Non-Core) – Long Oversold Tech Stocks:
Small position size, looking for AT LEAST a bounce. If the market continues to fall, I will scale in and increase my position size. The market is extremely oversold, but extremes can always become more extreme.Core Position – Long Gold and Silver: Maintaining a small position with a trailing stop.
Mean-Reversion Position (Non-Core) – Long U.S. Treasury Bonds: Increased exposure to U.S. Treasury bonds this week. Given the potential for further economic slowdown, bonds may see continued upside.
Mean-Reversion Position (Non-Core) - Long Indian Equities: Extremely oversold, looking for at least a mean-reversion rally.
Black Swan Position – Long Chinese Equities: Maintaining a small position with a trailing stop. The recent rally might be just the first leg of a larger rally.
Have any questions? Please email me at contact@subutrade.com
Fantastic stuff - definitely the closest I think to my own research that I can find. I'm still not seeing new lows on the XLG components get that oversold - it's still a lot of rotation into defensives. We do have volatility at the point where we should expect any shred of good news could produce a lift just by the options dynamics. Once those defensive sectors get really overbought and we do a dead cat bounce for some of the Mag 7, we'll be looking for that first "lower high" to show itself. At that point, we could be seeing the point in time when everyone will look back a year later and say "I should have sold everything right there."