
Markets Report: start of a rally, or new lows ahead?
Is this the start of a rally for U.S. equities? Or are new lows ahead?

The U.S. stock market is attempting to bounce from extremely oversold conditions. However, price action is a little weak, with the S&P 500 struggling to rally from below its 200 day moving average. This is a small worrisome sign for bulls who are looking for a mean-reversion rally.
My Portfolio & Market Outlook
*Click here if you don’t understand how I trade
Mean-Reversion Position (Non-Core) – Long Oversold Tech Stocks:
Currently at 40% of the potential max size. Targeting AT LEAST a short-term bounce over the next few days/weeks.Black Swan Position – Long Chinese Equities: long with a trailing stop.
Core Position – Long Gold and Silver: long with a trailing stop.
Mean-Reversion Position (Non-Core) - Long Indian Equities: Was extremely oversold, mean-reversion rally is now underway.
Mean-Reversion Position (Non-Core) – Long U.S. Treasury Bonds: Small position size.
In today’s highly volatile market, traders must focus on Risk:Reward and position size management to account for various scenarios and their respective probabilities.
U.S. Equities
As of the prior week, the U.S. stock market had reached extremely oversold conditions, creating a favorable backdrop for a mean-reversion rally. I remain bullish and expect further upside. However, the stock market’s weak bounce thusfar is a minor cause for concern.
When markets are extremely oversold and don’t bounce vigorously, that is a small warning sign for bulls. While not a major warning sign, it is a development worth monitoring.
Let’s dive into the data:
Sentiment surveys
Sentiment remains depressed. The 4 week average of AAII Bears is extremely high:

Historically, this typically occurred at the end of major bear markets, rather than during 10% corrections. As a result, it was previously a strong bullish signal for equities.

VIX fell when sentiment was this pessimistic:
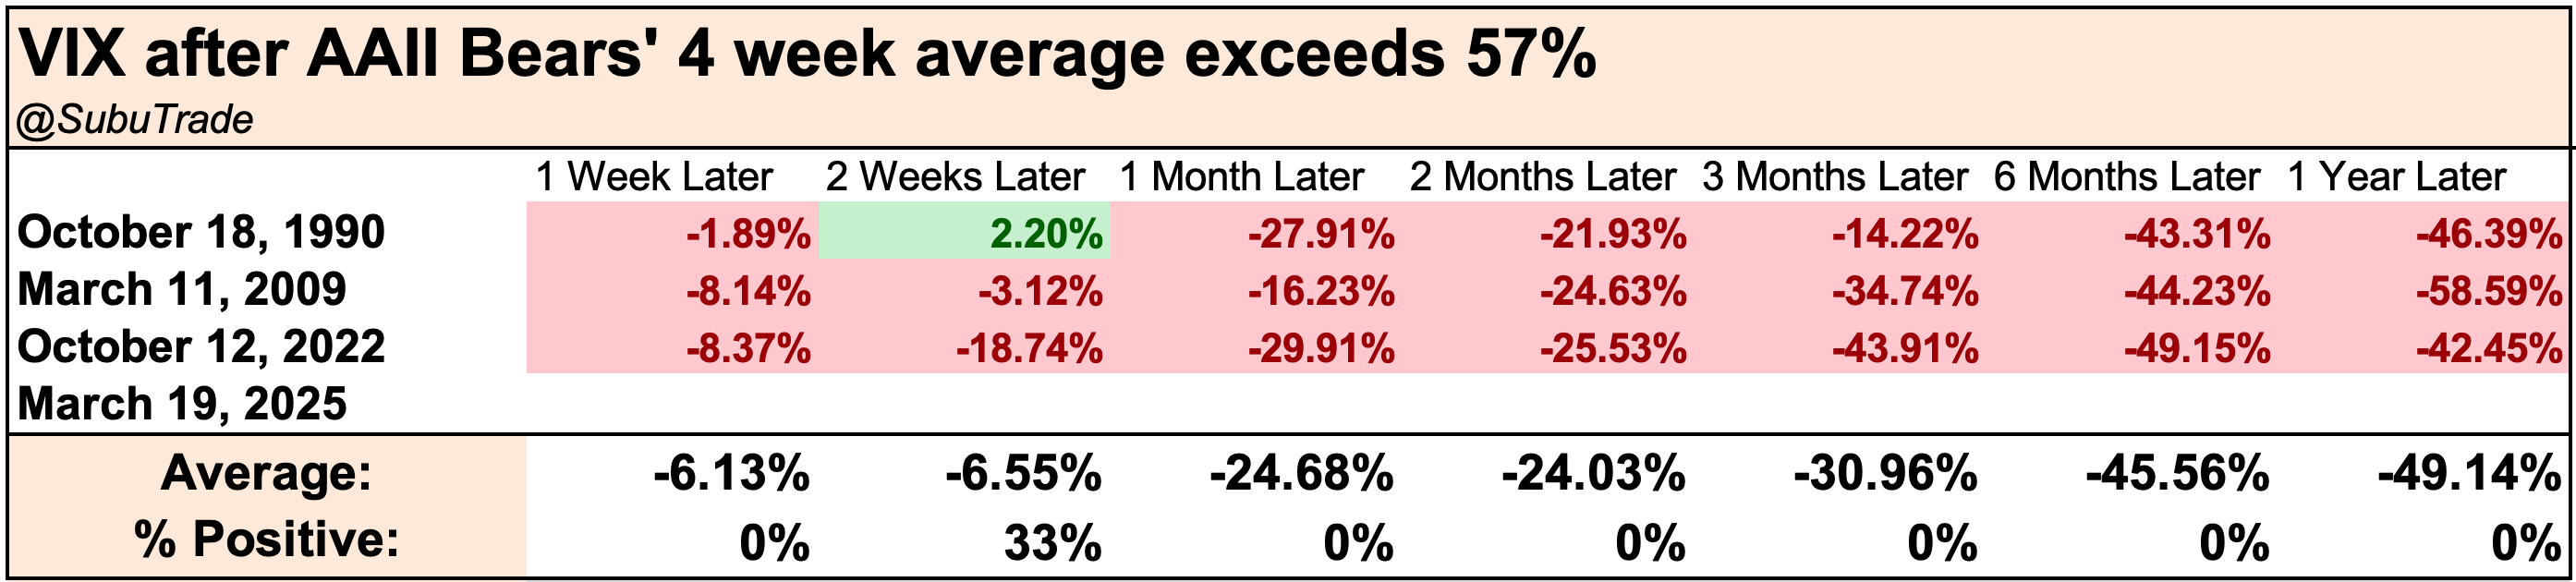
Notably, AAII Bears have remained above 55% for 4 consecutive weeks—a new record. This surpasses the previous streak observed at the March 2009 bear market bottom.

Admittedly, drawing direct comparisons between today and the March 2009 bear market bottom is flawed. However, several factors help contextualize the elevated bearish sentiment:
Many popular stocks (e.g. Tesla and Nvidia) have experienced much larger drawdowns than the index, and…
Traders are using more leverage than before (options, leveraged ETFs, margin etc).
Taken together, these factors suggest that even a relatively modest market decline today can generate levels of pessimism historically associated with the end of much larger bear markets.
The Investors Intelligence sentiment survey shows a similar level of pessimism, although not as extreme:

The NAAIM Exposure Index continues to diverge from the elevated levels of pessimism reflected in the AAII and Investors Intelligence sentiment surveys:

A major factor causing fear right now: global trade uncertainty:

Option Flows
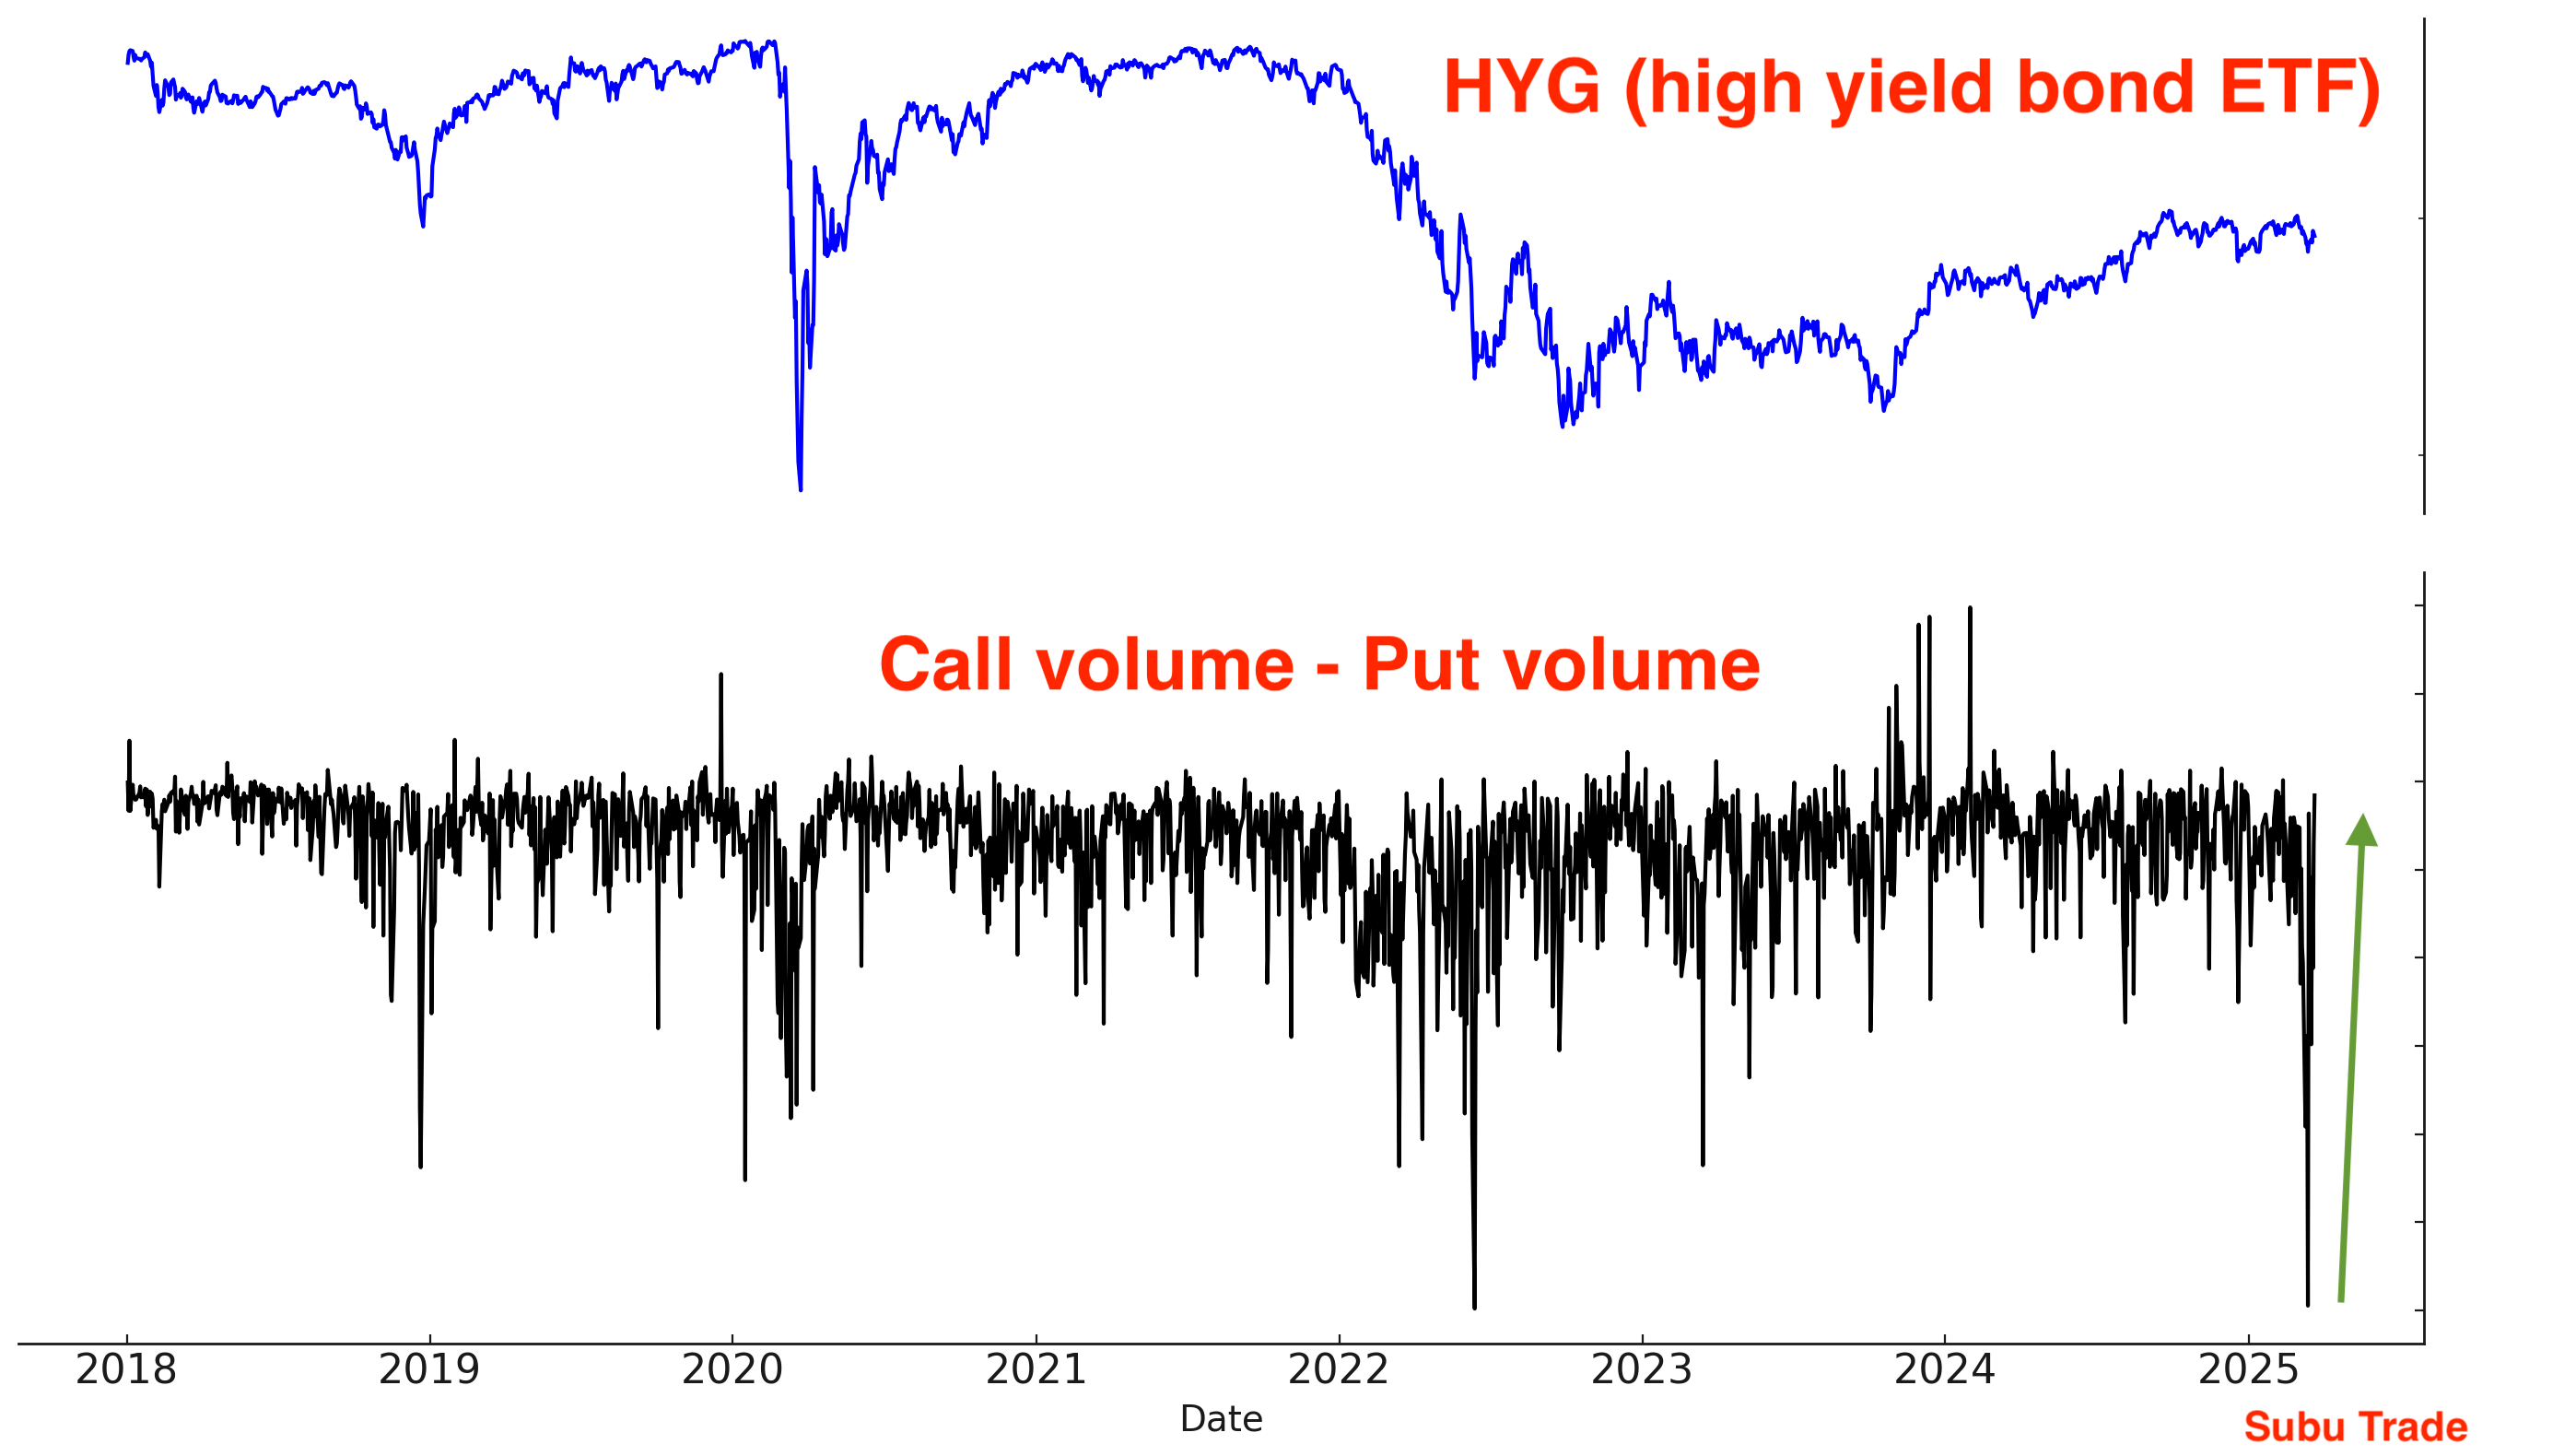
The $ value of QQQ call - put volume has fallen significantly:

Put volumes for HYG stabilized after plunging the prior week:
The $ value of VIX puts surged alongside the recent spike in the VIX itself. As volatility has begun to retreat, the $ value of those VIX puts is similarly declining.

The SKEW Index has fallen significantly from its all-time high. This is a short term bullish sign:

Other sentiment indicators
CNN Fear & Greed: still pessimistic
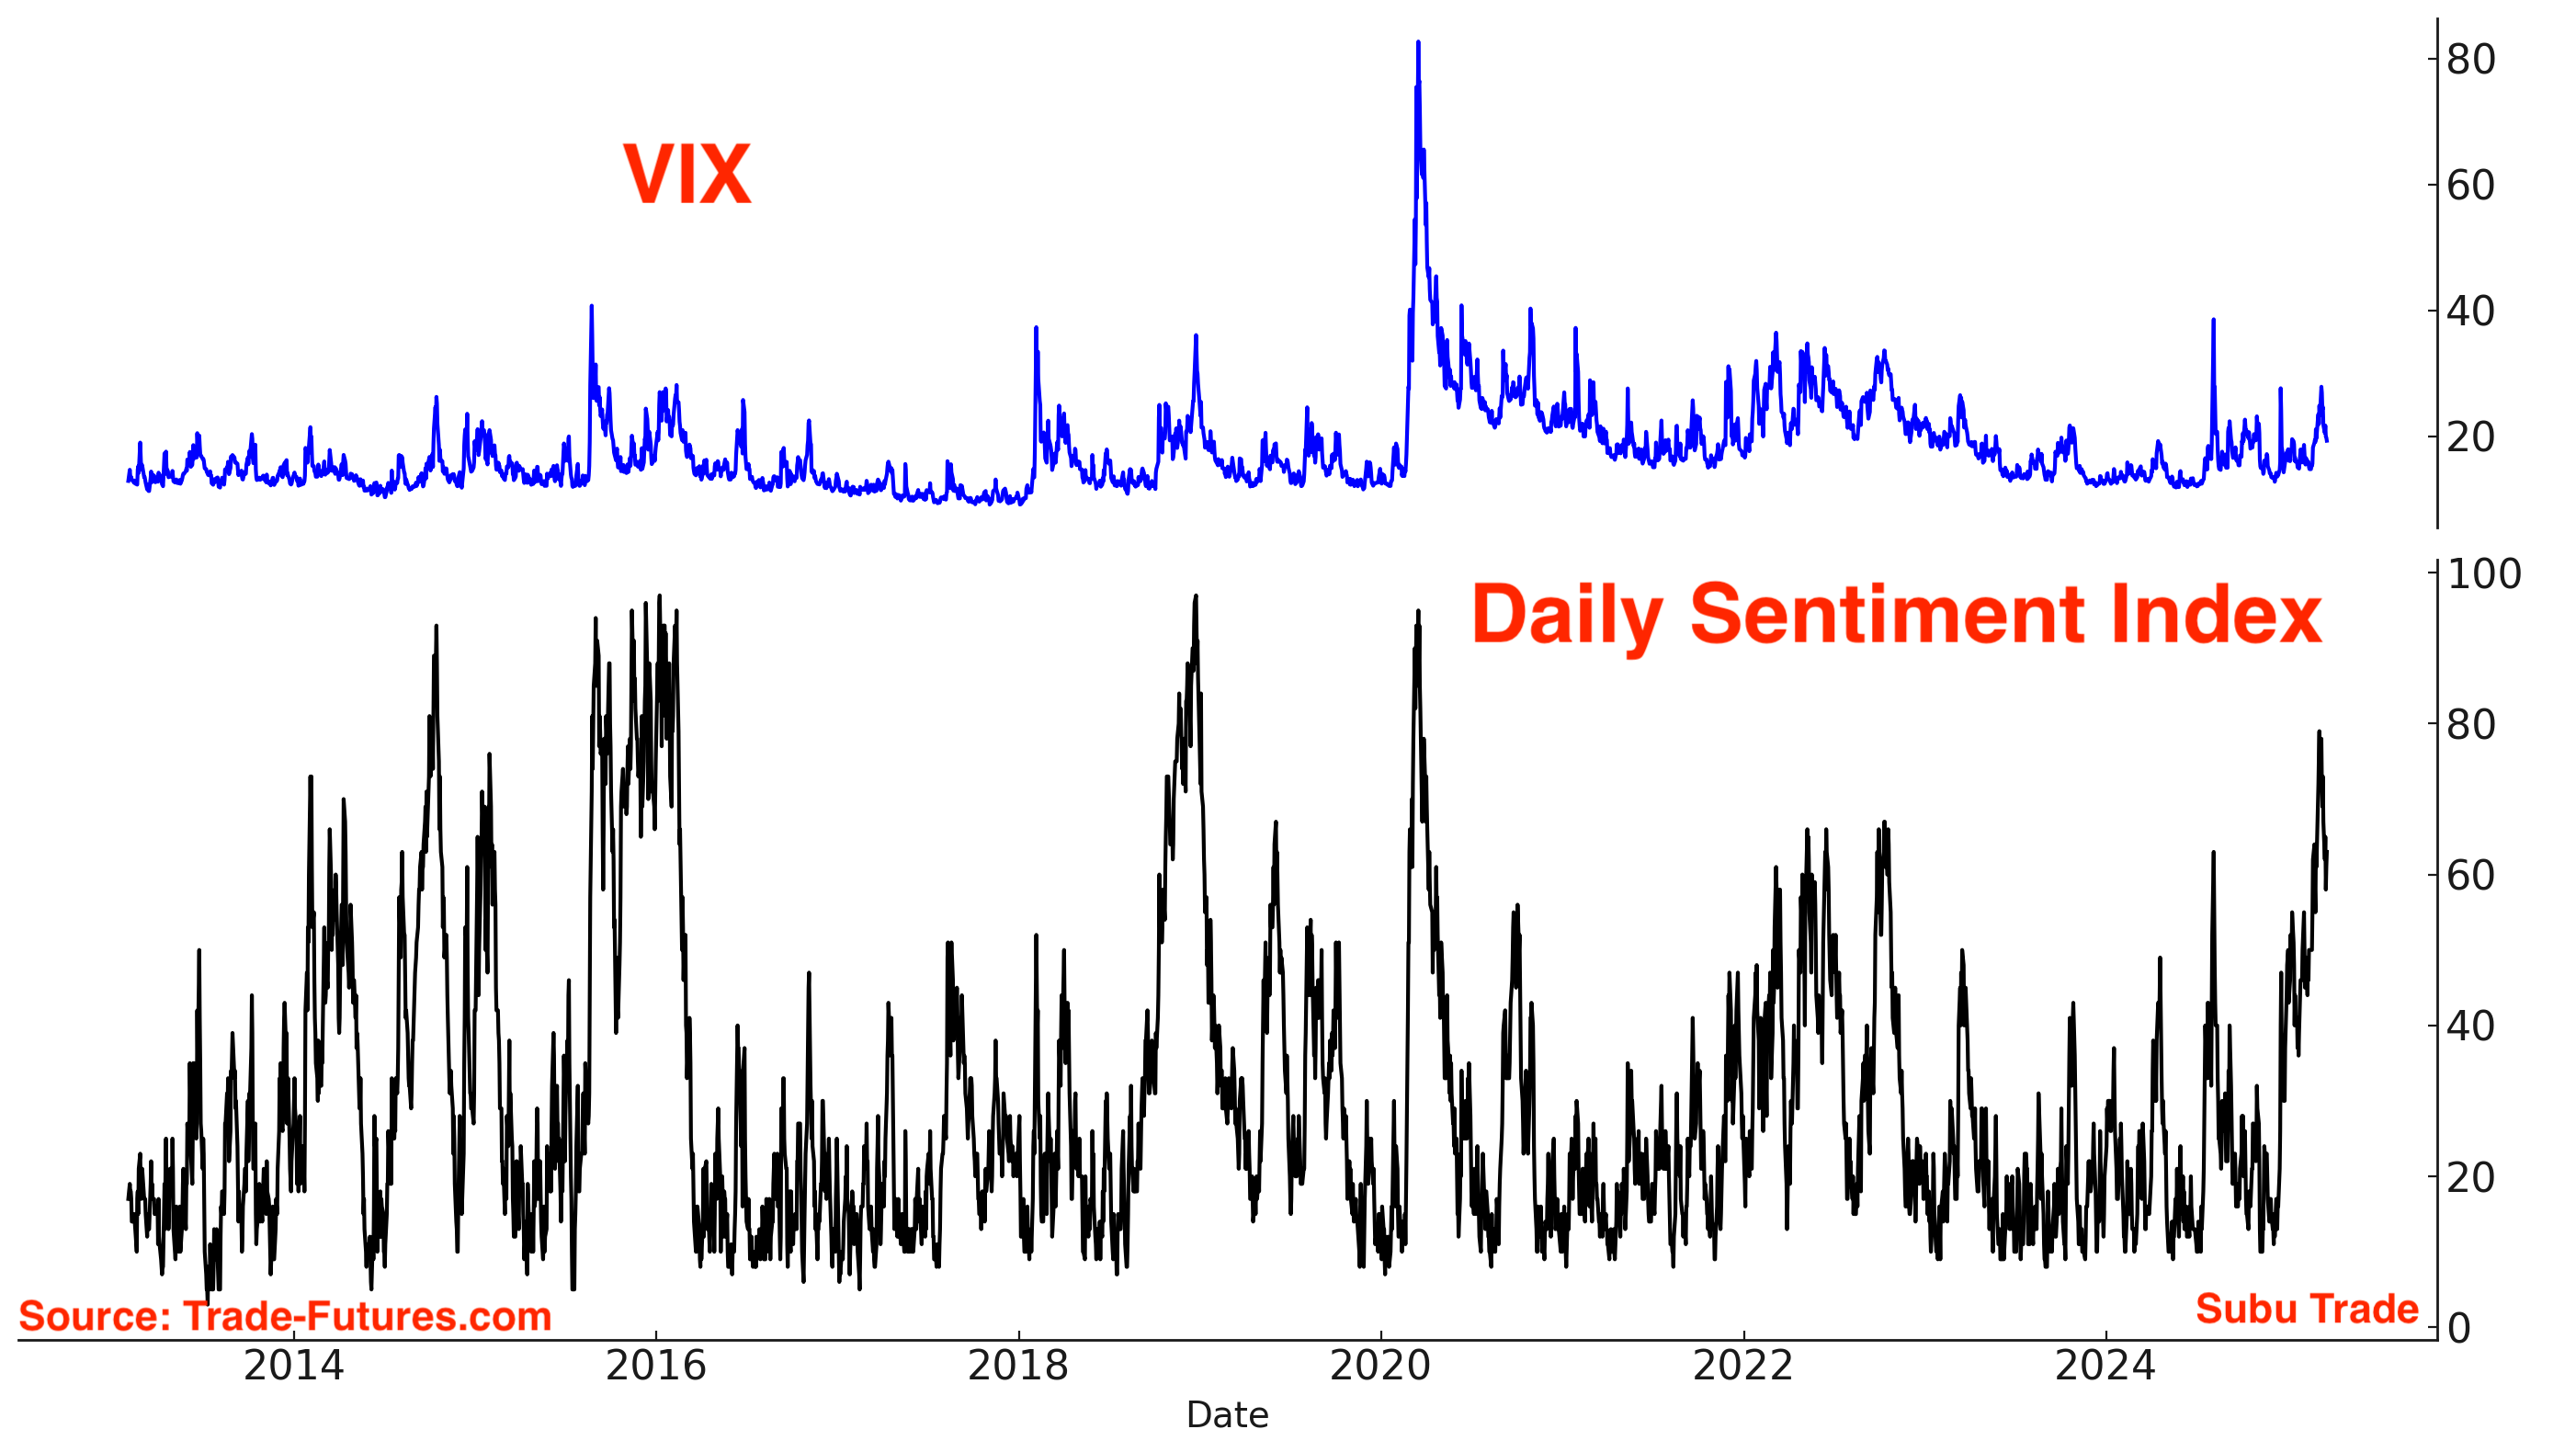
The S&P 500’s Daily Sentiment Index remains low:
Volume
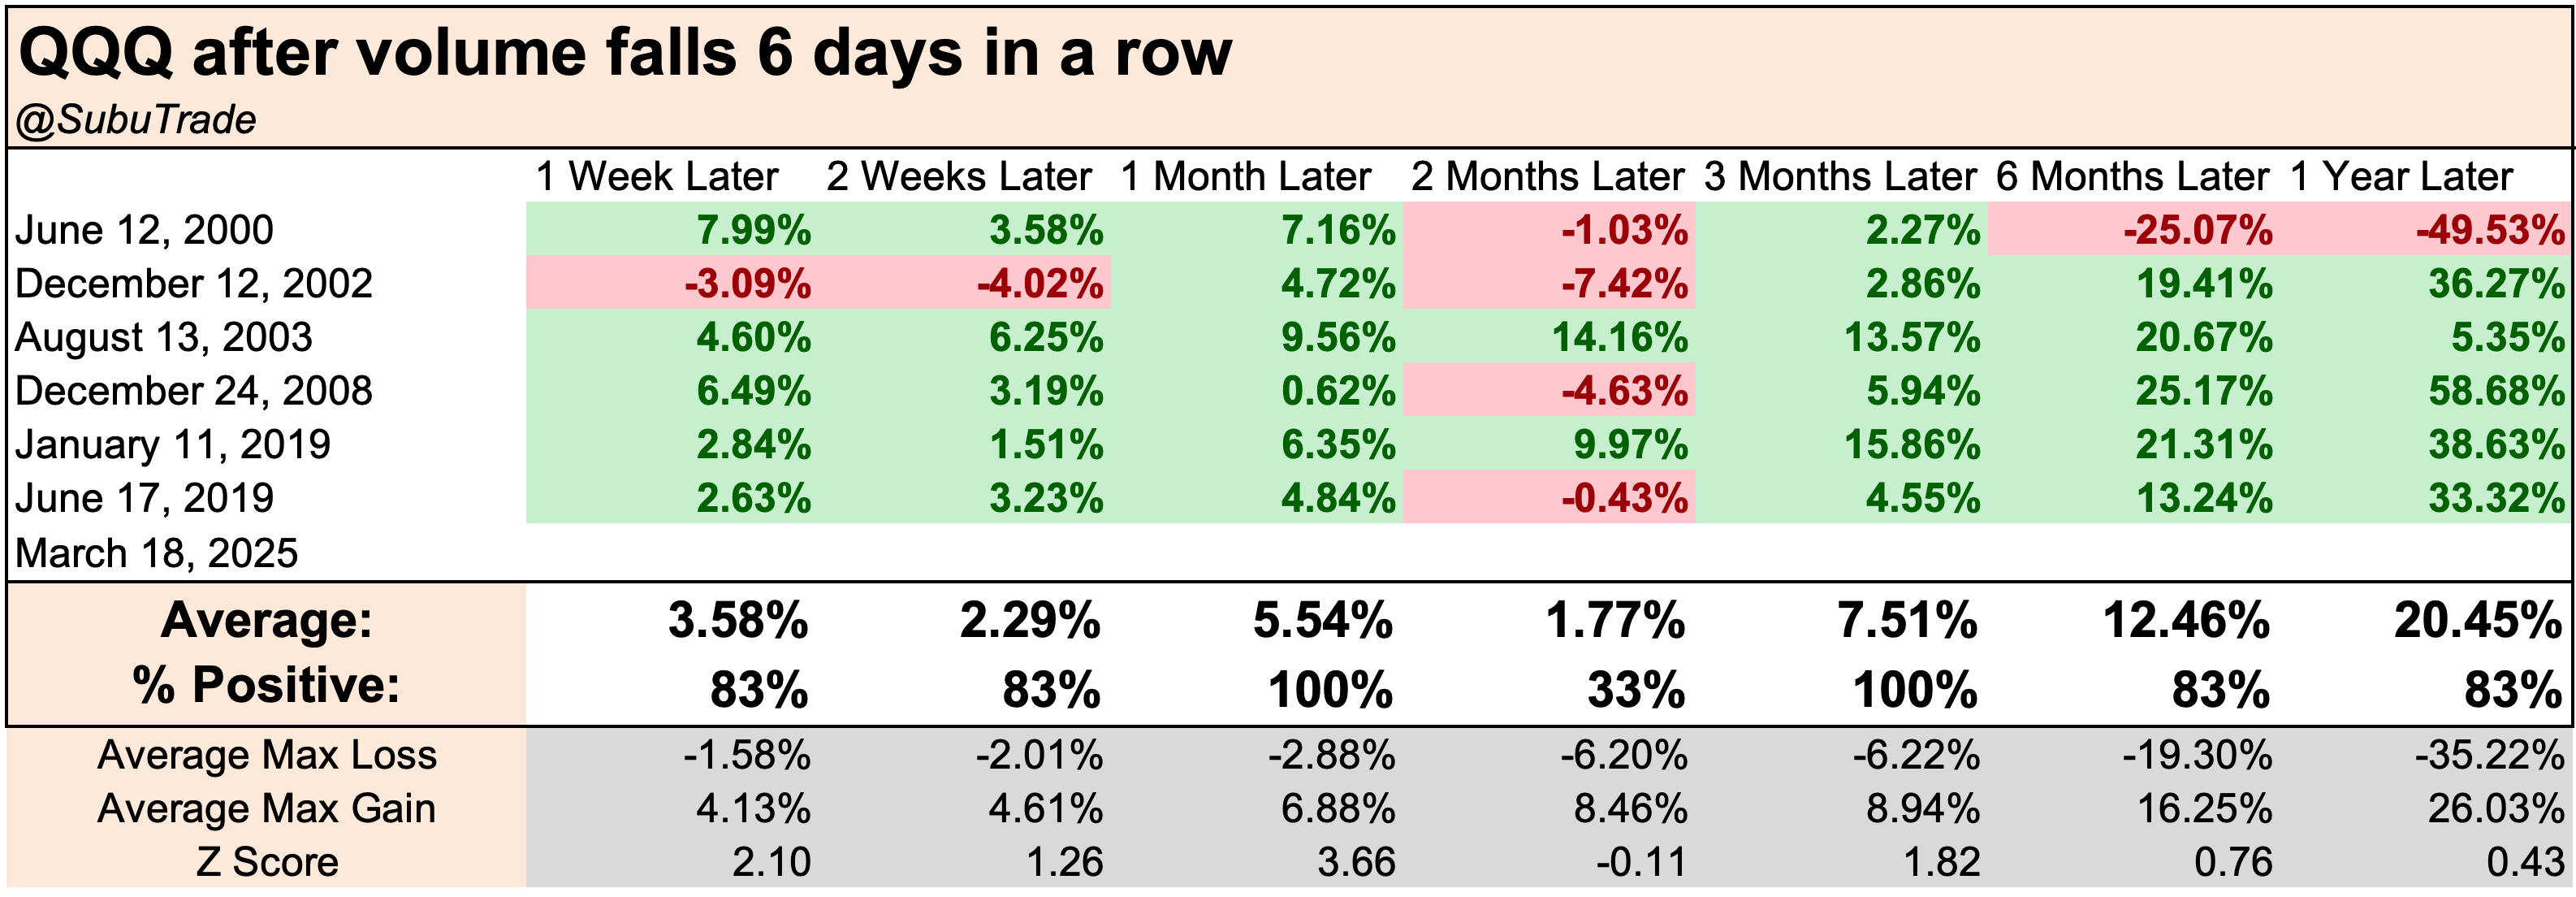
Market crashes are typically accompanied by surging volume, followed by declining volume during the subsequent rebound.
This pattern is currently unfolding. As of March 18, QQQ recorded 6 consecutive days of declining volume.

When this happened in the past, QQQ rallied higher over the next month:
Fund Flows
As I mentioned in last week’s Markets Report, TQQQ traders are contrarian: they buy the dip and sell the rip.
Last week I noted huge inflows into TQQQ as traders were betting on a rally. Now that stocks are rallying, TQQQ inflows are starting to come down:

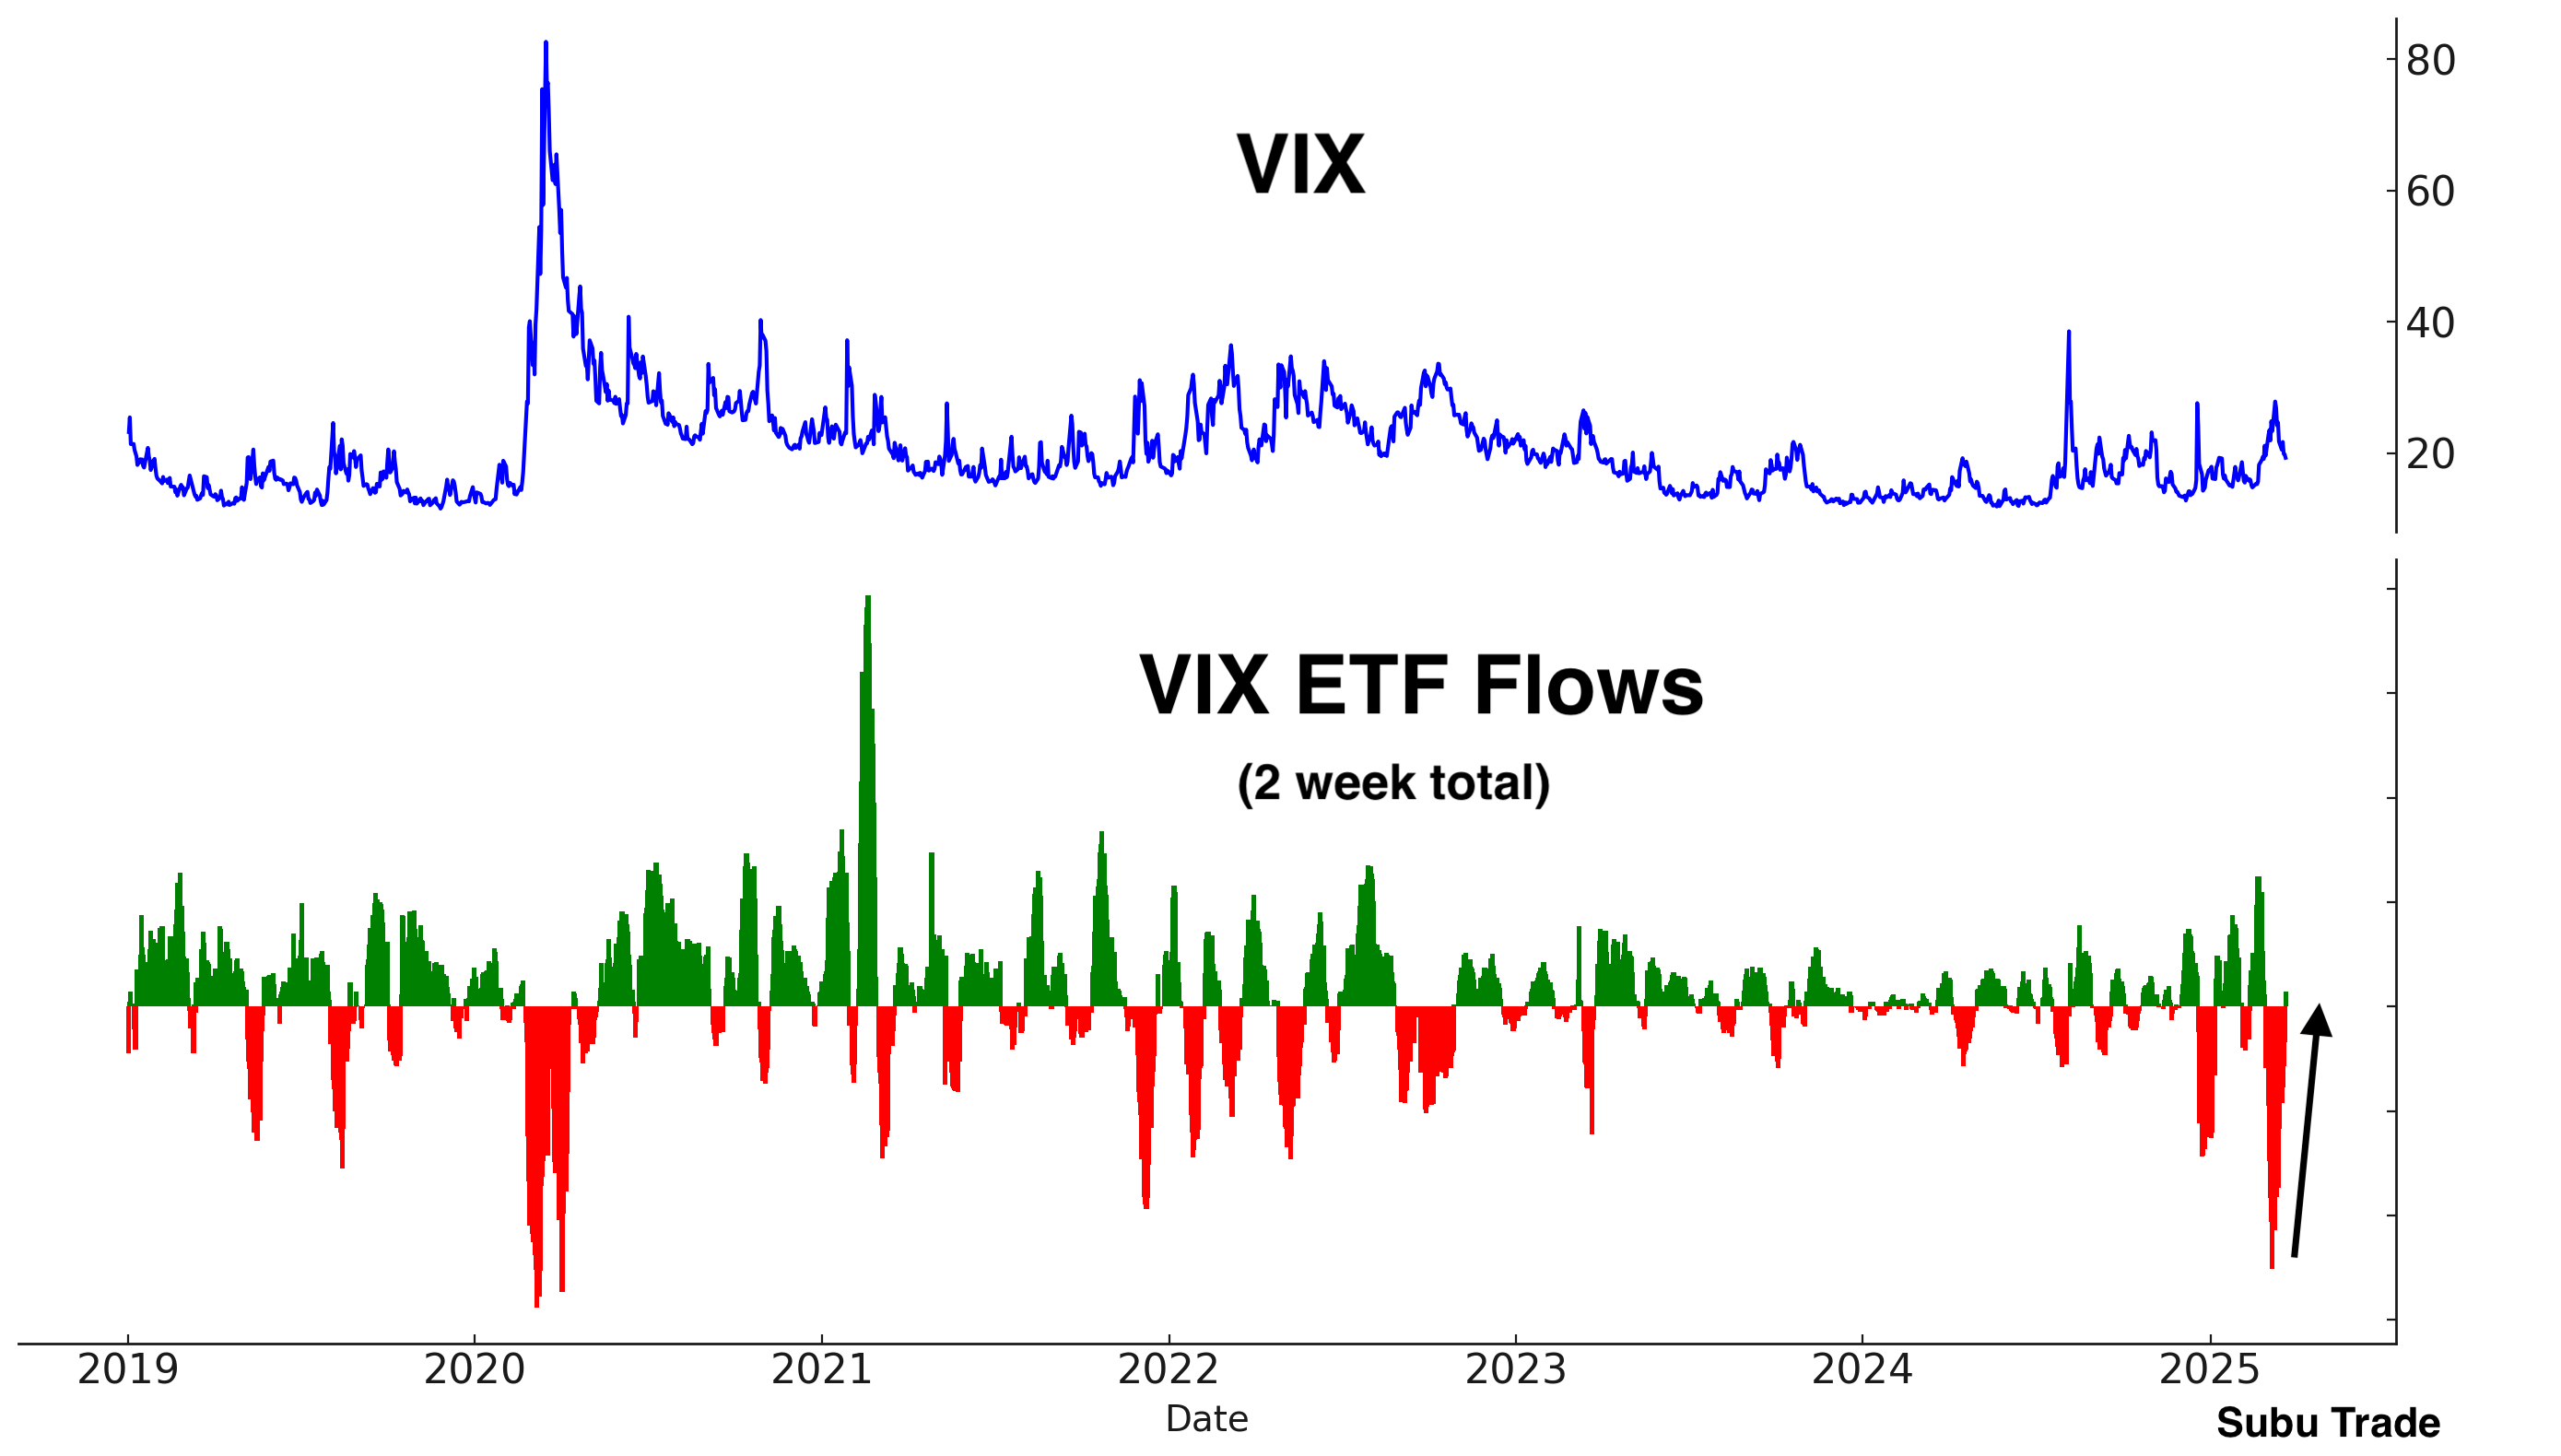
VIX ETF traders are also contrarian: they sell when VIX spikes and buy when VIX falls.
Last week I noted huge outflows from VIX ETFs as traders took profits on their long volatility positions. Now that stocks are rallying and VIX is falling, VIX ETFs are starting to see inflows:
Volatility
Speaking of volatility, VIX is slowly falling. Here’s VIX 1 month / 3 months:

VIX sentiment is also coming down:
Corporate Insiders
It is important to clarify that the current environment does not represent a "once-in-a-lifetime" buying opportunity. Rather, the focus remains on a tactical, oversold bounce.
Notably, there has been no significant surge in the Corporate Insider Buy/Sell ratio. While a market bottom can certainly form without such a spike, the absence of elevated insider buying suggests that this is not an exceptionally compelling long-term entry point.

Breadth
The % of S&P 500 stocks that were oversold jumped the prior week. With the stock market rallying this week, fewer stocks are oversold:

Less than half of S&P 500 stocks are above their 200 and 50 day moving averages. This is normal, considering that the S&P 500 index itself is below these 2 moving averages:
Trend and momentum
The trend is your friend, until it ends. The U.S. stock market is no longer in an Up-trend:
Why does this matter? Because from a trend following perspective, it is better to buy when the stock market is trending higher than when it’s not:

Although the stock market is not currently trending upward, conditions still support the potential for at least a short-term bounce. A potential rally is underway, even though this rally is weak.
I remain long.
Chinese Equities
The Chinese stock market continues to trend higher. By popular mean-reversion metrics, the current rally in Chinese equities is overbought, raising the potential for a correction. Despite the probability of a correction, I remain long with a trailing stop loss.
Unlike U.S. markets, China’s stock market is heavily influenced by domestic retail investors, who tend to be momentum-driven and quick to chase rising prices. This dynamic has historically led to sharp, parabolic rallies—most notably in 2015.
With real estate under pressure and interest rates at low levels, a massive pool of domestic capital is seeking alternative investments that were traditionally unpopular with Chinese investors. If policymakers succeed in generating market momentum, a surge of local retail participation could drive Chinese equities significantly higher. China’s ongoing push to foster an equity investment culture further supports this potential.
For now, focus on the trend in Chinese equities, which remains Up:
It’s worth noting that Copper is trending higher along with Chinese equities. Could copper breakout?

Foreign inflows into Chinese tech are falling. Mainland Chinese investors are buying the dip:

Short interest for FXI:

I would like to reiterate that while mean reversion metrics suggest that a correction is likely, Chinese equities may continue to rally higher. This is not a certainty, hence bullish traders should have a stop loss in case the market reverses lower.
India
Indian equities were extremely oversold. A mean-reversion rally is now underway:

India’s trend is turning upwards:
More and more traders are betting on an Indian rebound. Here’s INDA’s call - put volume:

Indian outflows are stabilizing:

In the long run, stocks and corporate earnings move in the same direction. Here’s India’s SENSEX index and its corresponding corporate earnings:
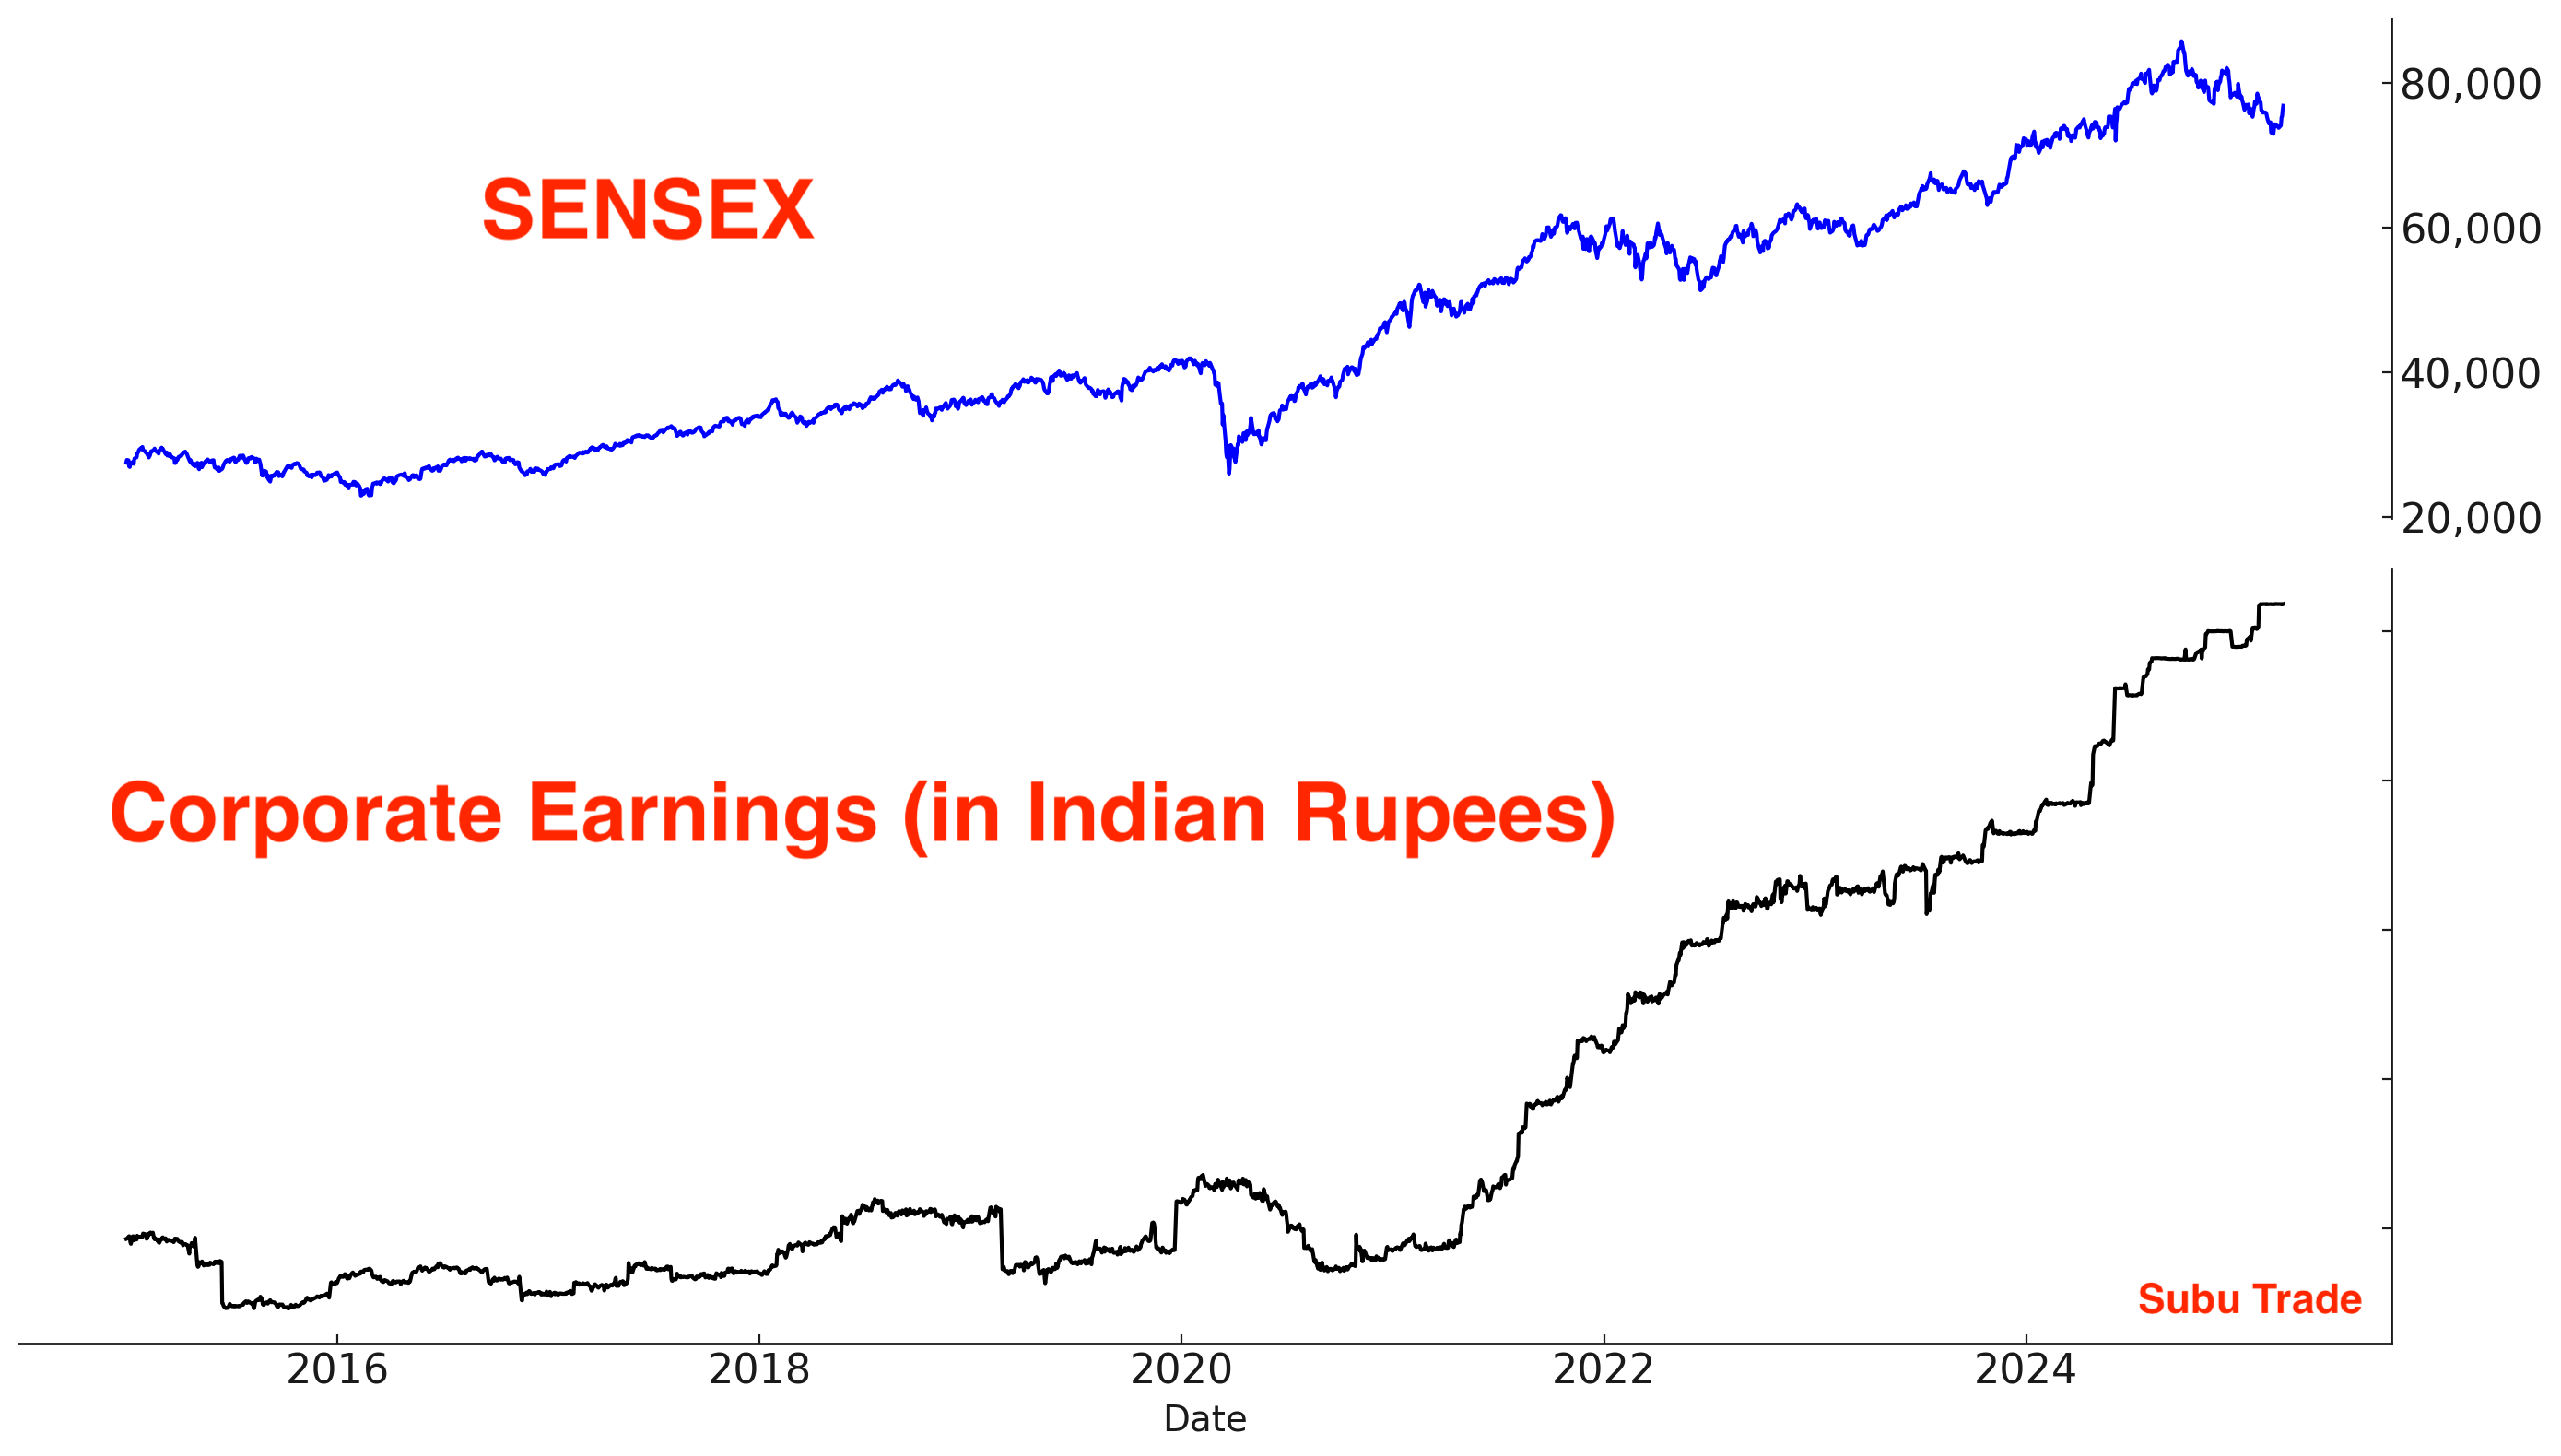
Long term, I am far more bullish on India than China. This is India’s Century.
Precious Metals
The bullish narrative/theme for gold remains. Global central banks are buying gold because they fear holding U.S. Treasuries that could be confiscated in the middle of a geo-political conflict (e.g. U.S.-China economic war). As the US. ratchets up trade pressure on allies and foes, expect the demand for gold to increase. Here are the annual purchases of gold by central banks:

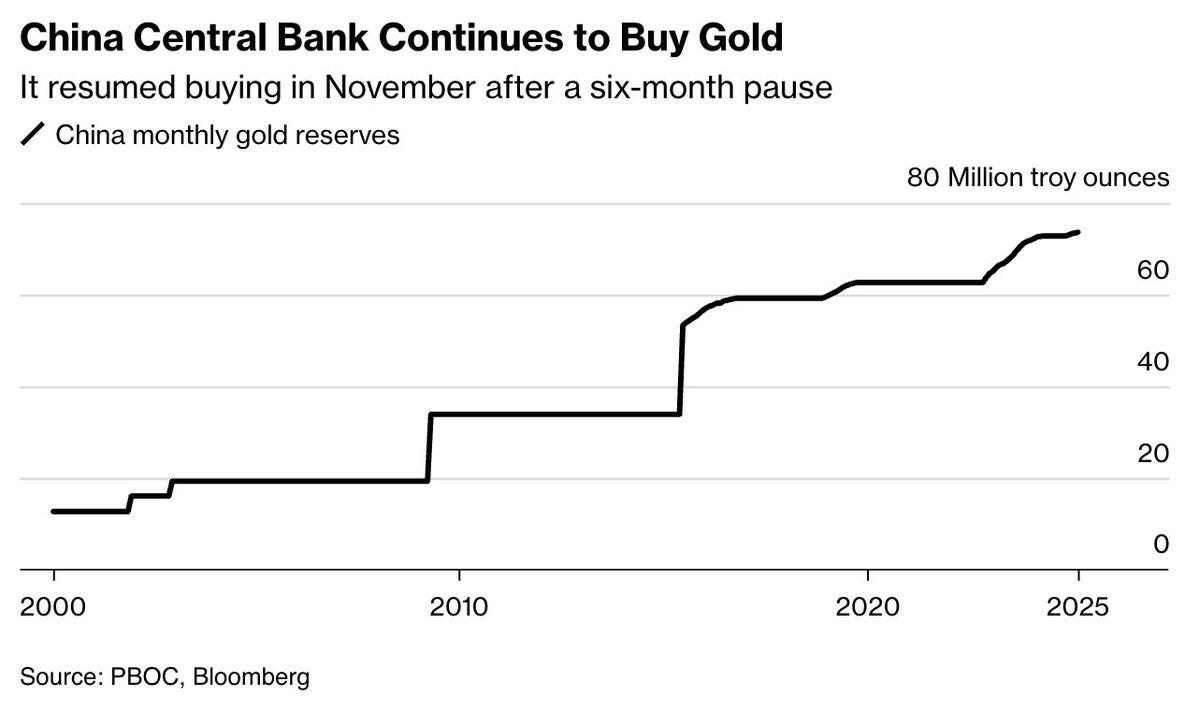
China’s central bank continues to accumulate gold. Actual holdings are likely significantly higher than disclosed:
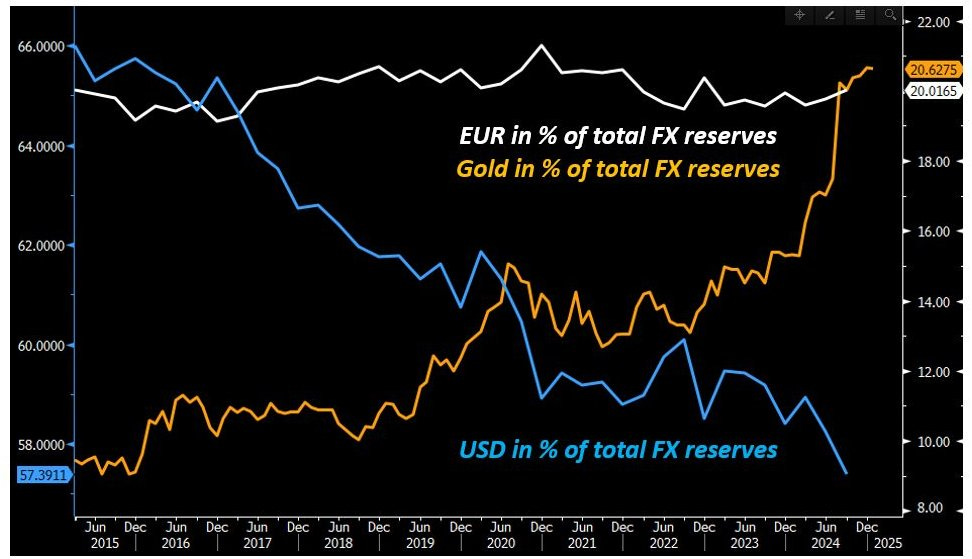
Gold as a % of central bank reserves is increasing:
Gold continues to trend higher:
Sentiment remains elevated:
With that being said, there is a heightened risk that gold will pullback. The past 5 weeks saw massive inflows into GLD. In the past, this either led to a multi-month sideways consolidation or marked the top for gold:

Gold is up 11 out of the past 12 weeks. This is worrisome:

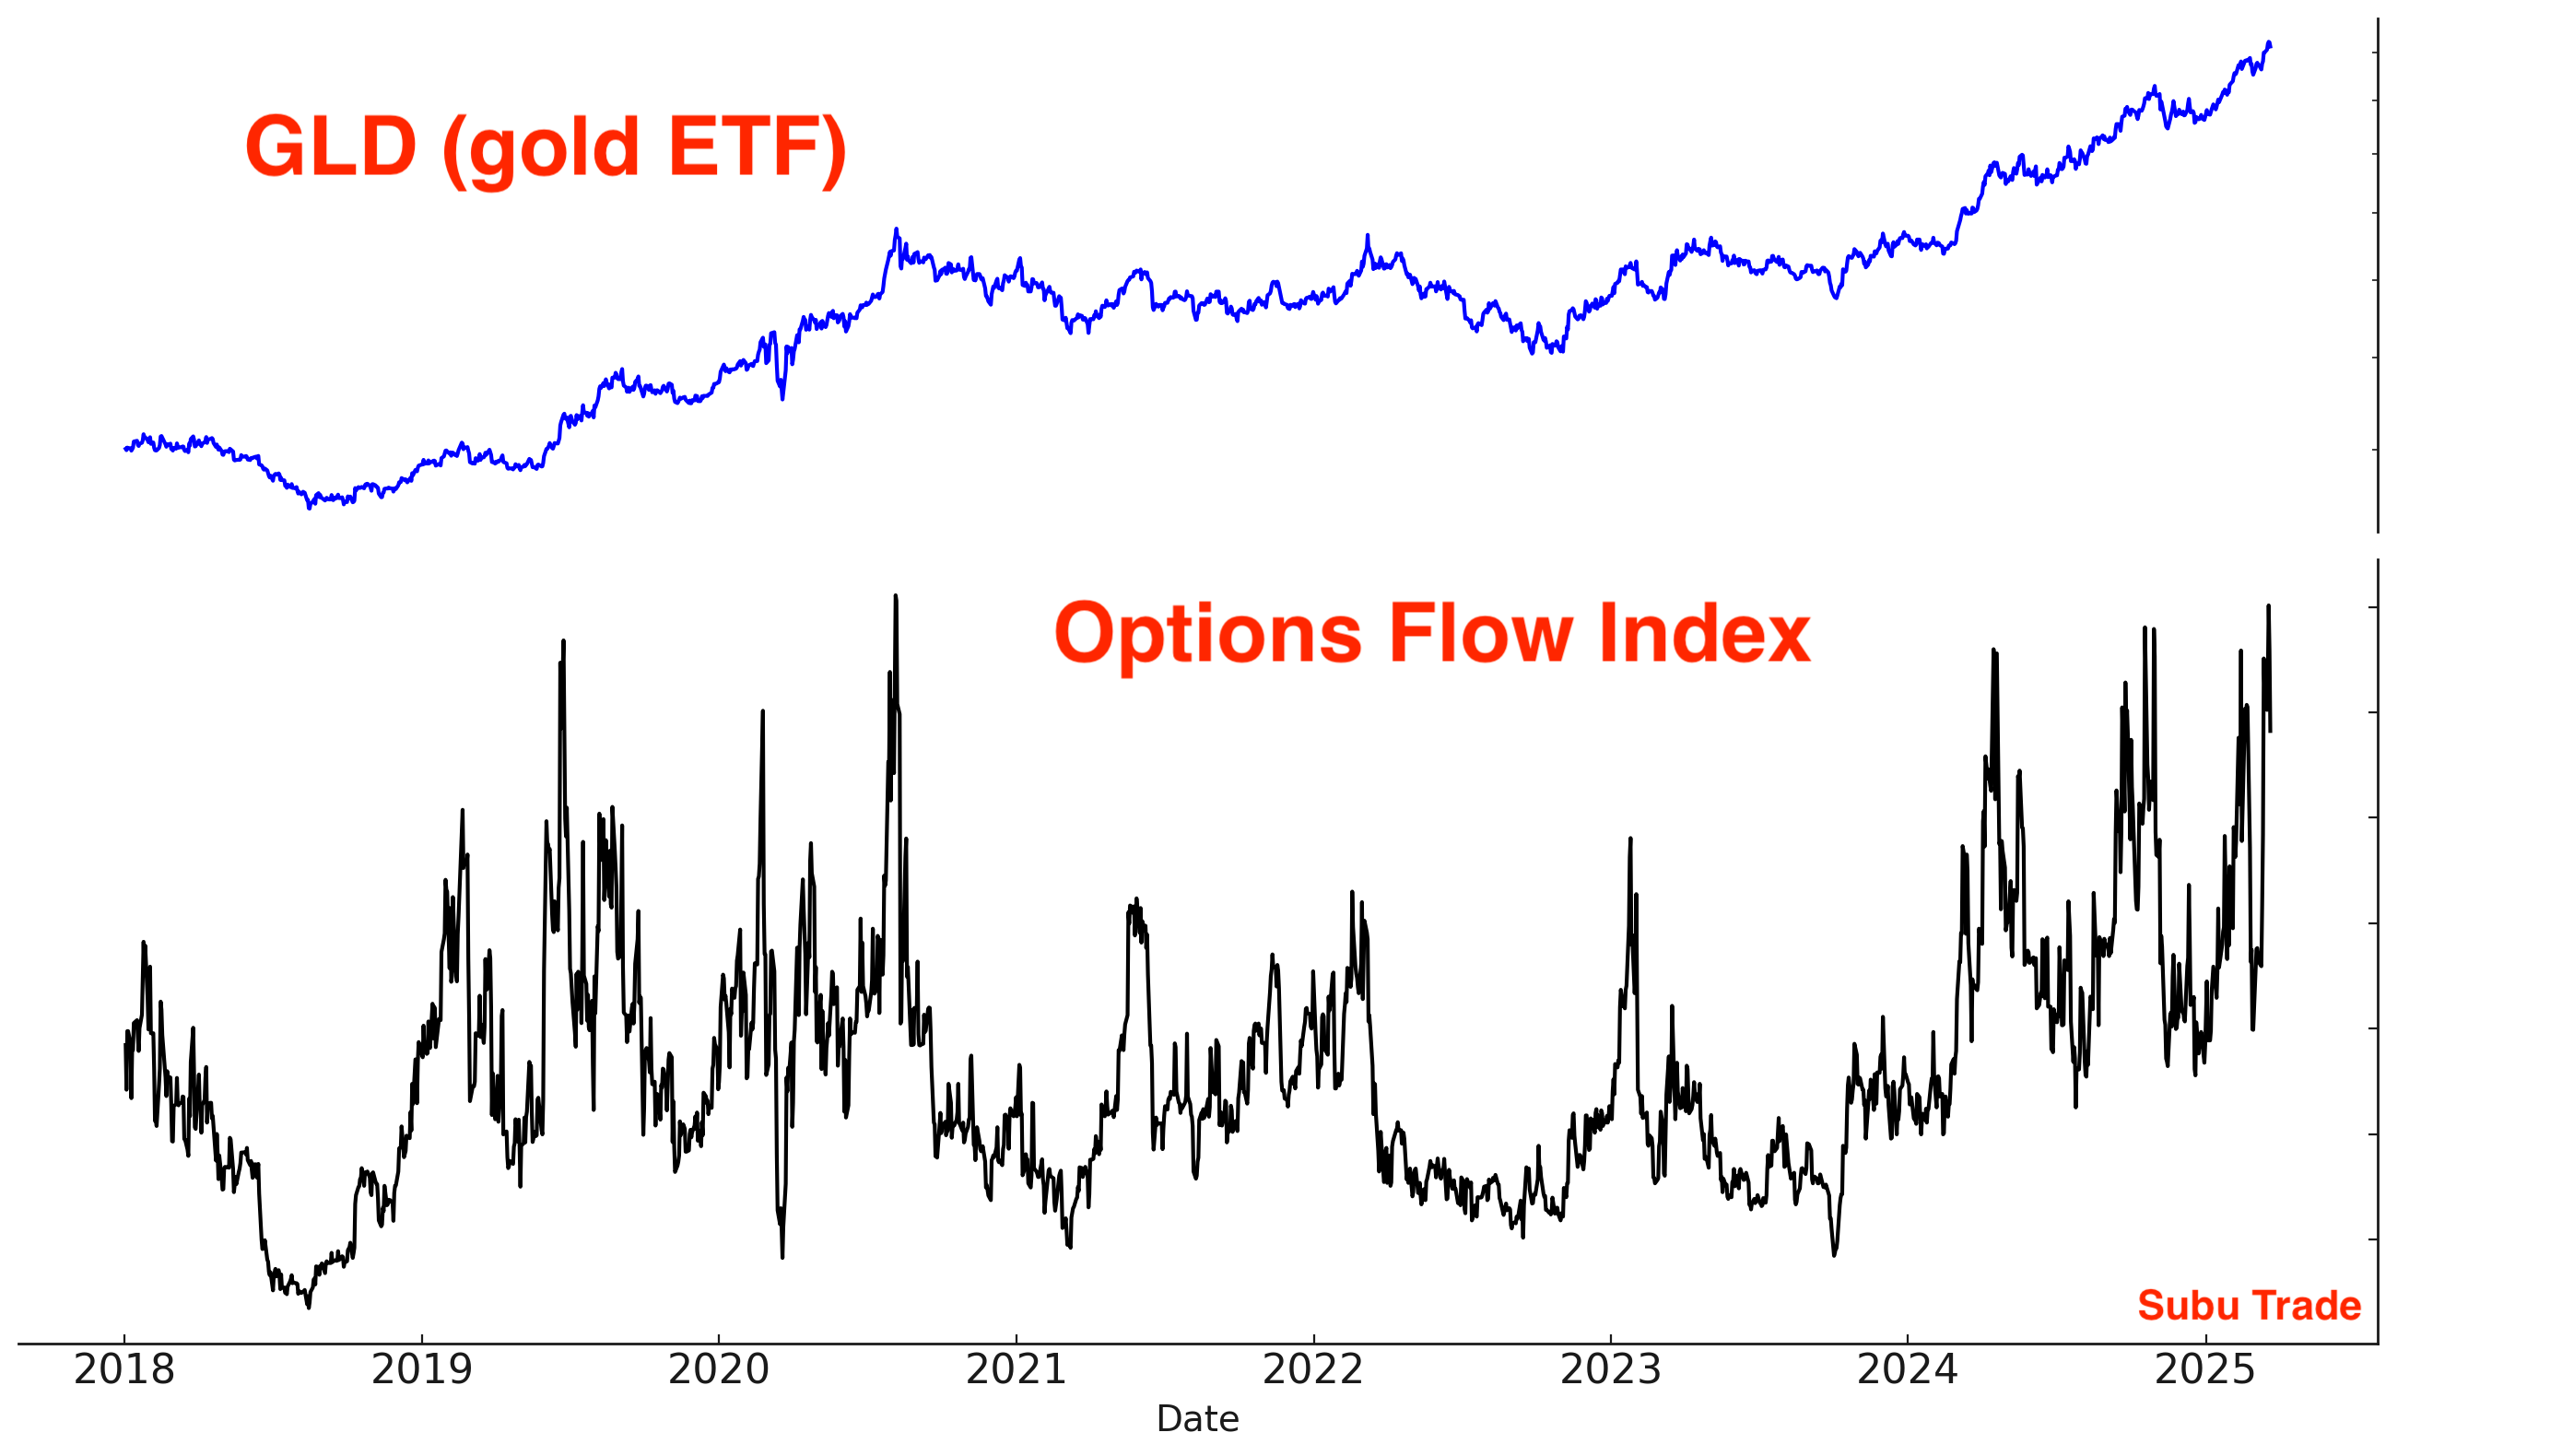
GLD options flow jumped:
GDX options flow spiked:
SLV short interest:

I remain long precious metals with a trailing stop loss, but the odds of a pullback are increasing. On the other hand, if precious metals rally more, I will sell.
Bonds
Currently, I hold no strong conviction toward bonds.
Know what you know, and more importantly, know what you DON’T know. Too many people have a strong opinion on everything.
Overall, I expect bonds to swing within a range in 2025. I do not expect a strong trending environment.
However, a sustained economic slowdown could trigger a substantial rally in bonds. Long bonds offers an asymmetric risk/reward trade:
If the economy does not continue to slow down, bonds may fall but not significantly.
If the economy does continue to slow down, bonds will rally significantly.
I have a small long position.
Here’s the 30 year’s Daily Sentiment Index: in neutral territory.
Here’s TLT short interest:

Currencies
The U.S. Dollar is trending downwards:

Here’s the U.S. Dollar’s sentiment: stuck in neutral territory.

I do not have a currencies position.
My Portfolio
Mean-Reversion Position (Non-Core) – Long Oversold Tech Stocks:
Currently at 40% of the potential max size. Targeting AT LEAST a short-term bounce over the next few days/weeks.Black Swan Position – Long Chinese Equities: long with a trailing stop. Risk of a correction is increasing.
Core Position – Long Gold and Silver: long with a trailing stop. Risk of a correction is increasing.
Mean-Reversion Position (Non-Core) - Long Indian Equities: Was extremely oversold, mean-reversion rally is now underway.
Mean-Reversion Position (Non-Core) – Long U.S. Treasury Bonds: Small position size.
This content is for informational purposes only and is not financial or investment advice. I am not a licensed financial advisor. Trading involves risk, and past performance does not guarantee future results. You are responsible for your own financial decisions, and I am not liable for any losses.