
Markets Report: is the worst over for stocks?
We're in Phase 3 of the bottoming process.

The stock market is in a bottoming process. As I wrote in last week’s Markets Report:
Market bottoms often involve choppy price action instead of a V-shaped recovery back to all-time highs. Crash+pullback patterns happened during the 2016, 2015, 2011, 1998, and 1987 crashes. In contrast, V-shaped recoveries to new highs—like those in early 2019 and post-COVID 2020—are less common.
This week saw heightened volatility and indecisive price action. All of this remains consistent with a market still working through the choppy bottoming process.
My Portfolio:
*Click here if you don’t understand how I trade
Mean-Reversion Position – Long Oversold Tech Stocks: Currently my largest position. Targeting a mean-reversion rally. I will increase my position size if the market pulls back.
*A rally in stocks could also push Bitcoin higher.
Mean-Reversion Position - Long Silver: SOLD, Position exited. The risk of a correction in gold is elevated, which could pull silver lower.
Mean-Reversion Position (Non-Core) - Long Indian Equities: Big beneficiary of U.S.-China trade war. Increased position size.
Mean-Reversion Position (Non-Core) – Long U.S. Treasury Bonds: Small position size, irrelevant for my P&L.
U.S. Equities
The typical post-crash bottoming process tends to follow this sequence:
A sharp market collapse
A swift relief rally
A secondary pullback, retracing 61.8%-100% of the relief rally
Then, the foundation is set for a sustained recovery
We are currently in Phase 3, the pullback phase.
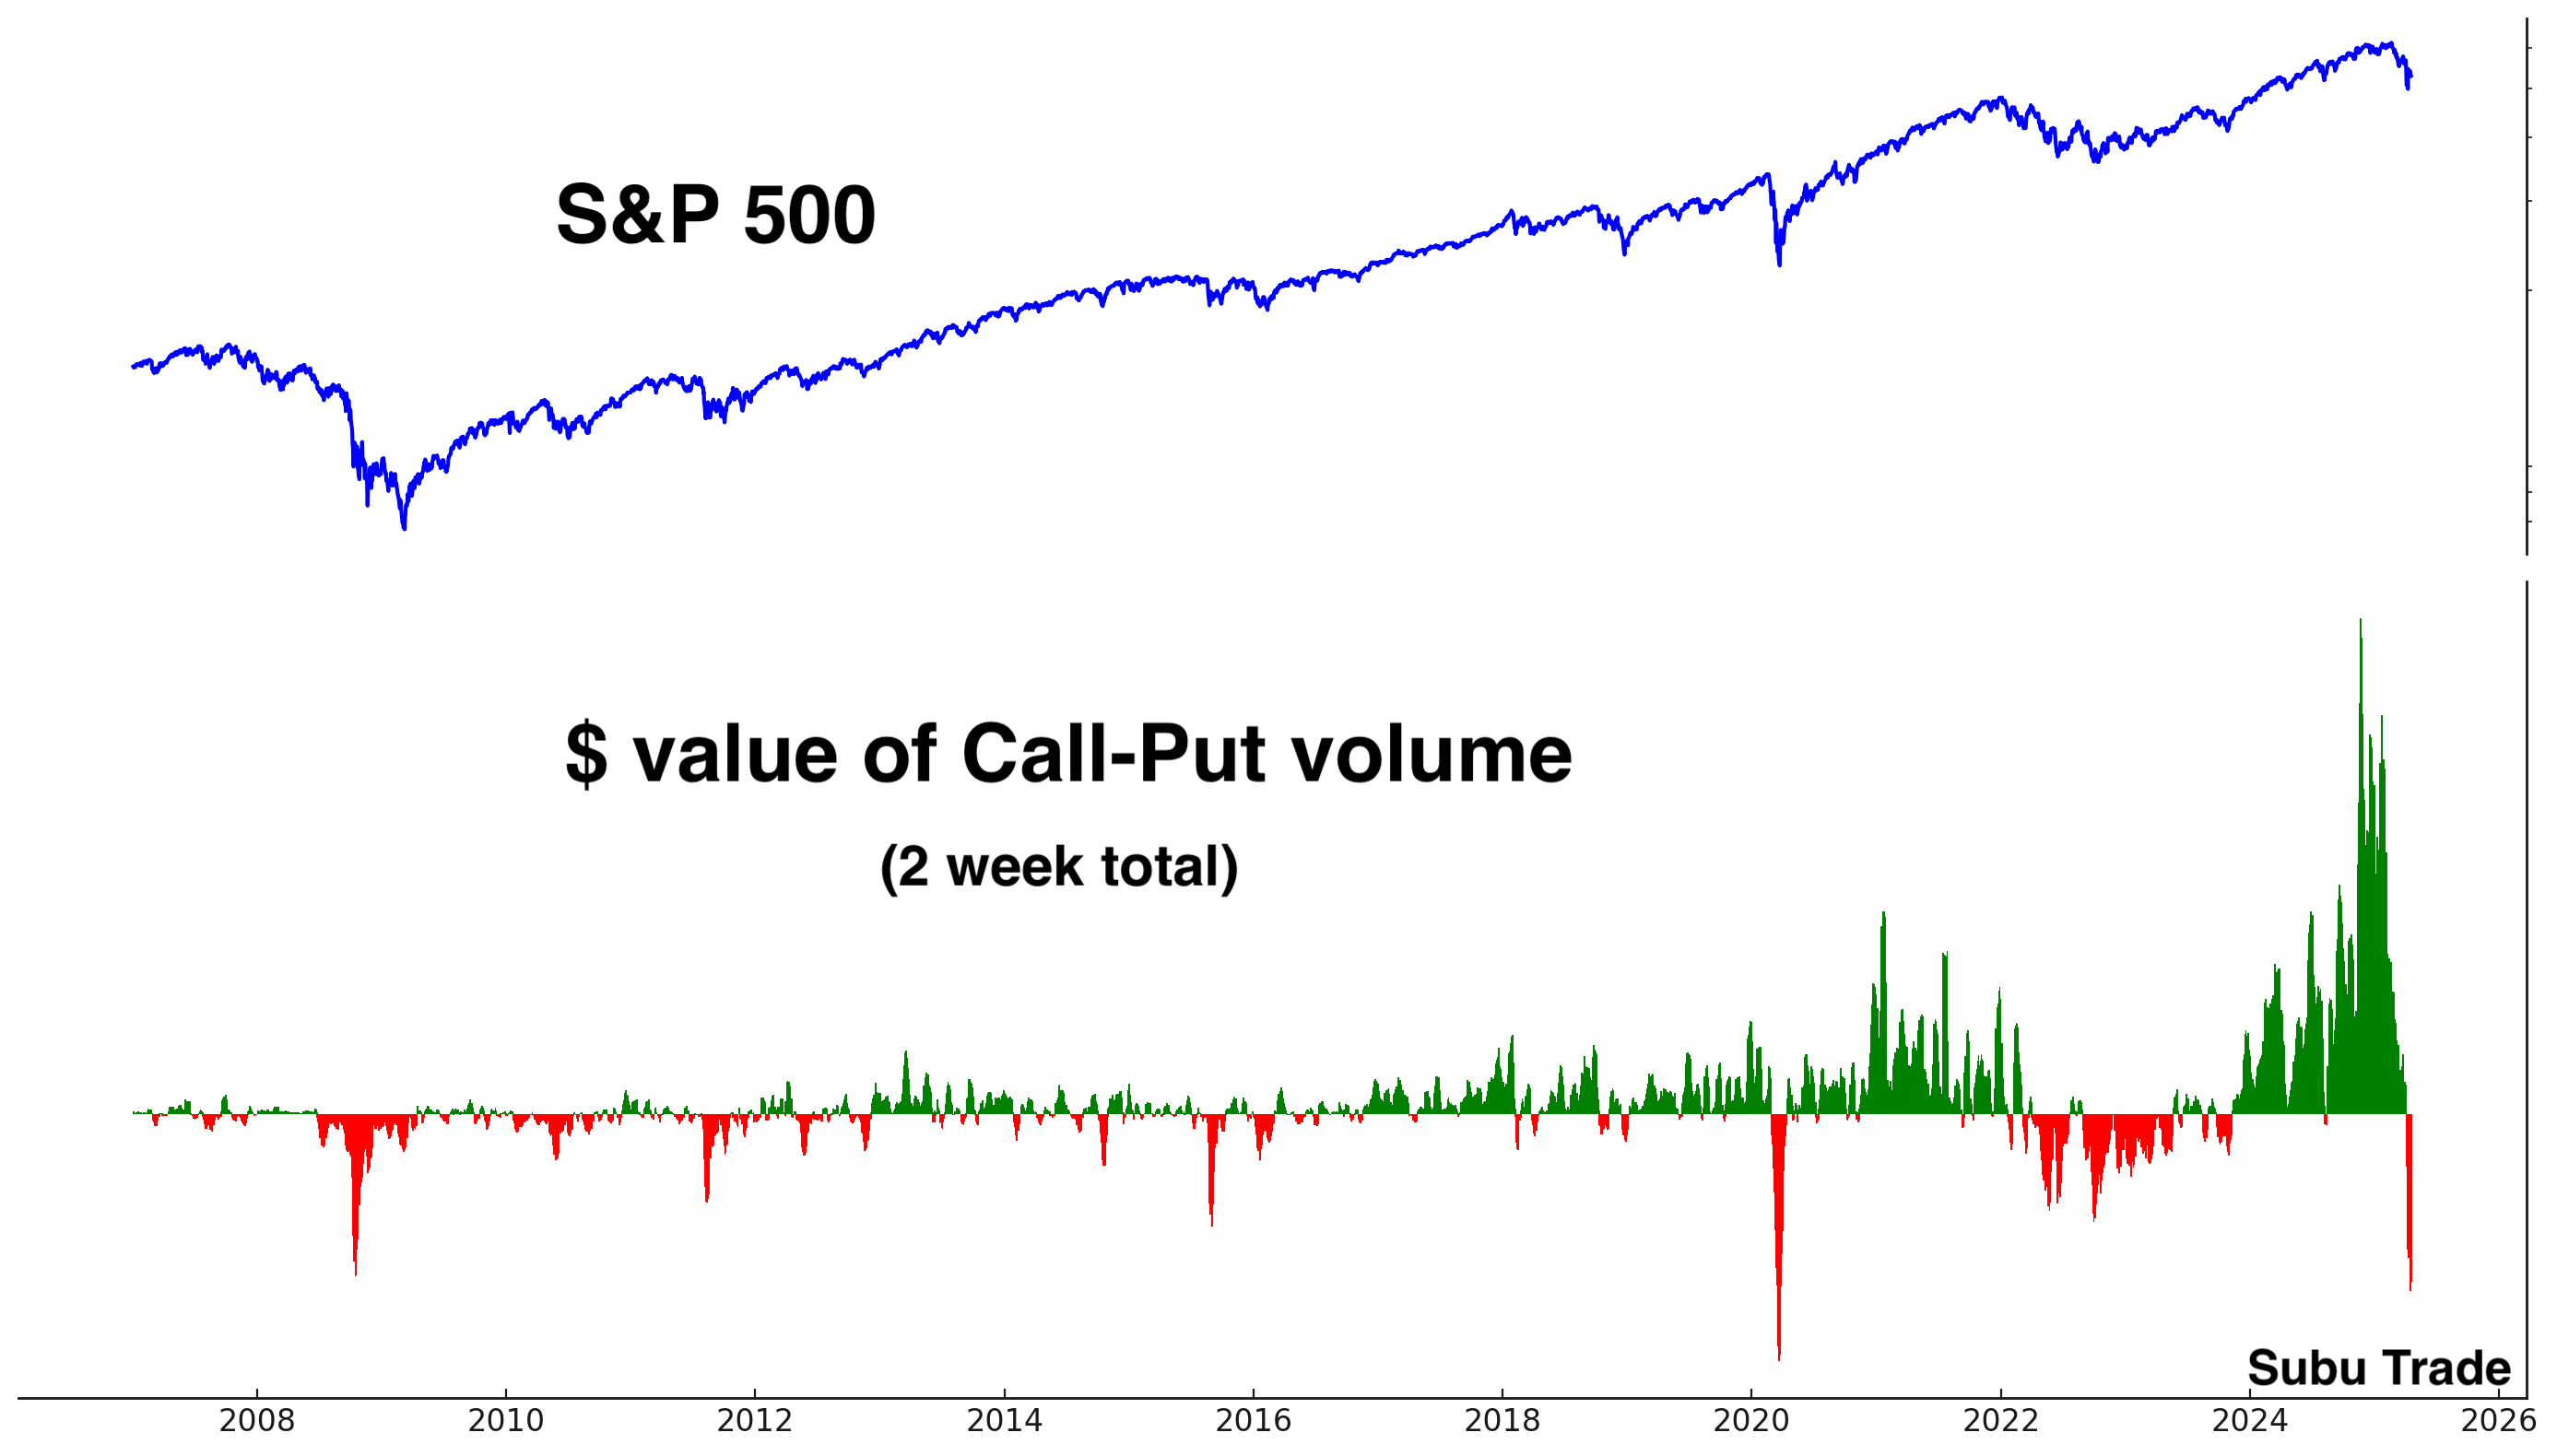
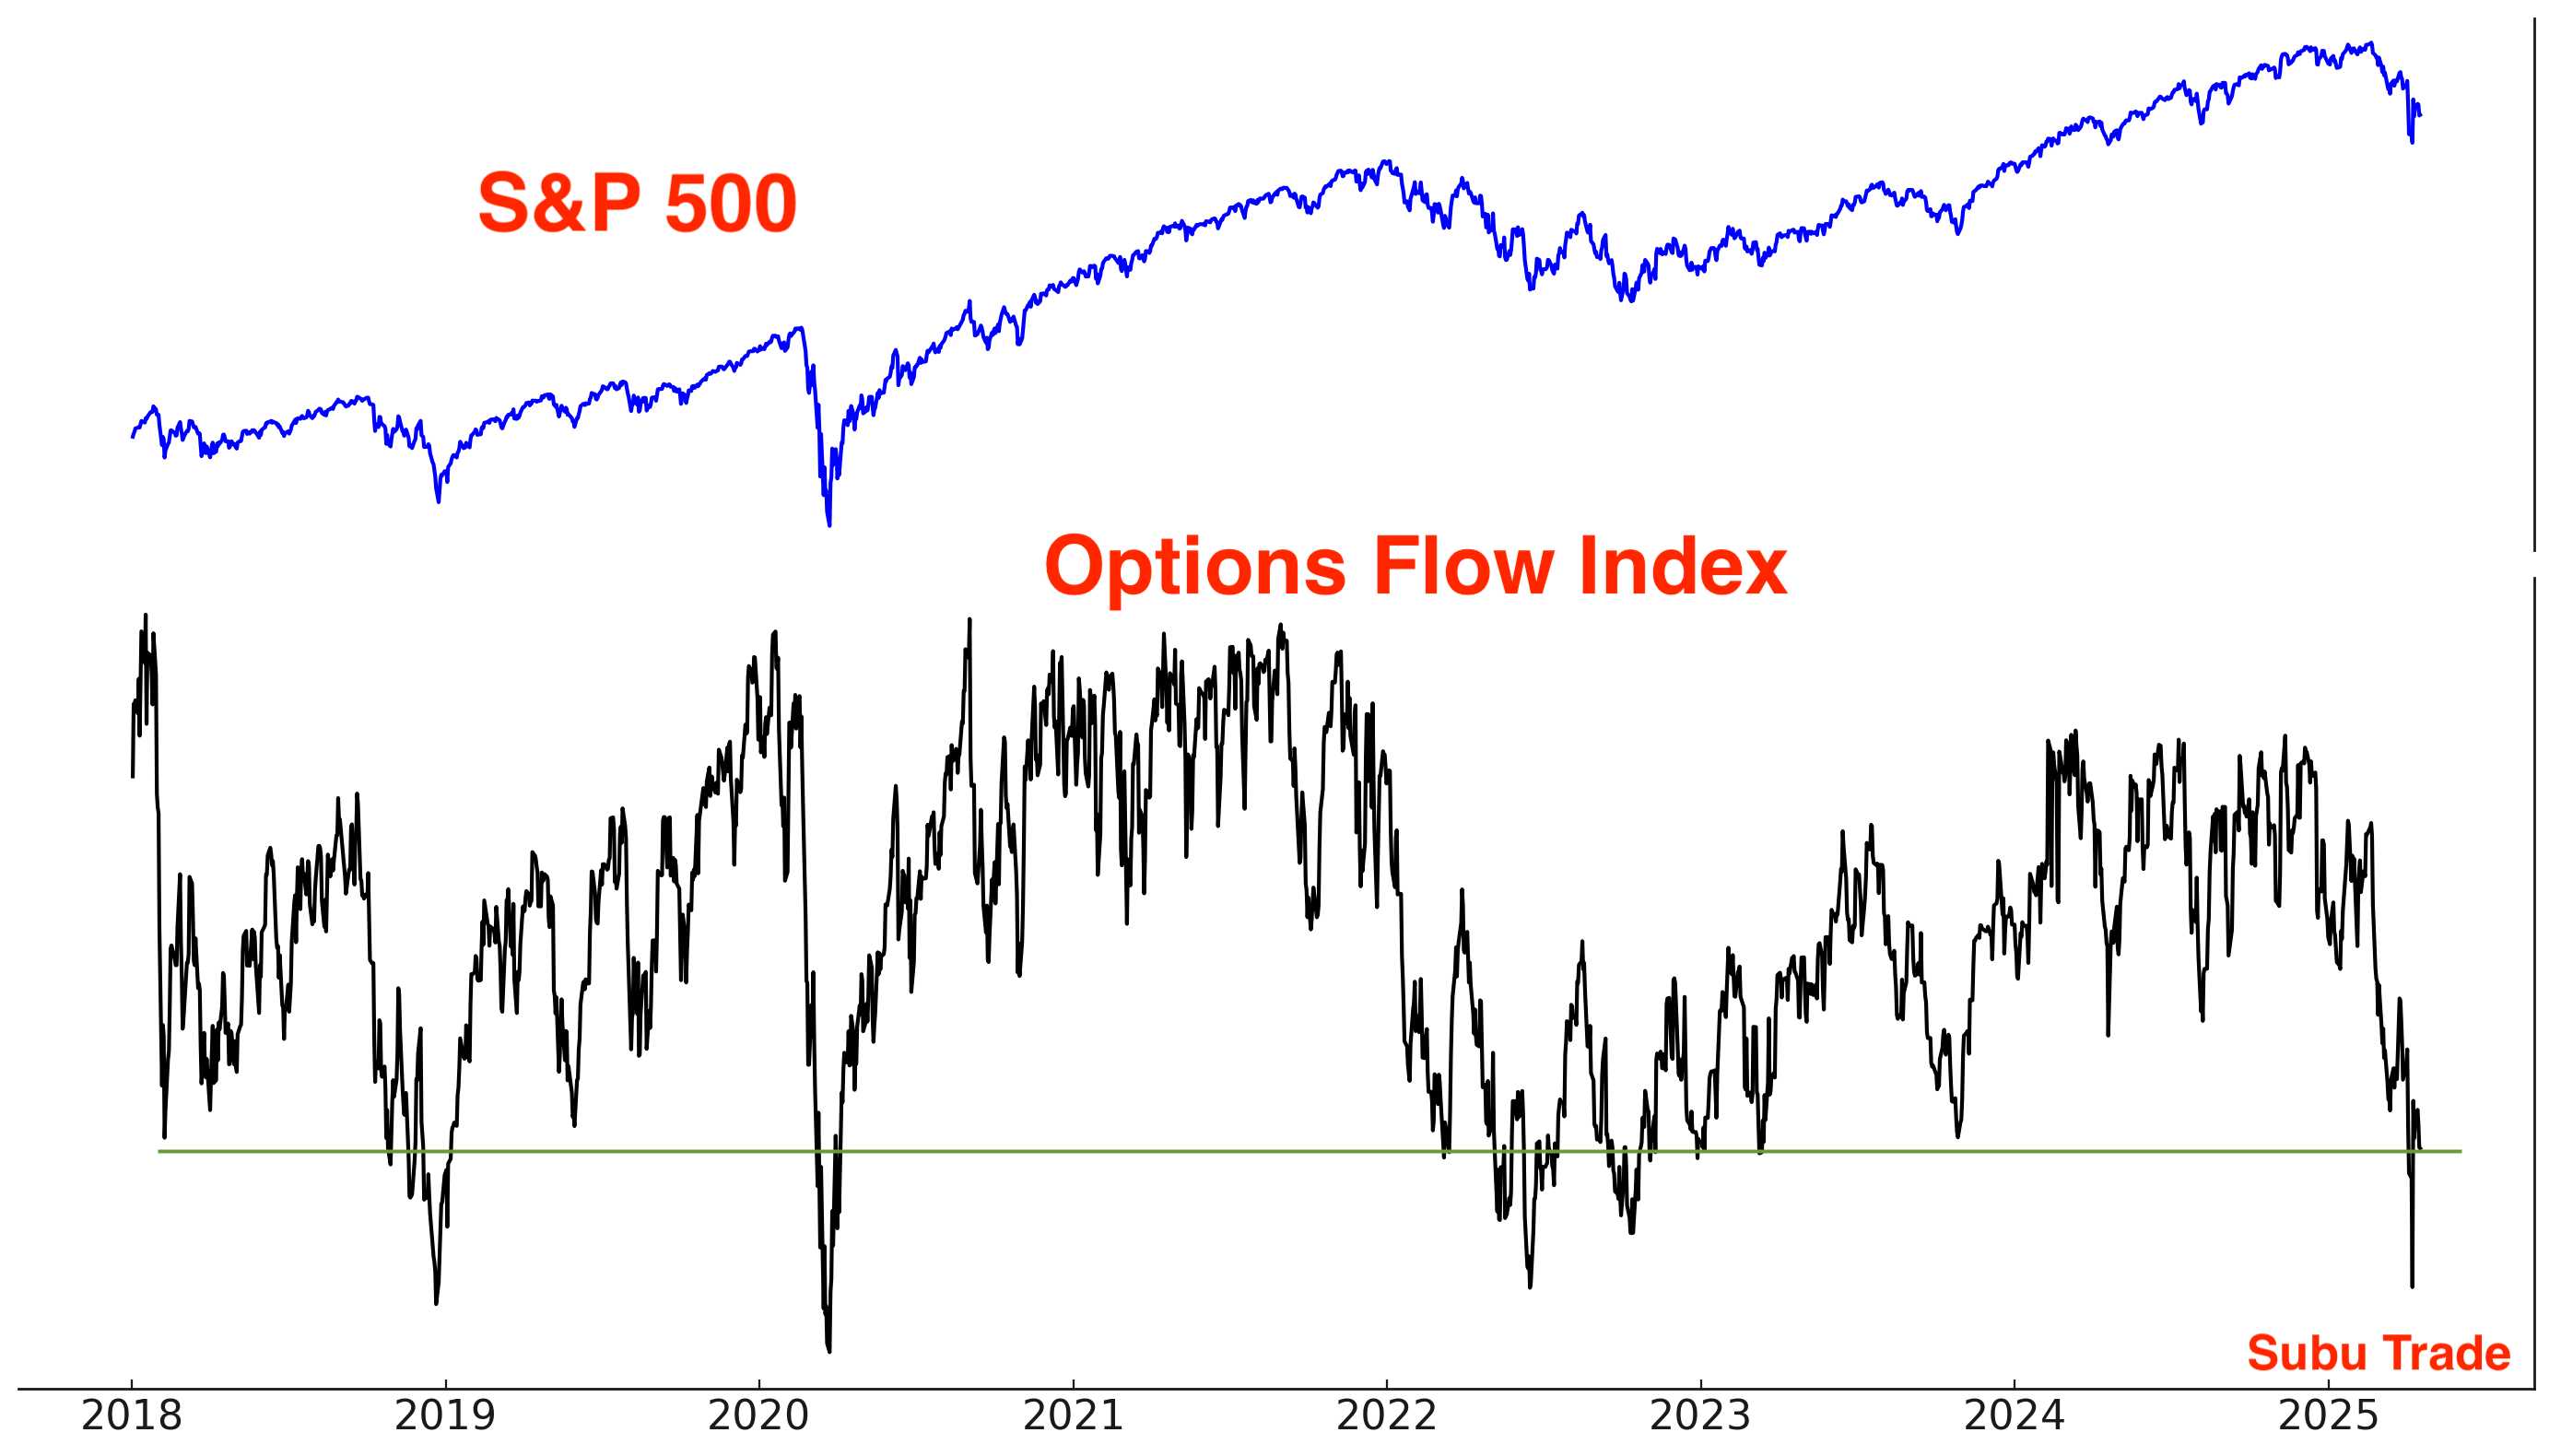
Options
The dollar value of S&P Call-Put volume has plunged:
S&P 500 Options Flow Index is recovering:
Volatility
VIX closed below 30 for the first time in more than 2 weeks. Historically, this could be followed by a short term pullback, but the S&P was higher 93% of the time 1 month later:

Breadth
% of S&P 500 stocks above their 200 and 50 day moving averages:

With stocks trying to bottom, the % of oversold stocks has fallen from more than 50% to almost 0%:

After a huge spike in the % of stocks below their lower Bollinger Bands, this figure fell to 0% on Monday:


Sentiment Surveys
Investors Intelligence Bulls is still quite low, at 25.9%:

AAII Bears are at 56.9%:

This is the 8th consecutive week with more than 50% bears, which is a record:

The NAAIM Exposure Index finally fell:

This NAAIM # was not bullish for stocks during the 2007-2009 bear market. But after the GFC, this has been a bullish sign for stocks over the next 2-3 months:

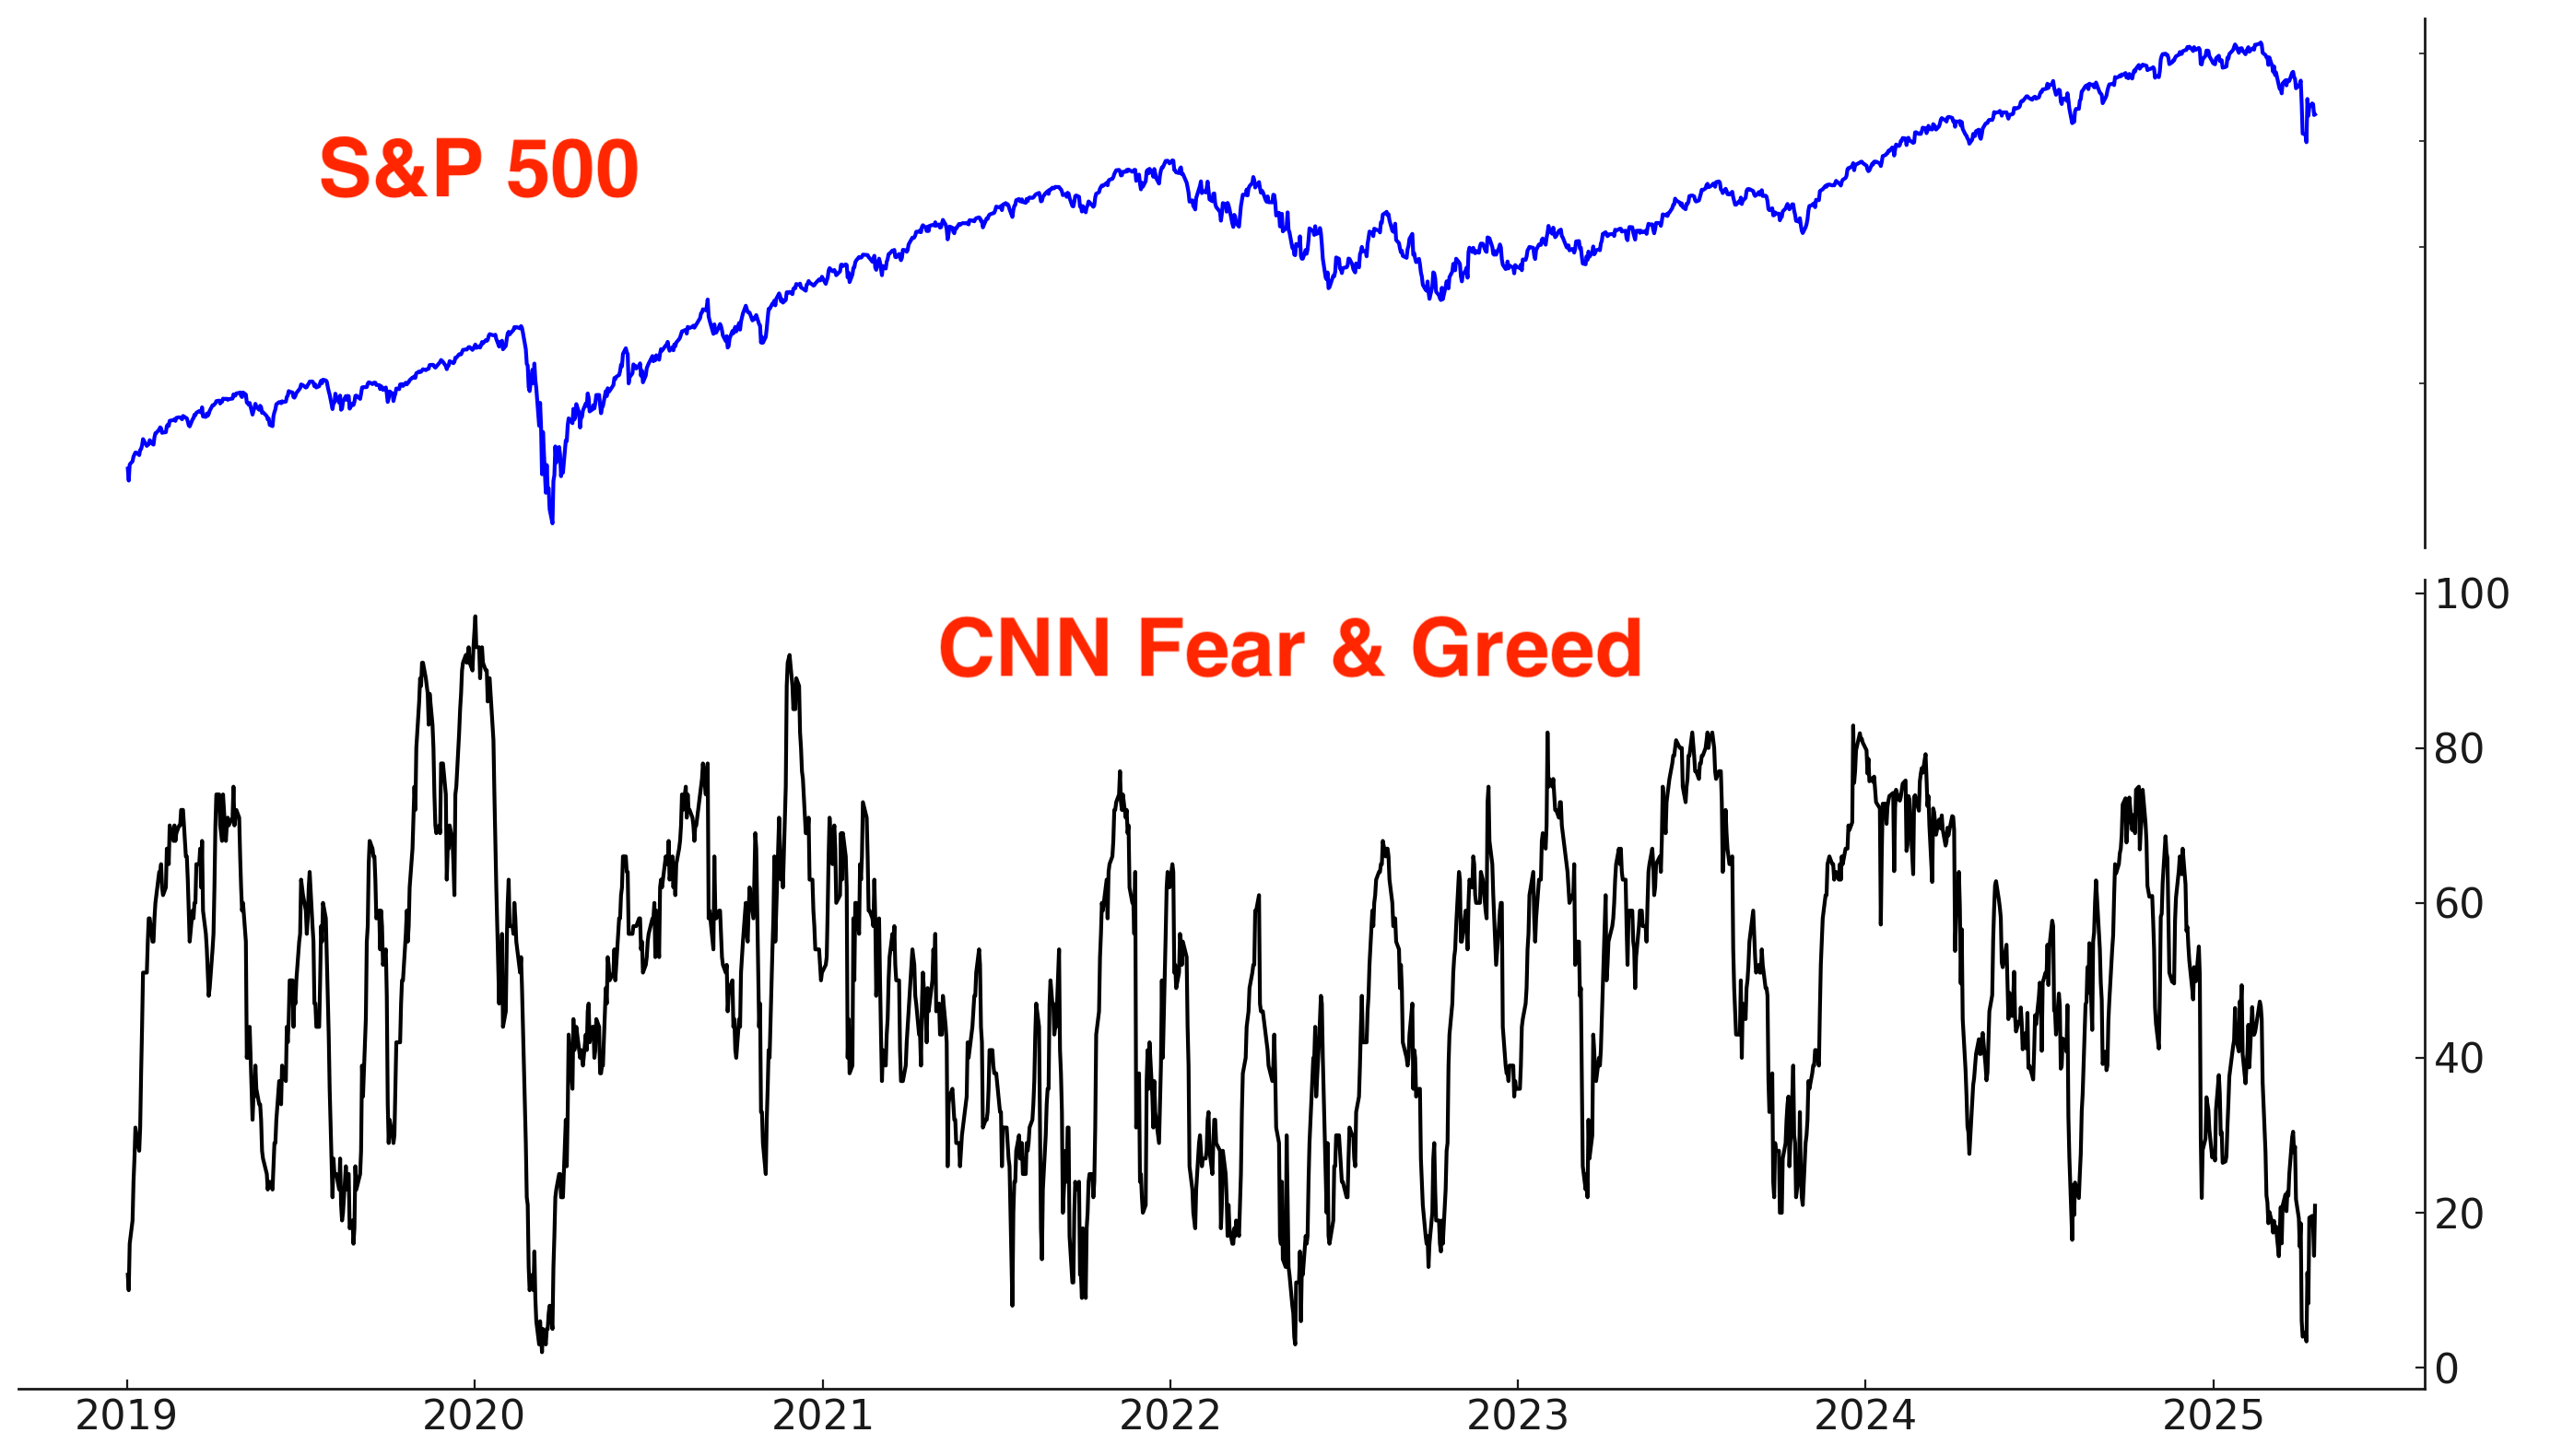
Other Sentiment
The S&P 500’s Daily Sentiment Index is re-bounding from extreme pessimism:

CNN Fear & Greed is also starting to re-bound from extreme pessimism:
Earnings Revisions
Here is Citigroup’s U.S. Earnings Revision Index. A significant increase in negative earnings revisions is currently underway, largely driven by trade tensions and tariffs. The last comparable decline occurred during the COVID-19 crash:
Insider Trading
Corporate insiders have been notably absent as buyers during the recent market decline—a sharp contrast to the COVID crash, when insider buying surged. This hesitation may reflect concerns about the long-term economic impact of tariffs or unease over elevated stock valuations:

Fund Flows
Volatility traders typically take profits and reduce exposure to VIX ETFs during volatility spikes. They are currently unwinding VIX positions at the fastest pace since COVID:

Trend
The trend is your friend, until it ends. The U.S. stock market is still trending down:
Why does this matter? Because at least from a trend following perspective, it’s better to buy when the market is trending Up (e.g. above its 200-DMA) than when the market is trending Down (e.g. below its 200-DMA). This doesn’t mean that the market can’t rally from below it’s 200-DMA. It simply means that risk and volatility are higher down here.

Bottomline: the stock market is in a bottoming process, and this level of volatility is normal. Choppy bottoms are more common, while V-shaped bottoms are less common.
Looking at the past
Market bottoms are usually choppy. This doesn’t mean that markets MUST re-test the bottom: a 61.8%-100% retracement is often enough.
S&P in 2015 and 2016:

S&P in 2011:

S&P in 2010:

S&P in 1998:

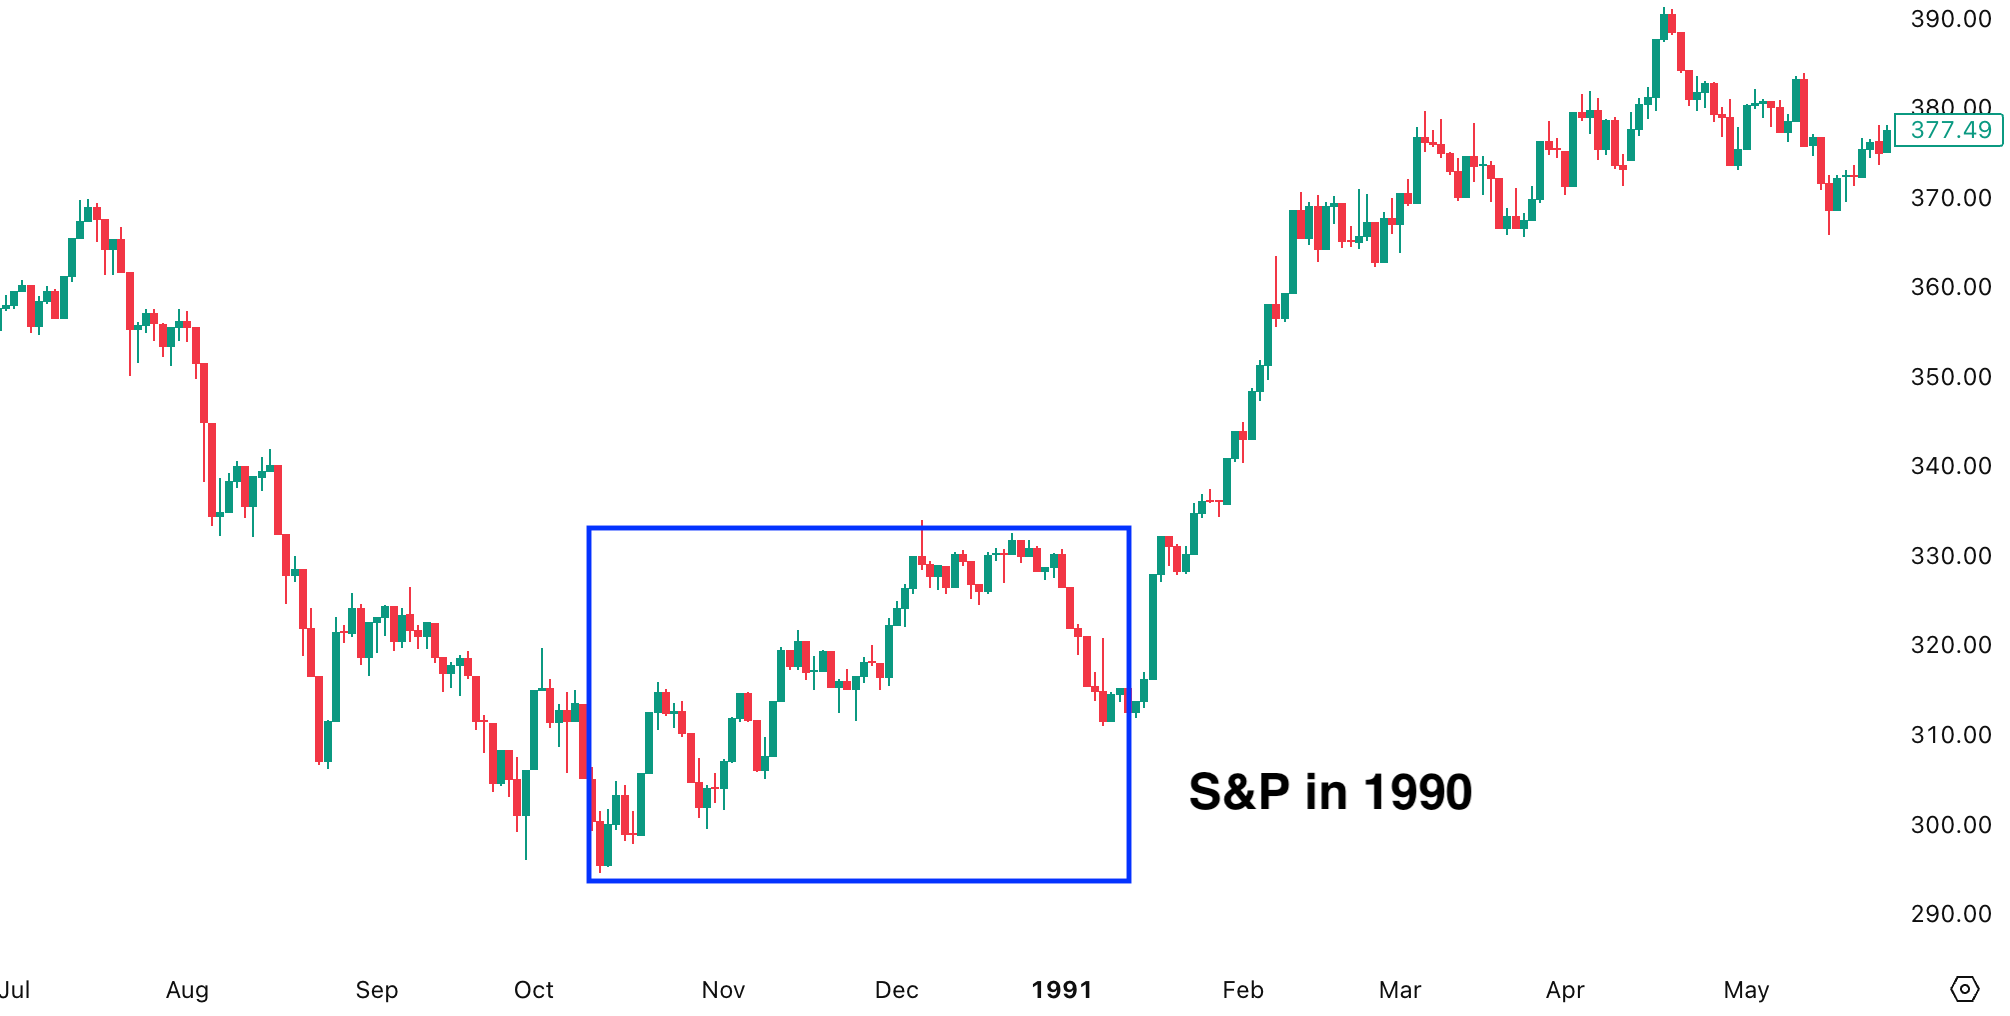
S&P in 1990:
S&P in 1987:

Markets don’t usually rally straight back to all-time highs without pause. V-shaped bottoms typically require significant policy support. If Trump makes a deal and reduces tariffs on China, that could help trigger a V-shaped recovery.

S&P in 2018:

Gold & silver
Theme/narrative:
Gold has rallied in recent months on a clear theme/narrative:
Global central banks (e.g. China) are buying gold because they fear holding U.S. Treasuries that could be confiscated in a geo-political conflict (e.g. economic/trade wars). As the U.S. ratchets up trade pressure on allies and foes, expect the demand for gold to increase. Here are the annual purchases of gold by central banks:

With gold surging to new all-time highs this week, risk/reward DOES NOT favor gold bulls right now.
Options
GLD Call volume spiked to an all-time high:

More worrisome is the dollar value of those options. Historical spikes marked major tops in gold:

GDX Options Flow spiked as well:

We continue to see strong inflows into gold ETFs such as GLD:

Gold remains firmly in an Up trend. The trend is your friend, until it ends:
Sentiment remains elevated:

The risk of a correction in gold is rising, and as a result, I’ve exited the remainder of my long SLV position. Silver is caught between 2 conflicting forces:
On one hand, gold’s safe-haven rally has been bullish for silver.
On the other, growing recession fears have pressured industrial metals like copper—impacting silver as well, given its greater industrial exposure compared to gold.
Typically, silver outperforms gold during precious metals rallies. That hasn't been the case this time. If gold begins to pull back, silver may lose the safe-haven tailwind that’s been propping it up.
India & China
I’m bullish on India, and I believe this is the Indian Century. While much of the world is focused on the U.S.-China economic rivalry, few people recognize that India stands to be one of the biggest beneficiaries.
Trump’s tariffs may bring back some high-end manufacturing to the U.S., but they won’t revive labor-intensive manufacturing. Labor in many developing countries costs a fraction of U.S. wages—often just 10%. Labor-intensive manufacturing for textiles, electronics etc. will likely move from China to India.
An often overlooked aspect of the India-U.S. alliance is the “people-to-people” ties. The rapidly growing presence of Indian-Americans in leadership roles across U.S. corporations and the U.S. government creates a natural affinity for working with India instead of China in goods & services trade. To illustrate this point, Vice President JD Vance and his Indian-origin wife Usha Vance are visiting India next week to further cement the U.S.-India alliance.
Breakout
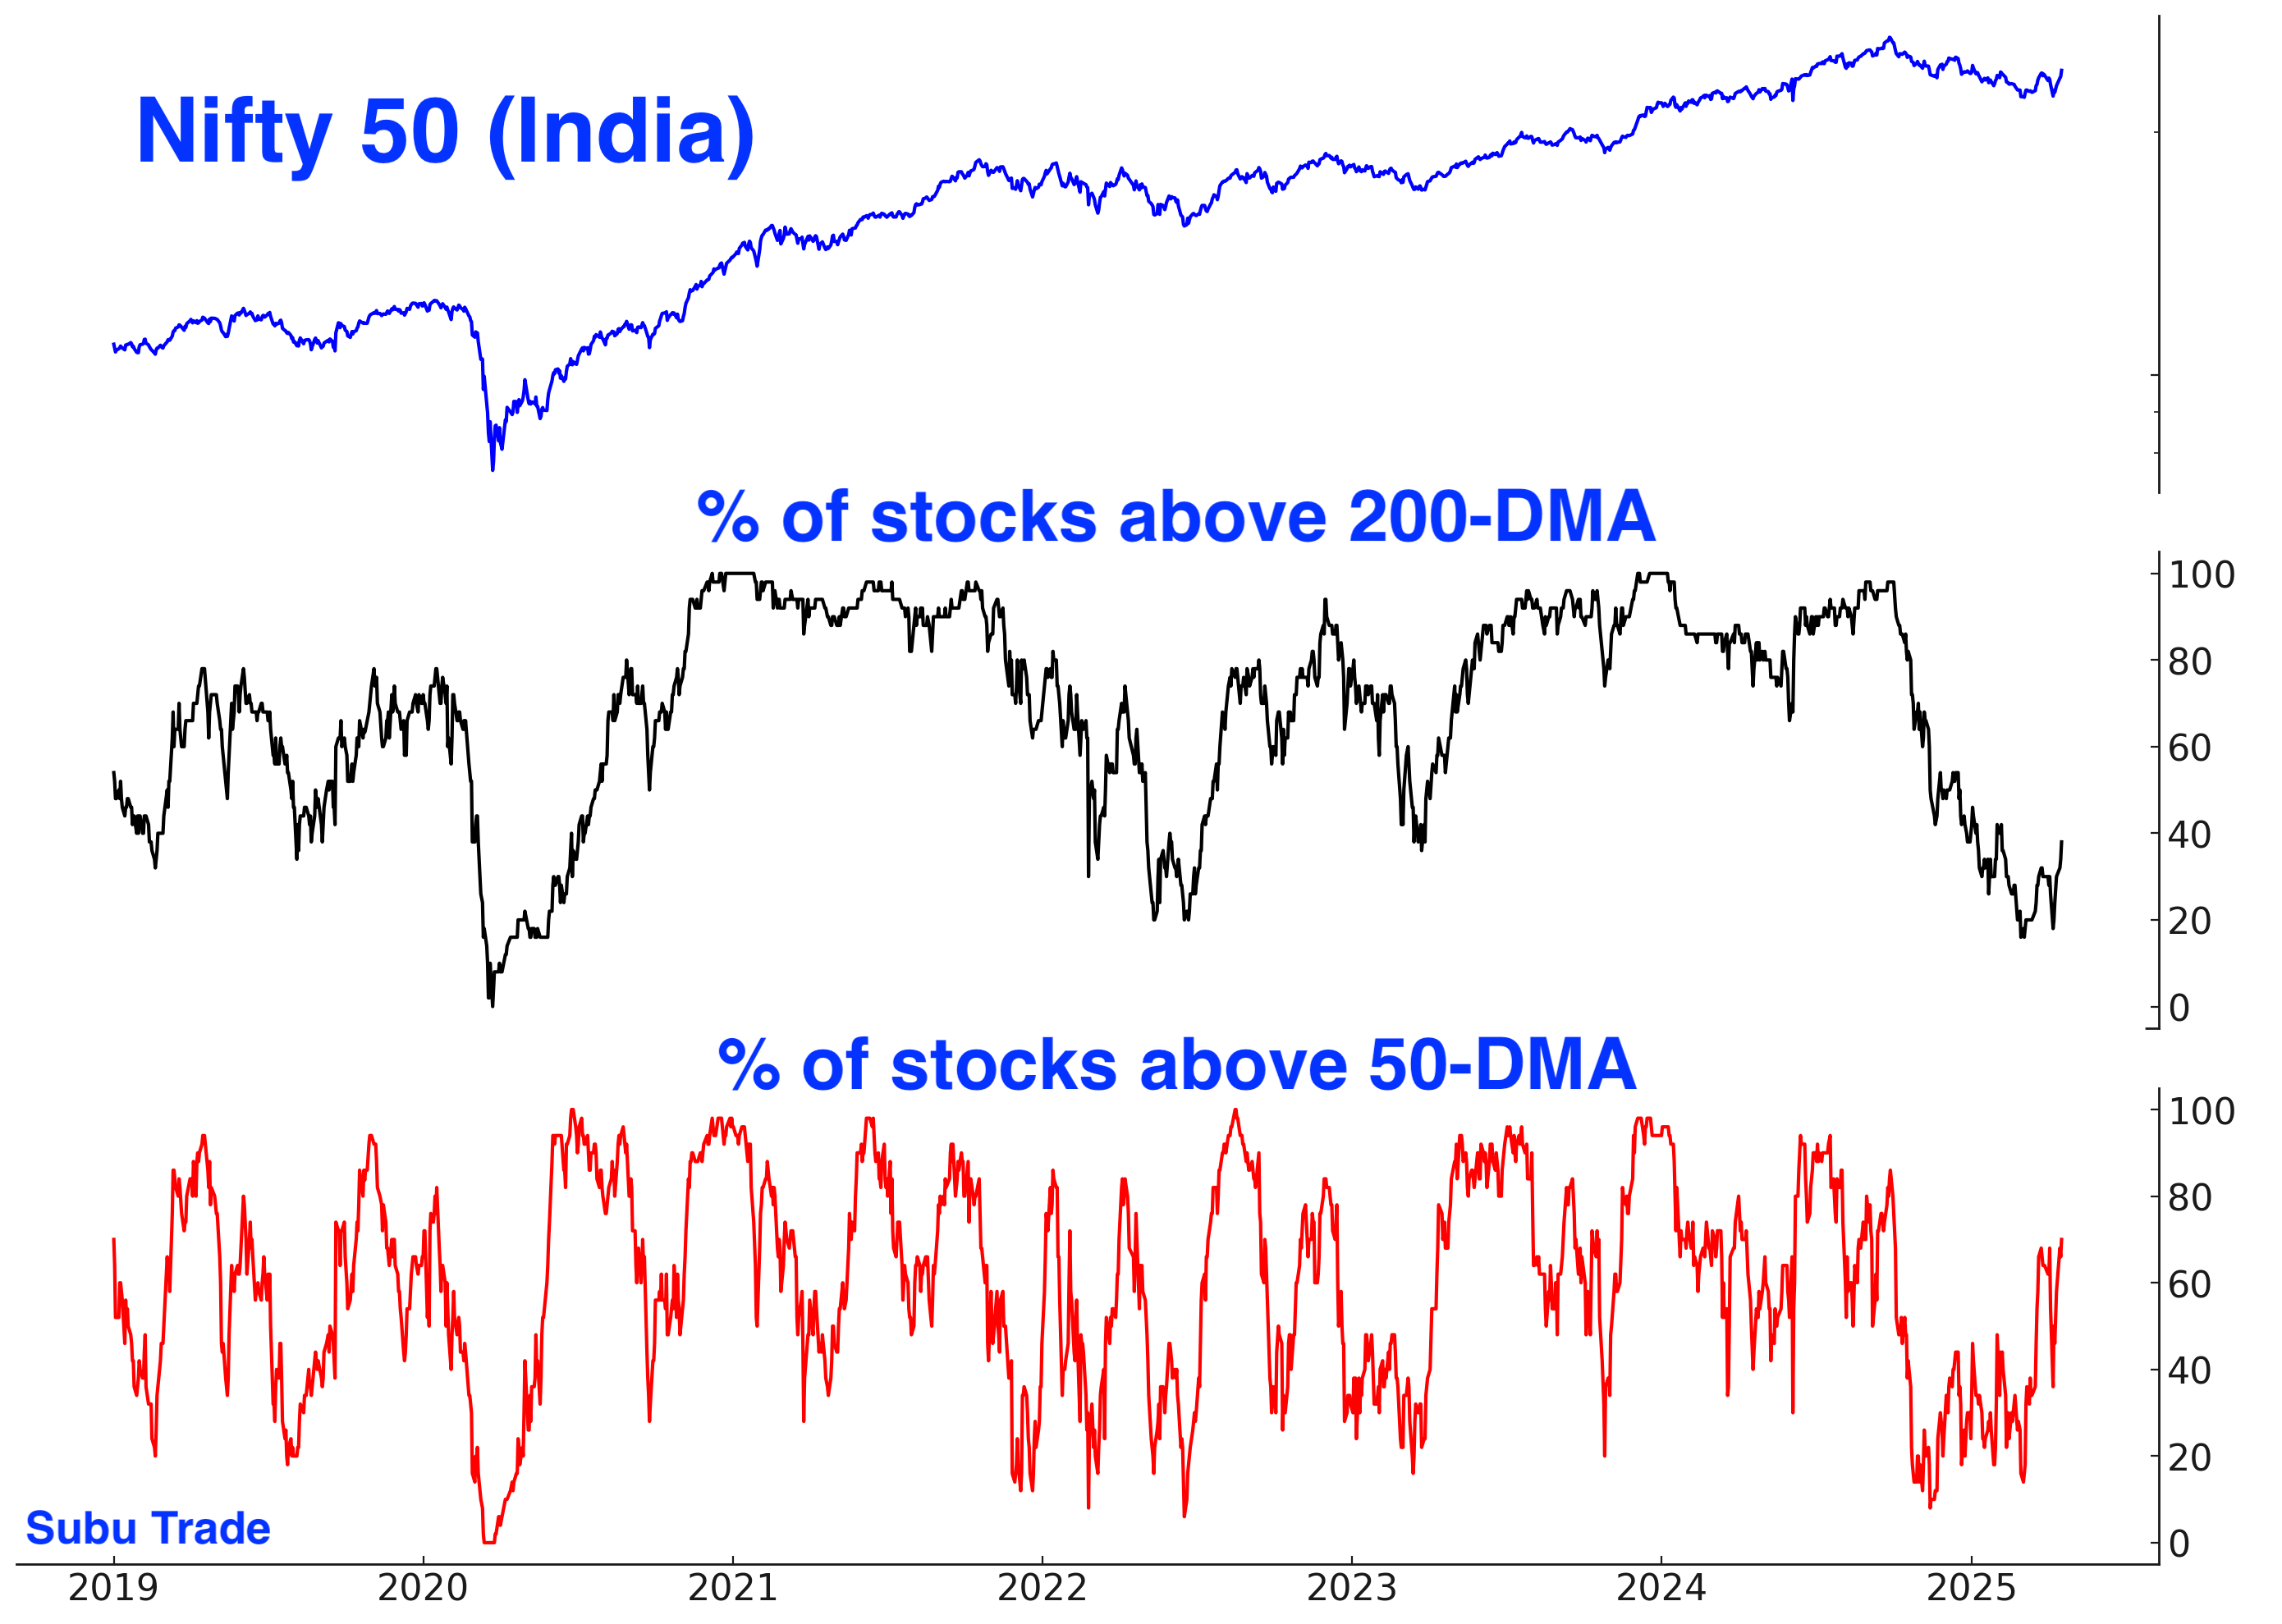
Indian equities could be on the verge of successfully forming a base and breaking out:

India’s trend is starting to turn upwards:
Flows into Indian ETFs:

Breadth
The % of Nifty 50 stocks above their 200 and 50 day moving averages:
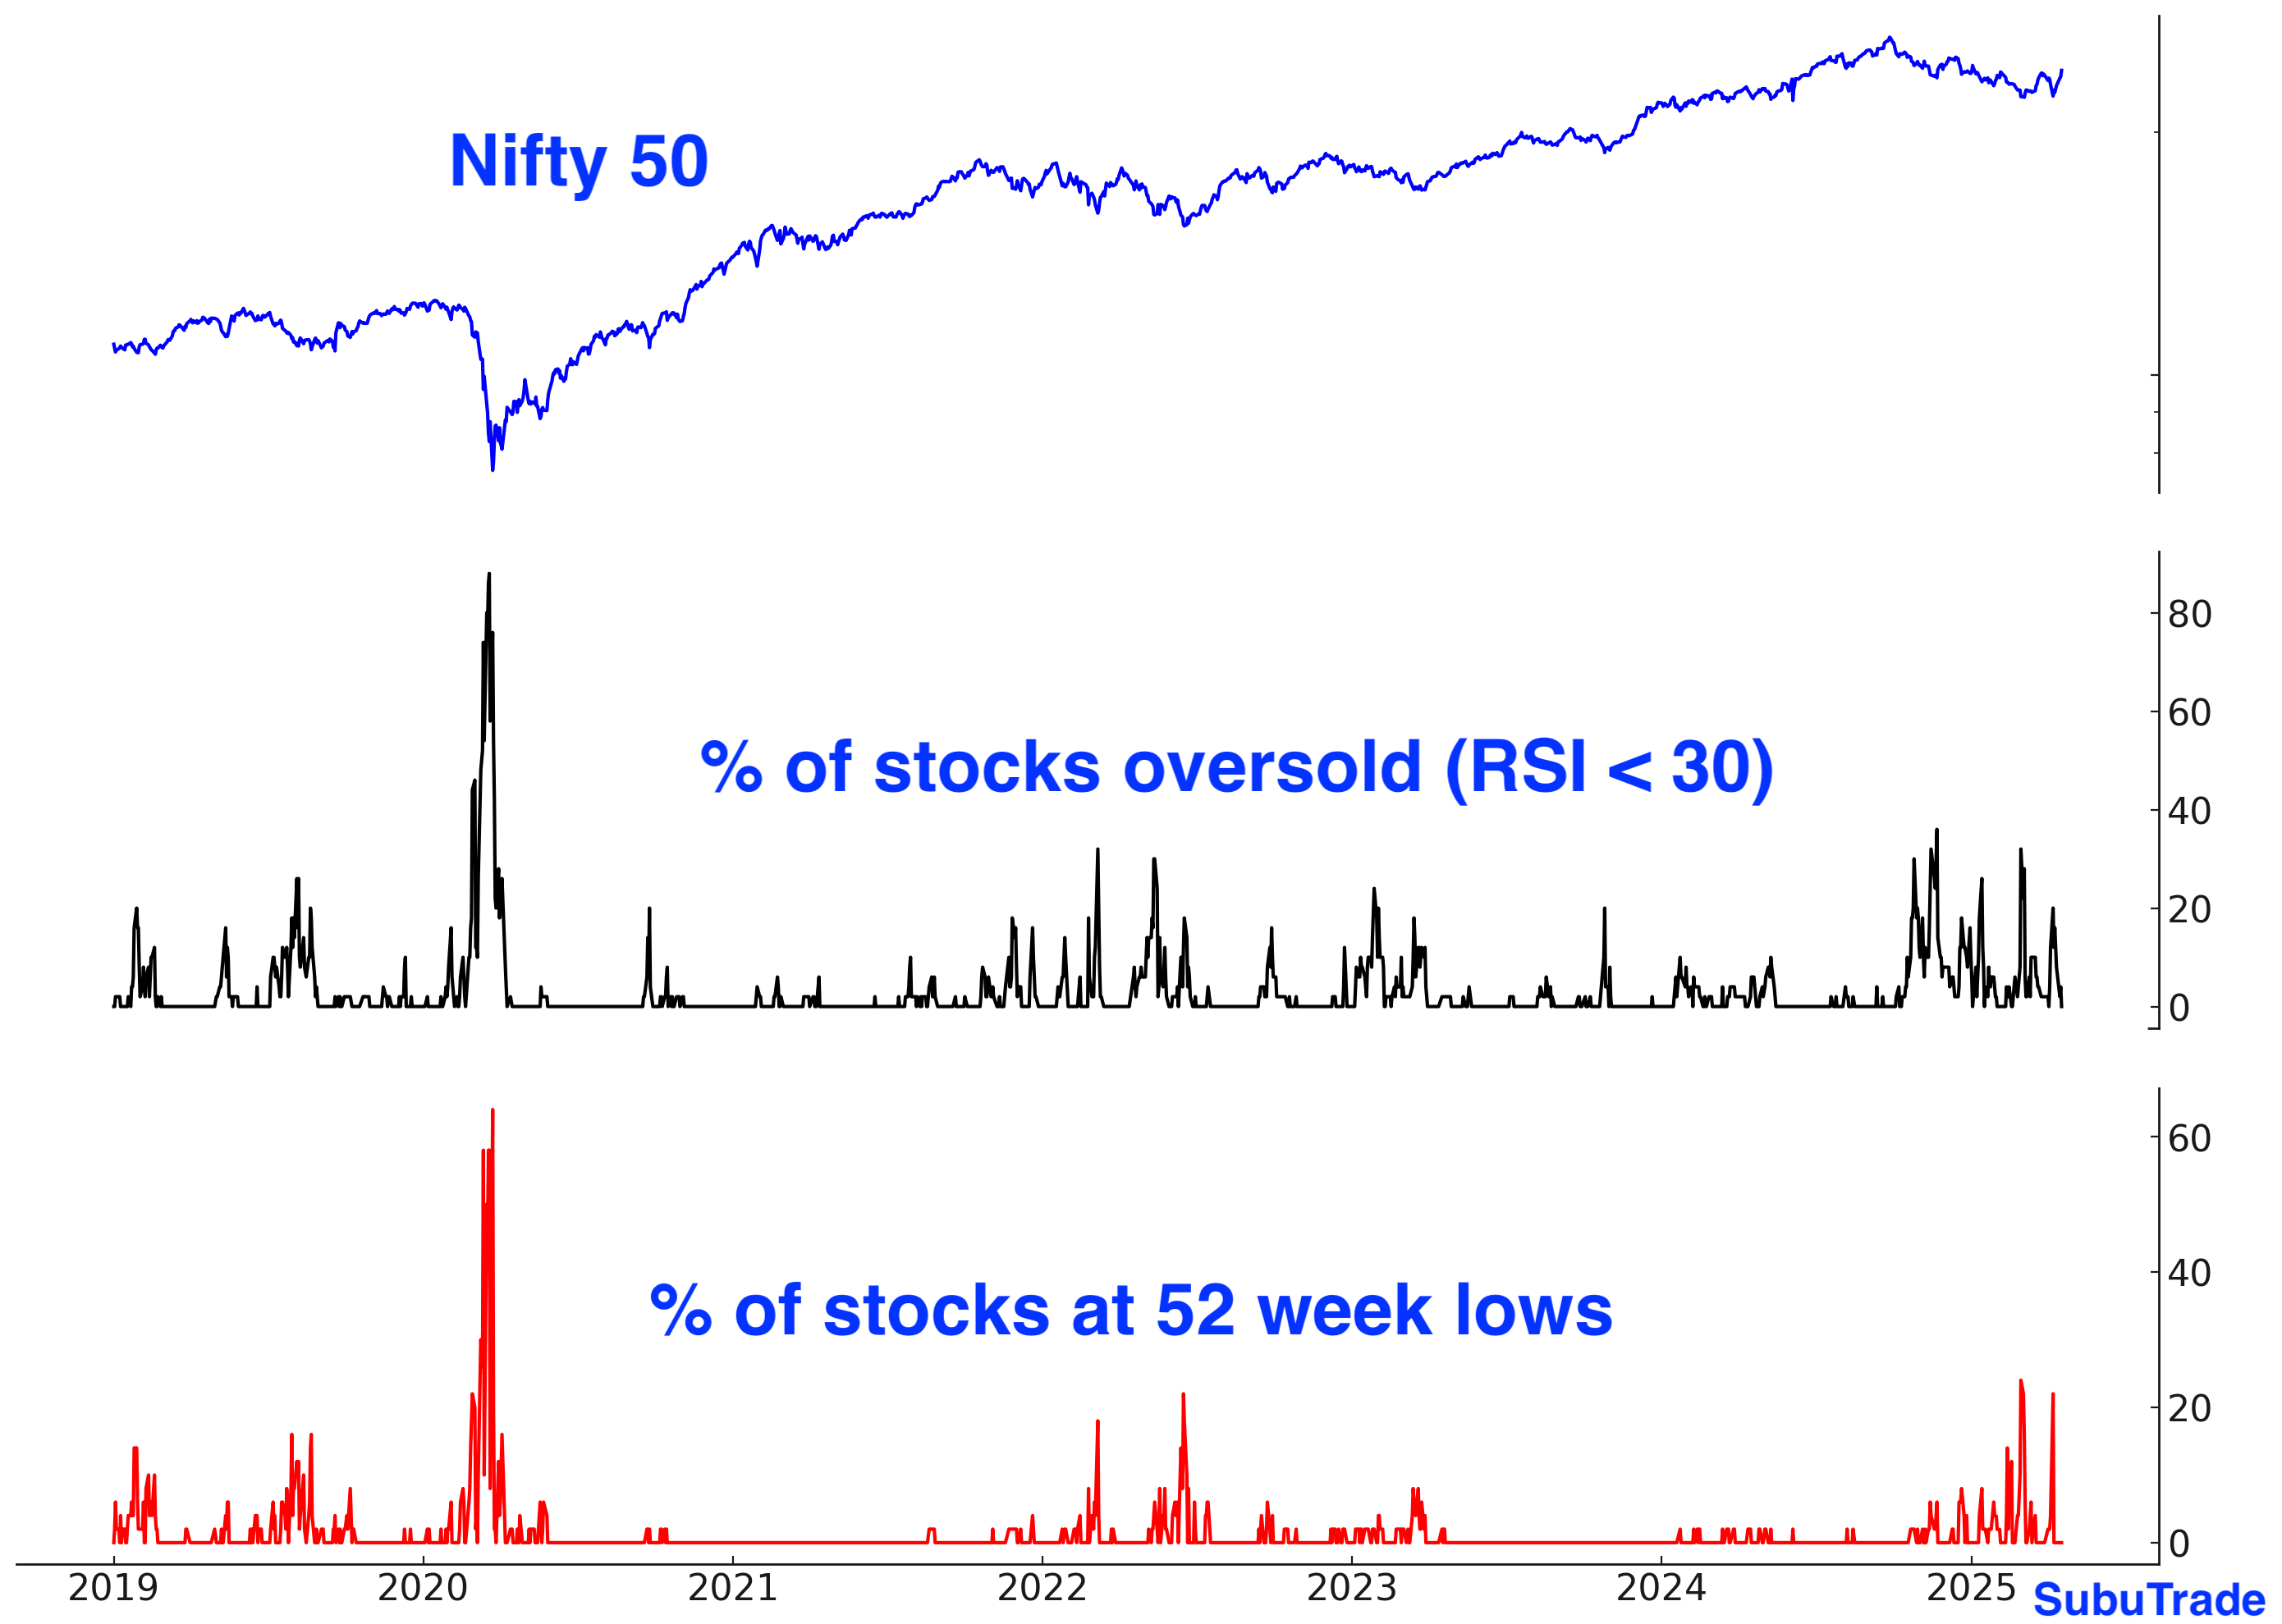
The % of Nifty 50 stocks oversold and at 52 week lows:
China
China is obviously the biggest loser in this trade war. As the world’s largest net exporter, it faces significant challenges when its largest customer—the U.S. —reduces demand. Compounding this, the U.S. is actively encouraging its allies to take a tougher stance against China.
With that being said, this does not preclude the possibility of a short-term rebound in Chinese equities:

Bonds
Theme/narrative
The bond market is being pulled by conflicting forces, making a sustained trend unlikely. The most probable outcome is continued choppy price action within a broad range. Historically, stagflationary environments have not been bullish for bonds.
Bearish:
Tariffs and trade wars are inflationary, driving up consumer prices and weighing on bonds.
Foreign investors are selling U.S. bonds amid escalating trade tensions.
Bullish:
While inflationary in the short term, tariffs and trade conflicts could ultimately trigger a recession—an outcome that would be bullish for bonds later on.
Options
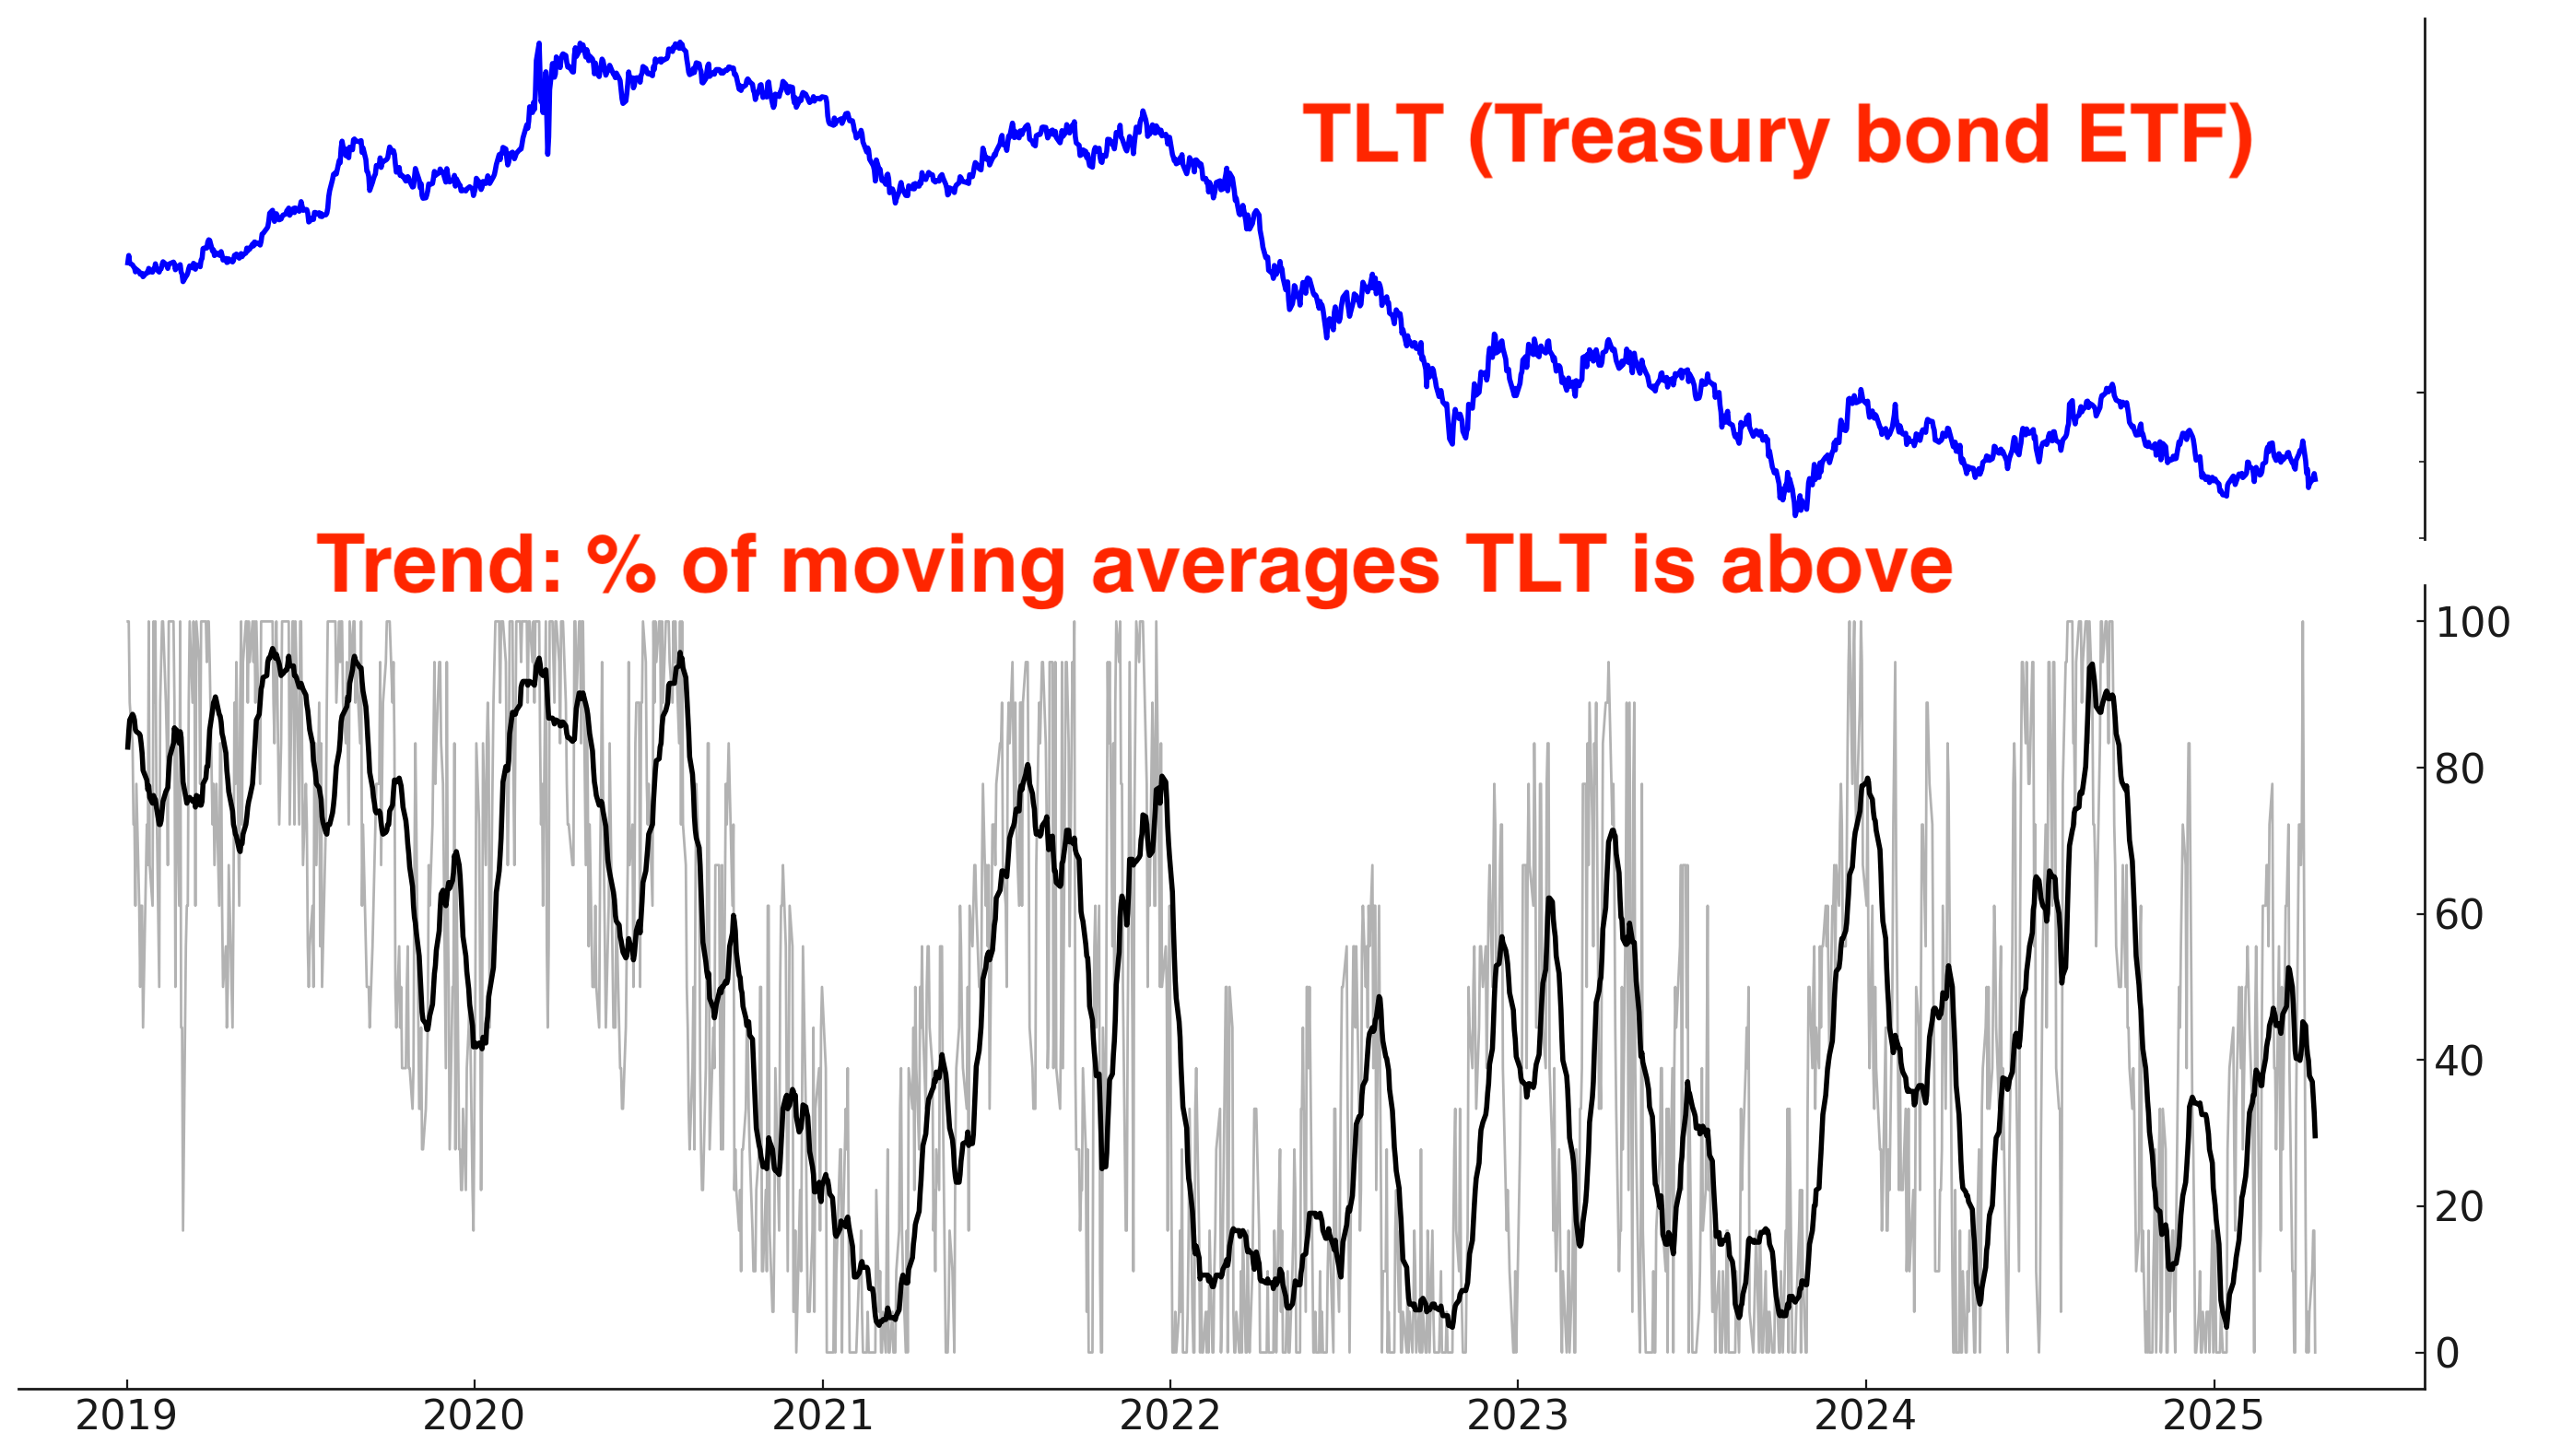
Bonds are trying to stabilize, after a big spike in TLT put volume last week:

Trend
No real trend; bonds mostly swinging sideways within a range:
Sentiment
Neutral:

I hold a small long position in bonds, but the position size is small and has little impact on my overall portfolio performance.
Currencies
The Dollar is trying to stabilize, and could bounce along with U.S. equities and bonds.

The Dollar has been firmly locked in a Down trend:

Sentiment is still mostly neutral:

From The Economist:

I do not have a currencies position.
Bitcoin
Bitcoin is a high-beta, risk-on asset that generally rises when stocks rally and struggles when stocks fall. While its directional correlation with stocks is clear, its price action is unique—less wave-like, more staircase: sharp moves followed by prolonged consolidation.
Bitcoin has performed relatively well while stocks crashed. Usually a stock market crash of this magnitude would see Bitcoin collapse, which hasn’t happened so far. I have no position in crypto, but a stock market rally will probably coincide with a Bitcoin rally.
My Portfolio
*Click here if you don’t understand how I trade
Mean-Reversion Position – Long Oversold Tech Stocks: Currently my largest position. Targeting a mean-reversion rally. I will increase my position size if the market pulls back.
*A rally in stocks could also push Bitcoin higher.
Mean-Reversion Position - Long Silver: SOLD, Position exited. The risk of a correction in gold is elevated, which could pull silver lower.
Mean-Reversion Position (Non-Core) - Long Indian Equities: Big beneficiary of U.S.-China trade war. Increased position size.
Mean-Reversion Position (Non-Core) – Long U.S. Treasury Bonds: Small position size, irrelevant for my P&L.
This content is for informational purposes only and is not financial or investment advice. I am not a licensed financial advisor. Trading involves risk, and past performance does not guarantee future results. You are responsible for your own financial decisions, and I am not liable for any losses.
Thanks. When you trade India stocks you buy INDA etf? I remember rsx being abruptly liquidated by Vaneck, isn’t it risky to buy those regional ETF if they can be liquidated at will? Thanks