
Markets Report: Is the Bottom in? Here’s what history says
Volatile vs. V-shaped bottom

The stock market has been volatile. The S&P 500 made new lows on Monday, surged on Wednesday, and pulled back again on Thursday. Last week, I mentioned that any positive headlines—such as trade deal discussions—would at the minimum trigger a bear market rally.

Market bottoms are often a process. They often involve choppy price action instead of a V-shaped recovery back to all-time highs.
Crash+pullback patterns happened during the 2016, 2015, 2011, 1998, and 1987 crashes. In contrast, V-shaped recoveries to new highs—like those in early 2019 and post-COVID 2020—are less common. (Charts of these years are shown in this post.)
Before I dive into my Market Outlook and Portfolio Positioning, here are the key indicators I’m watching: options data, volatility, corporate insiders, fund flows, breadth, sentiment, trends, and more.
U.S. Stocks
Huge reversals
After Wednesday’s 9% rally, the stock market’s pullback on Thursday was to be expected. History shows that large 1 day spikes are often followed by a 1-2 day pullback, which we saw on Thursday:


Options
At the start of this year, I said that 2025 would likely be a very volatile year. Investors were extremely optimistic and options traders had piled into calls. Now that stocks have fallen, those same traders are loading up on Puts.

The S&P 500 Options Flow Index is extremely low. This was last seen at the late-2018, March 2020, and 2022 bottoms:
Meanwhile, the SKEW Index has fallen significantly. This suggests that the probability of a further stock market decline is decreasing:
Breadth
Before stocks surged on Wednesday, 55% of S&P 500 stocks were oversold (RSI < 30). The last time there were this many oversold stocks was during the COVID crash:

Prior instances of extreme oversold breadth usually saw the stock market rally in the weeks and months ahead:

It’s not just the S&P 500 that has extreme oversold breadth. 57% of NASDAQ 100 stocks were oversold as of Tuesday:

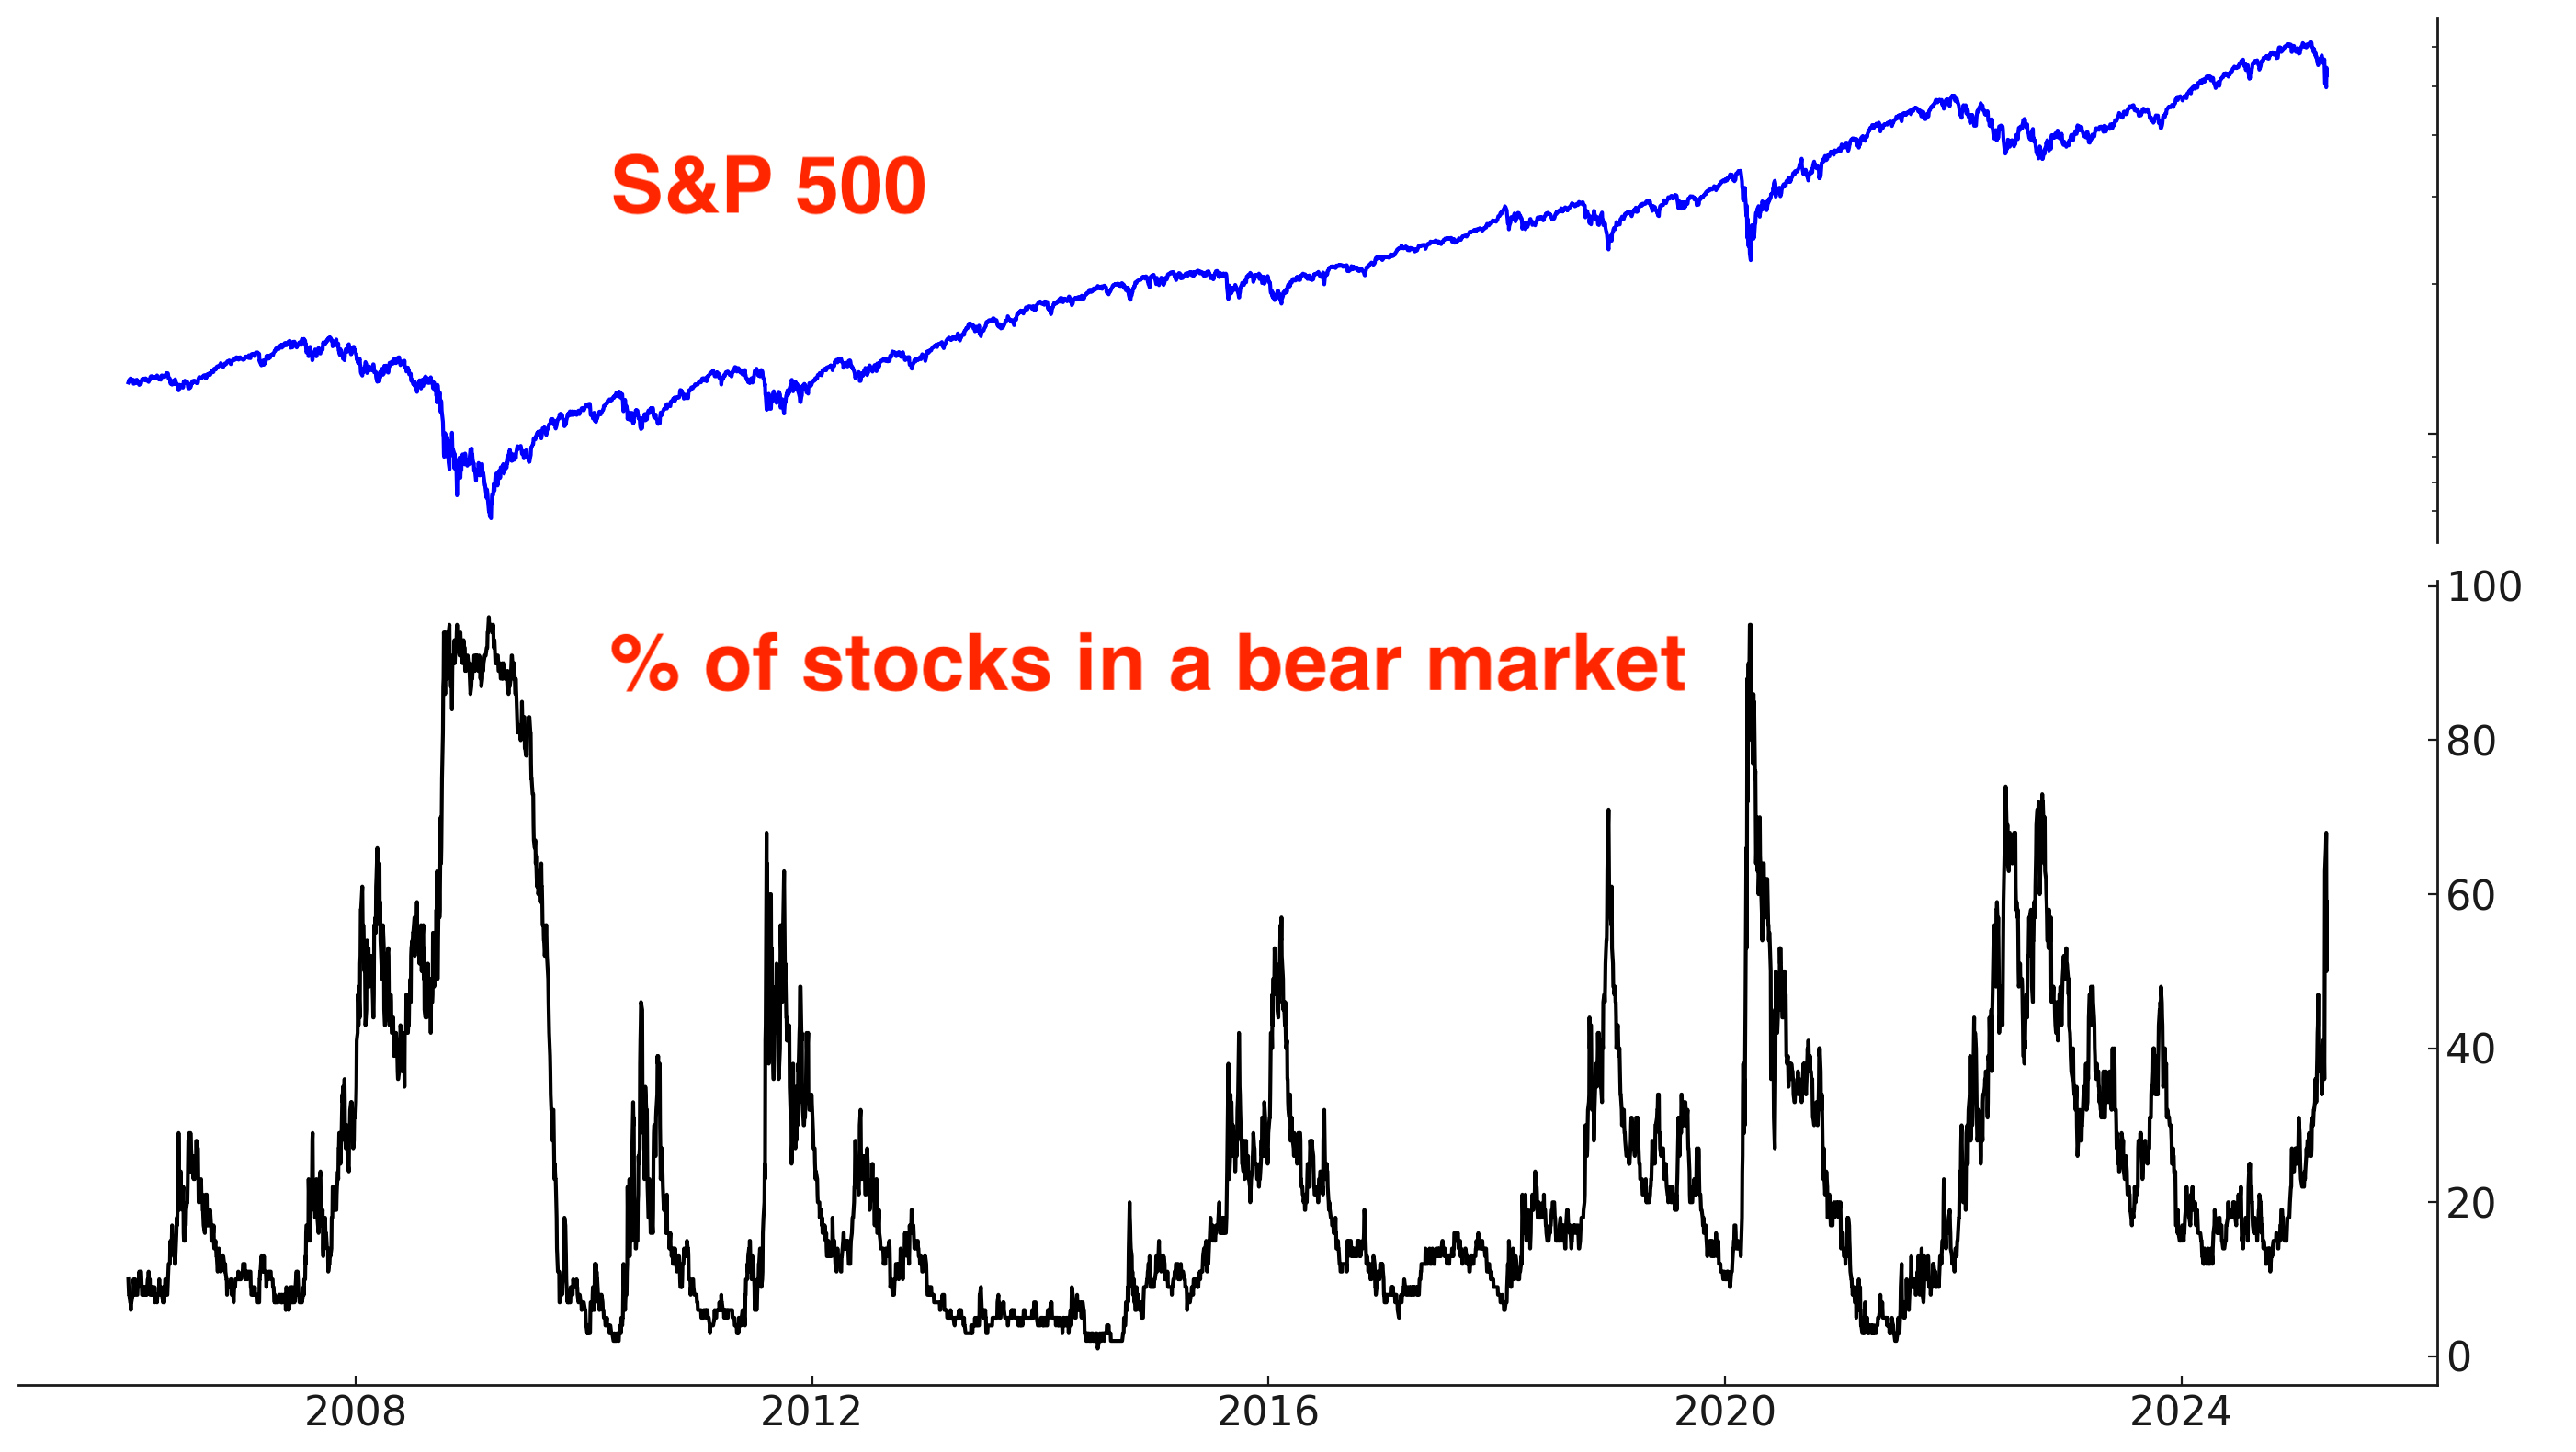
More than 2/3 of S&P 500 stocks were in bear market territory on Tuesday (i.e. down more than -20%):
When markets are deeply oversold, the rebound can be just as sharp. On Wednesday, over 97% of S&P 500 stocks moved higher—a rare surge in 1-day breadth. Historically, moves like this were sometimes followed by a brief pullback, then a continued push higher.


Volatility
VIX spiked to a high on Monday. As is common with VIX spikes, VIX’s term structure became inverted.
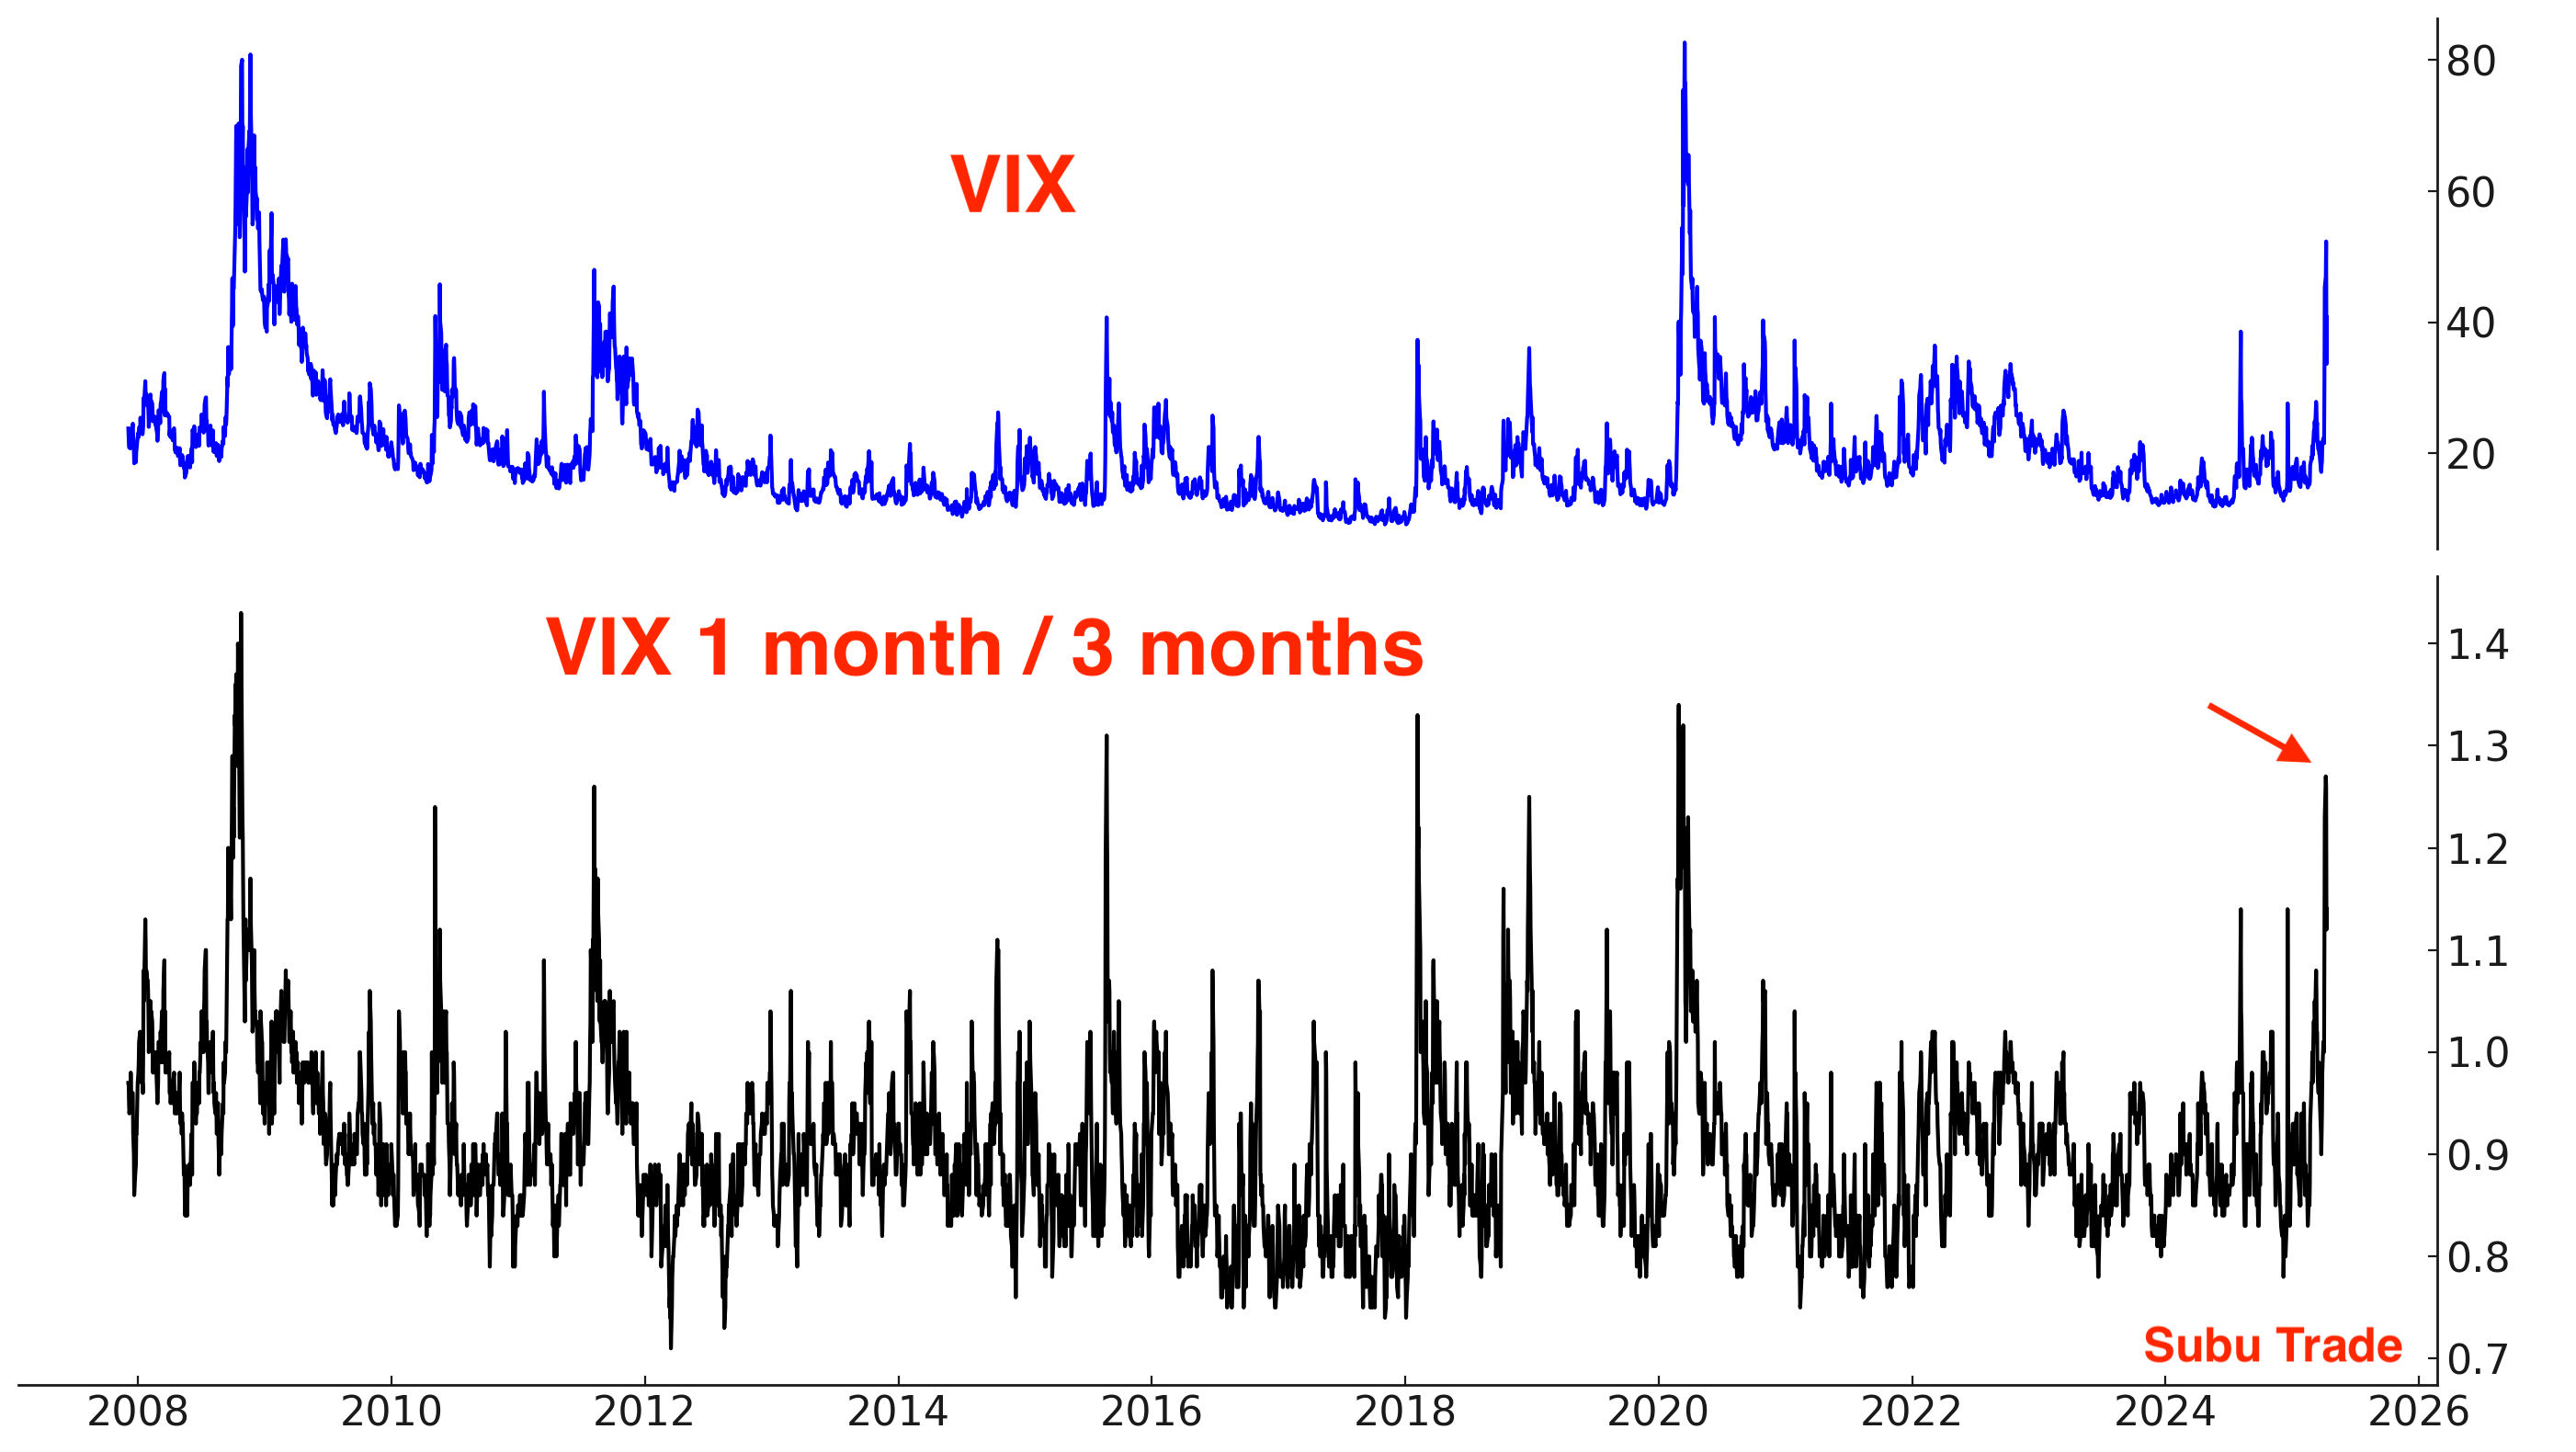
Tuesday showed another sign of a market bottom. When the stock market falls sharply, the 1-month VIX usually rises more than the 3-month VIX as near-term fear takes hold. But toward the end of a crash, that dynamic often reverses—longer-term volatility expectations start rising faster as traders fear that problems will linger. On Tuesday, both the 1-month and 3-month VIX increased, but notably, the 3-month VIX rose more.
Peak Uncertainty
Stocks dropped sharply in recent weeks because rising uncertainty around tariffs and trade wars triggered a surge in recession fears. As is often the case, markets tend to bottom on peak fear/uncertainty:

Sentiment Surveys
Needless to say, sentiment was extremely pessimistic. Investors Intelligence Bulls plunged to 23.6%, which is the lowest reading since December 2008:

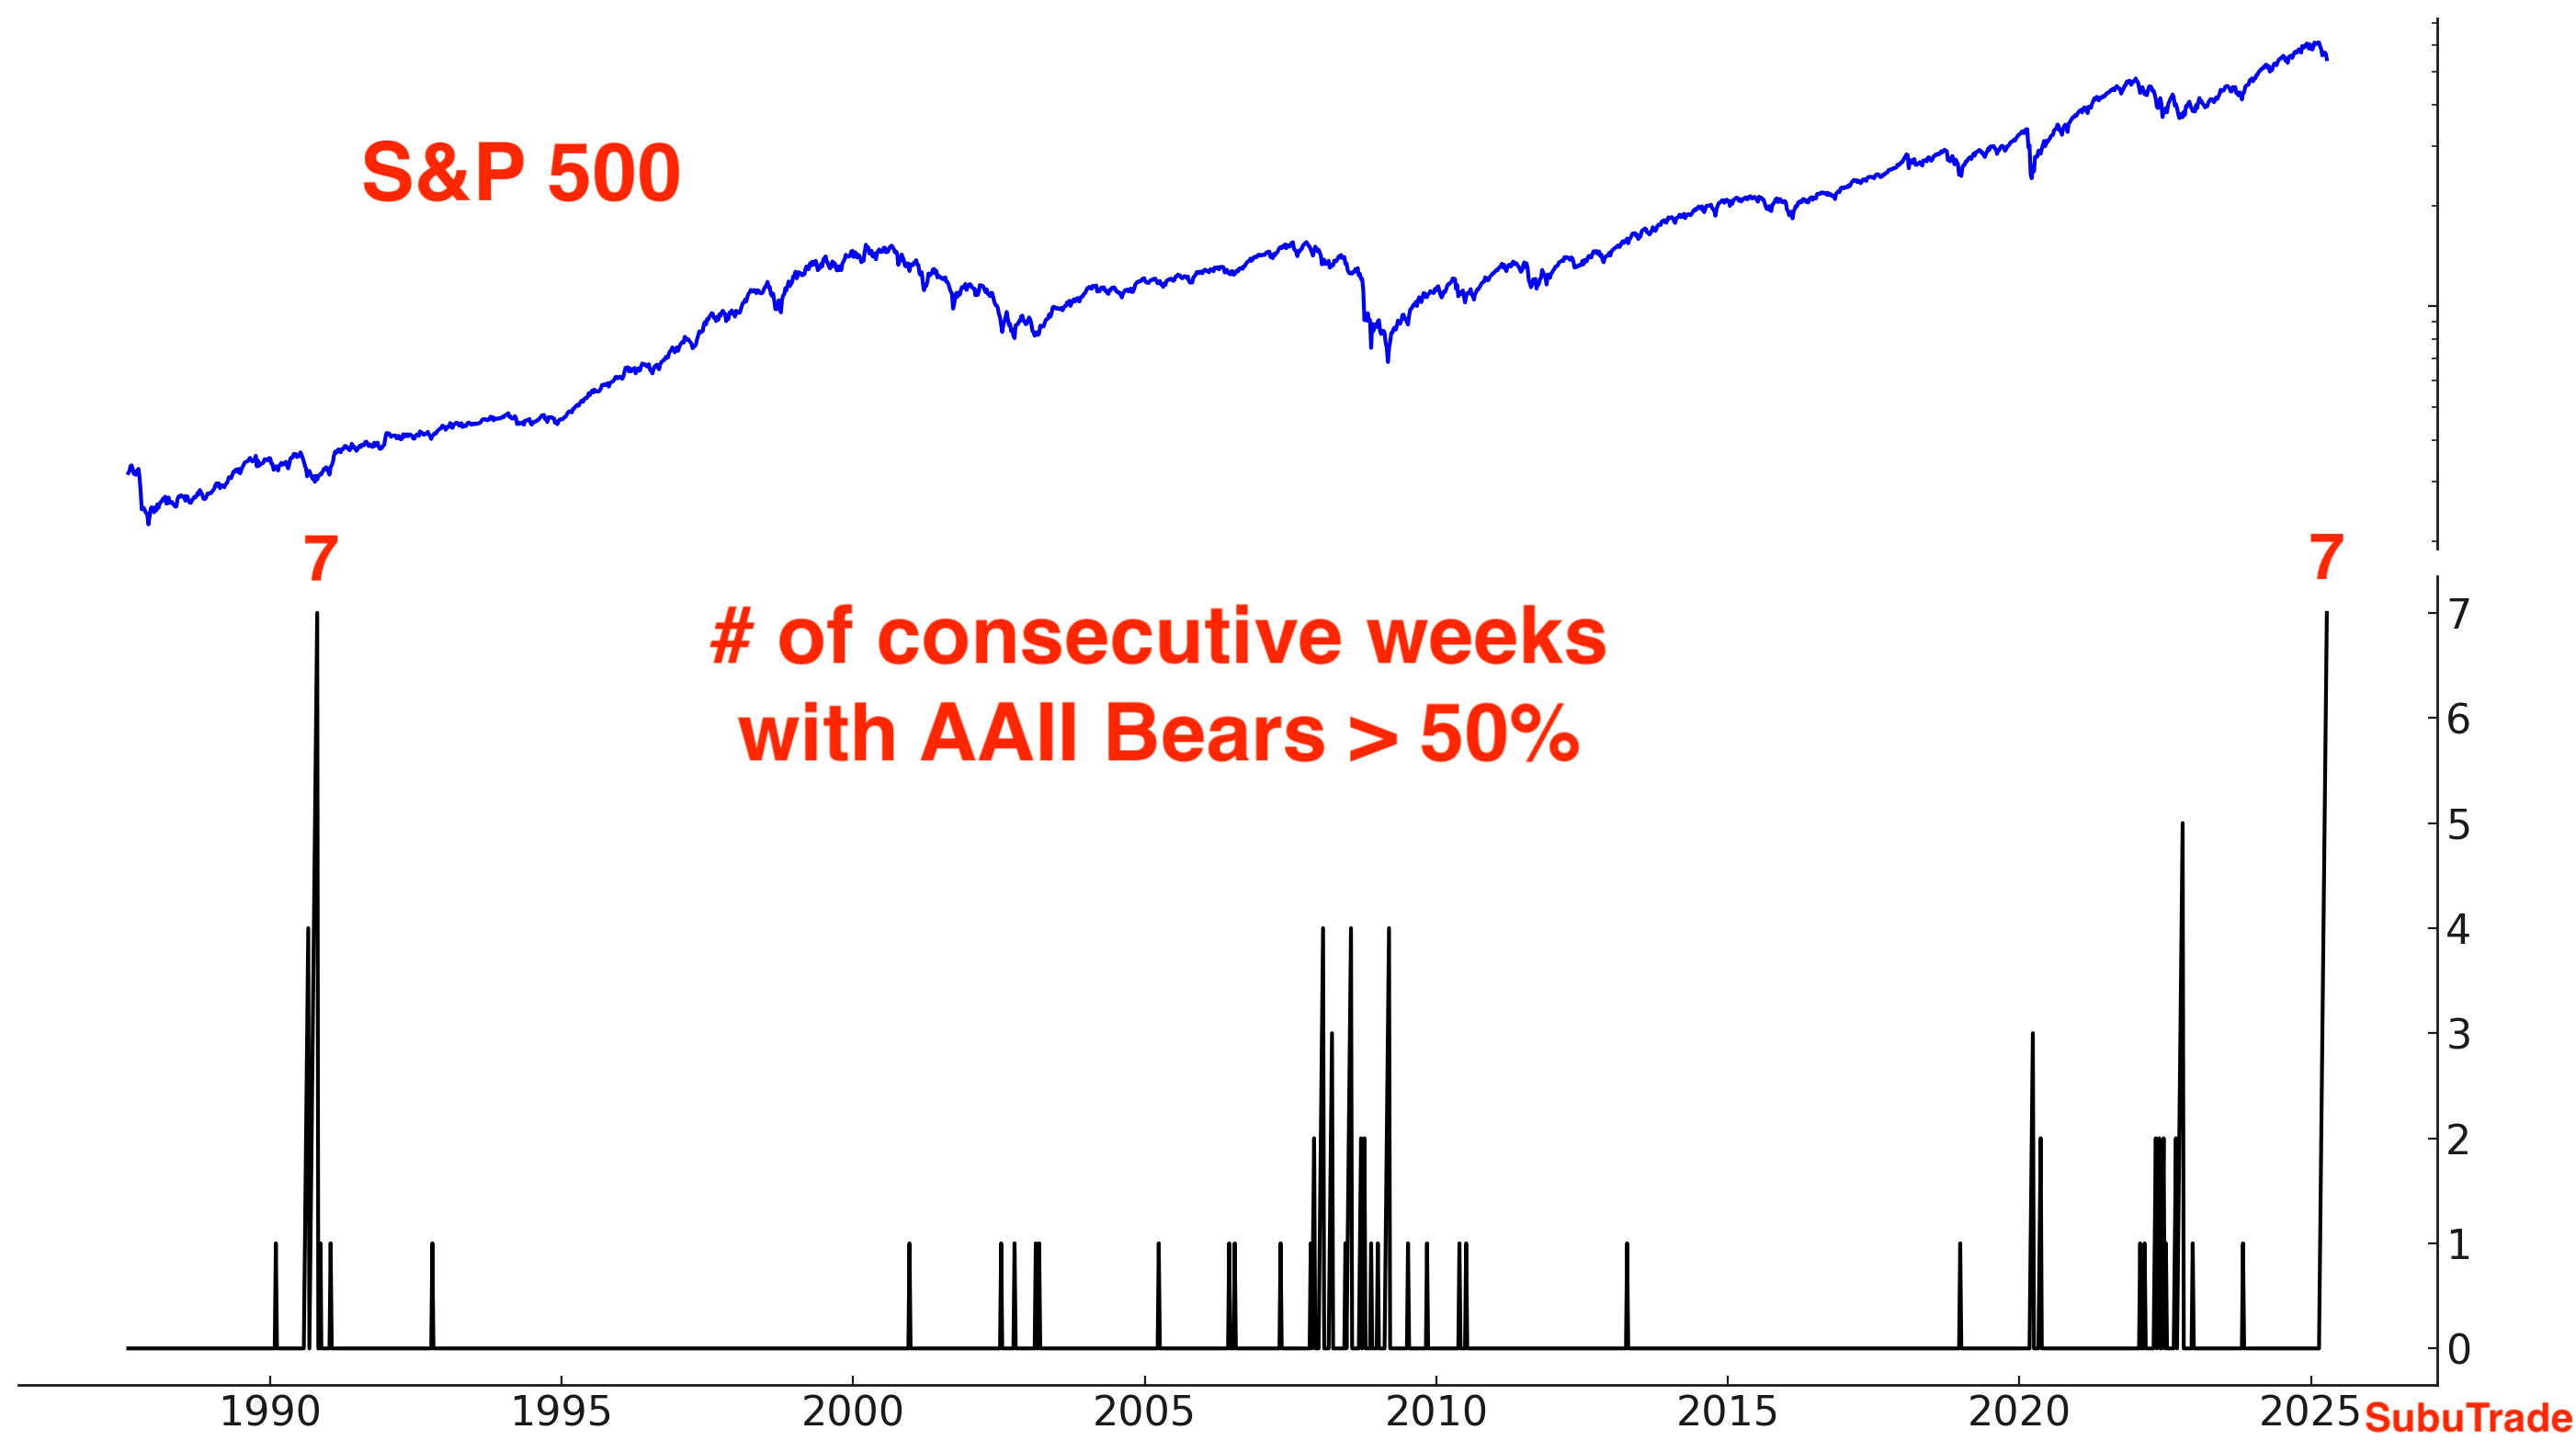
Meanwhile, AAII Bears is at 58.9%

This is the 7th week in a row that AAII Bears have remained above 50%. This matches the previous streak in October 1990, which marked the bottom of the 1990 bear market:
Other Sentiment
The S&P 500’s Daily Sentiment Index is starting to recover from extreme pessimism:
CNN Fear & Greed is still in “Fear” territory, but is starting to come up:
Corporate Insiders
Corporate Insiders have not been heavy buyers during the recent stock market crash. Perhaps they are also worried about Trump’s tariffs and the impact it would have on their businesses. This contrasts with past market crashes (e.g. COVID, 2008) when Insiders were heavy buyers:
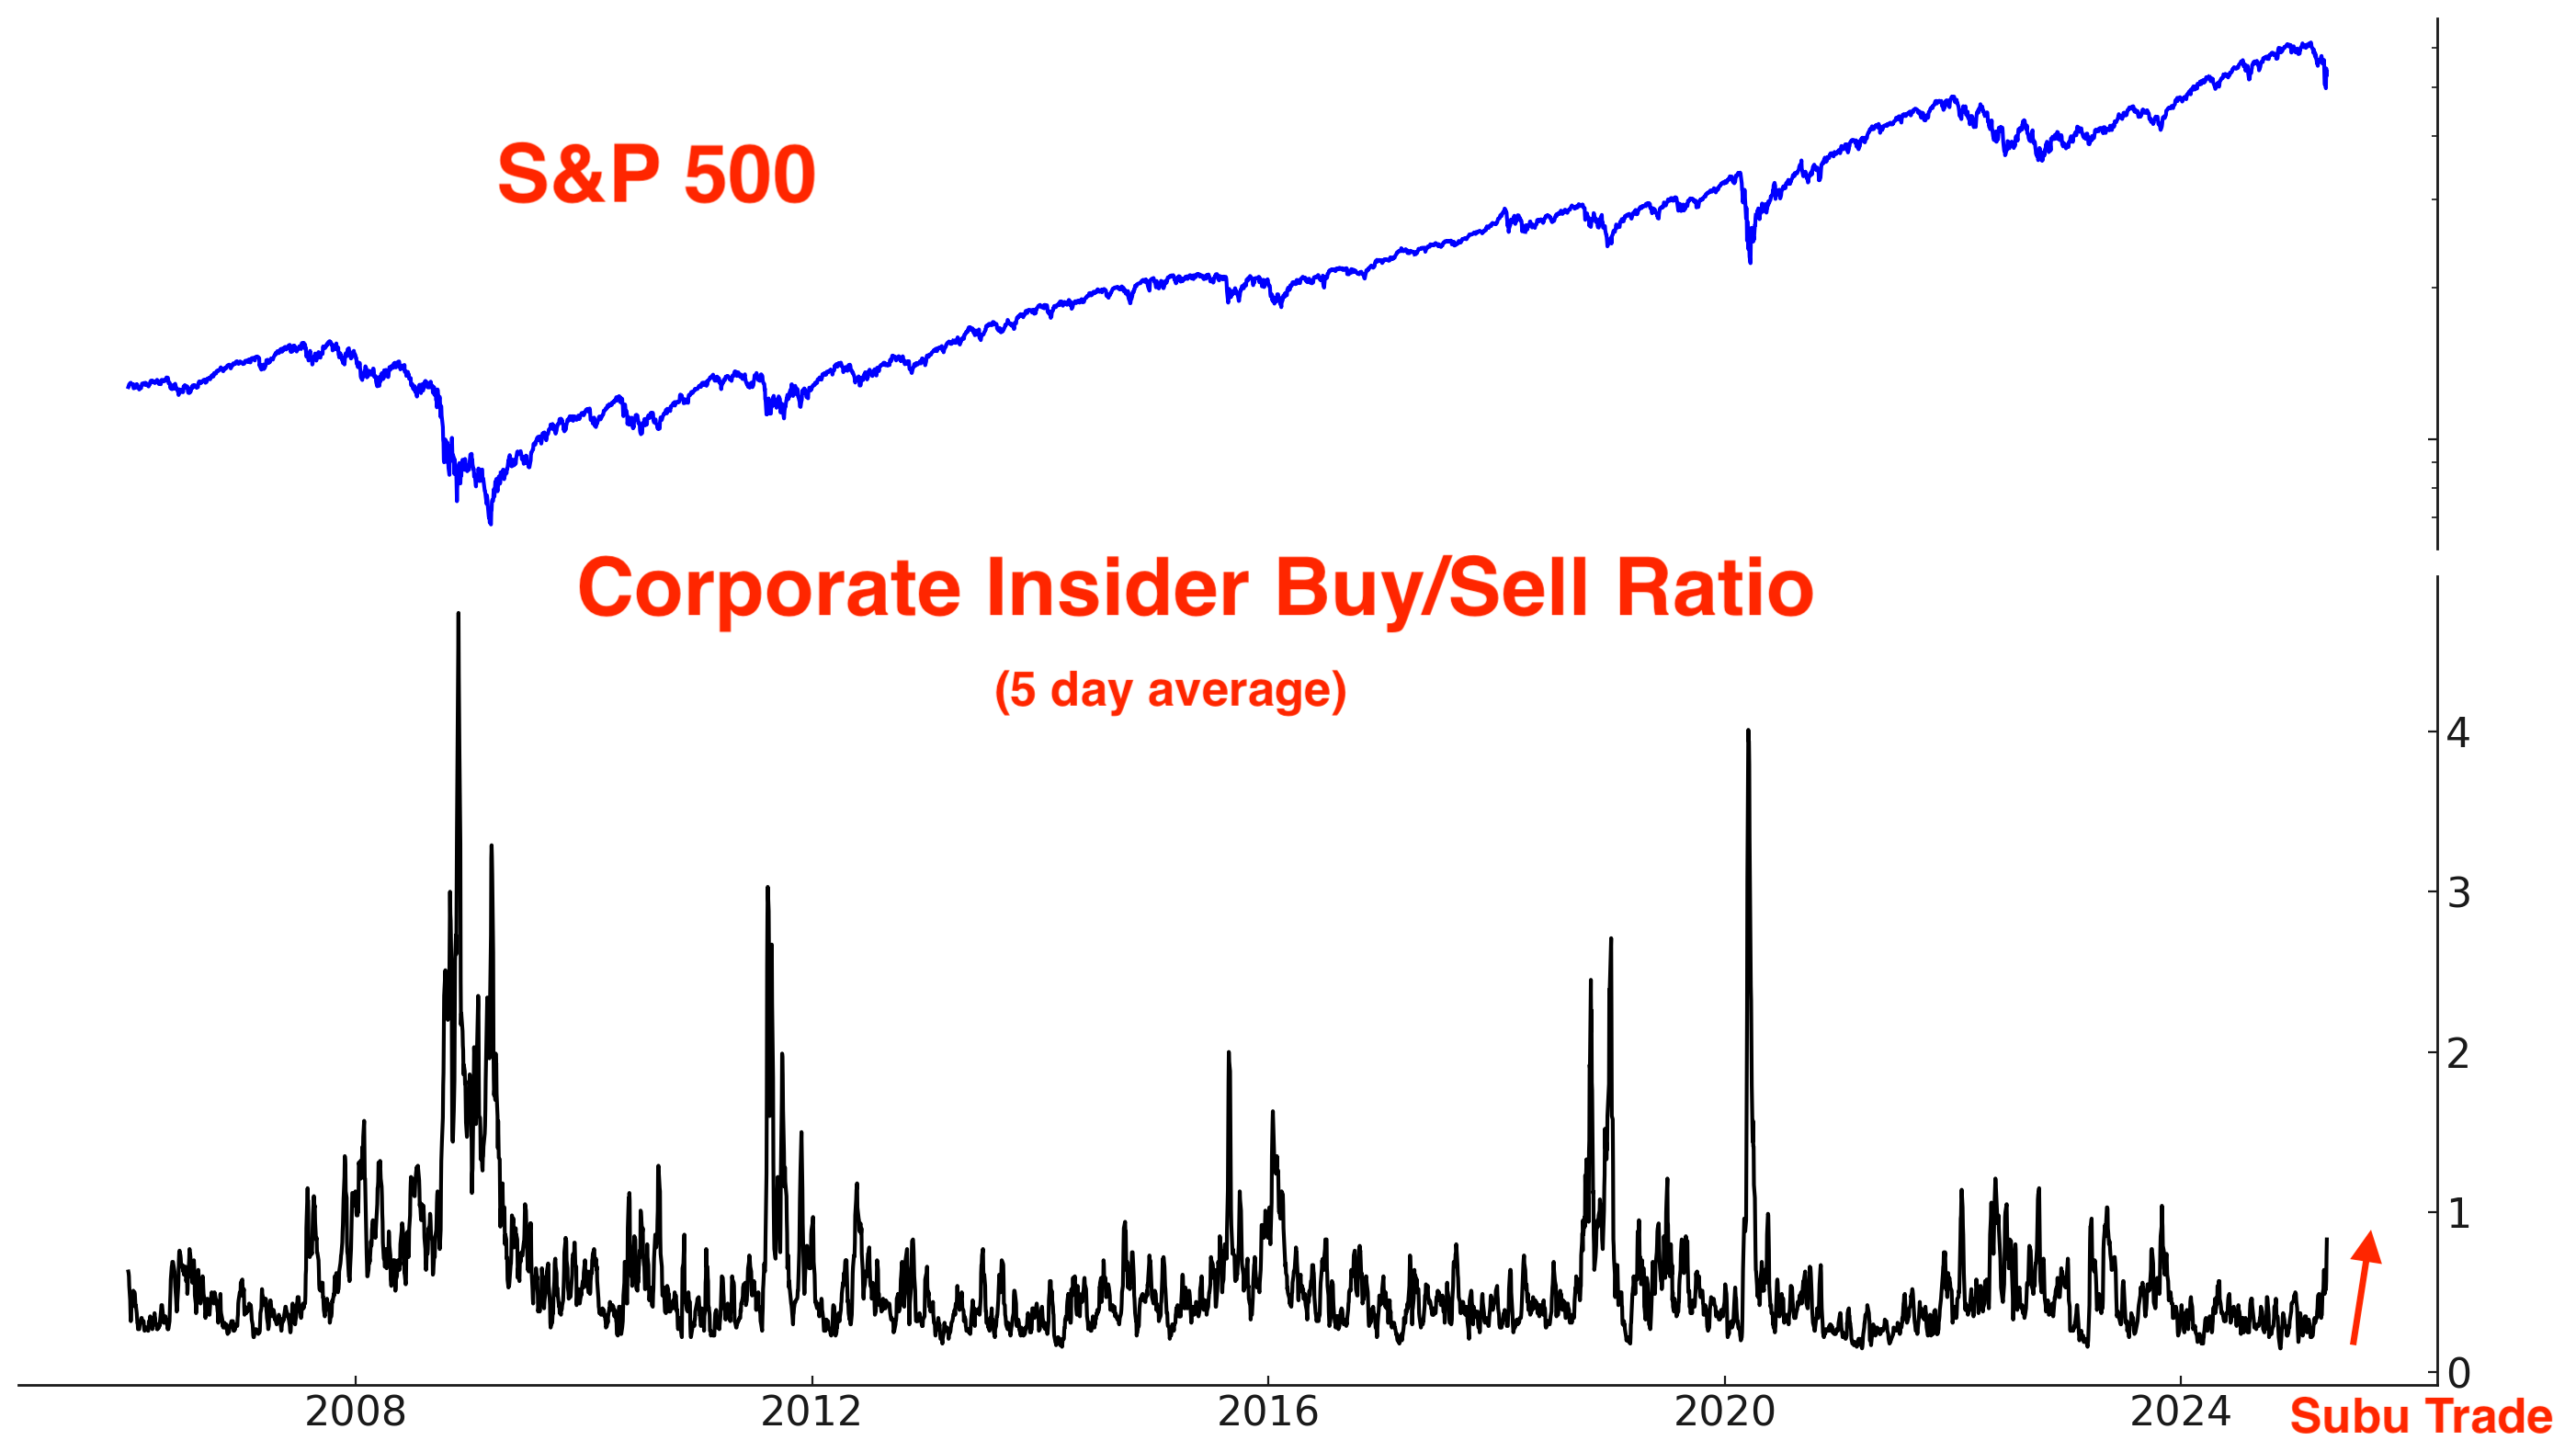
Using a log scale for the Insider Buy/Sell ratio illustrates this more clearly: the Buy/Sell Ratio is starting to rise, but not significantly yet.

Fund Flows
TQQQ traders are contrarian: they buy the dip and sell the rip.
TQQQ just saw record inflows as traders were buying the dip in anticipation of a mean-reversion rally. When the market goes up, you can expect to see outflows from this ETF as traders take profits.

Inverse ETF Volume
Market crashes are typically marked by volume spikes, while rallies typically see declining volume. While most traders look at SPY and QQQ volume, I also monitor volume for inverse ETFs like SH.
*Inverse ETFs go up when the market falls, and go down when the market rises.
The dollar value of SH’s volume soared this week to the highest level since the COVID crash. Dollar volume is key here, since volume alone can be misleading. As markets trend higher over time, inverse ETFs decline in price, which inflates the share volume without reflecting true demand.

Trend
The trend is your friend, until it ends. Despite this week’s bounce, the U.S. stock market is still trending down.
Why does this matter? Because at least from a trend following perspective, it’s better to buy when the market is trending Up (e.g. above its 200-DMA) than when the market is trending Down (e.g. below its 200-DMA). This doesn’t mean that the market can’t rally from below it’s 200-DMA. It simply means that risk and volatility are higher down here.

To monitor trend, some traders also look at the 50 day moving average in relation to the 200 day moving average. A “Death Cross” will likely occur on Monday, whereby the S&P’s 50-DMA falls below its 200-DMA:

From a purely systematic trend-following perspective, it’s better to be Long when the S&P 500 is in an uptrend, such as when the 50-day moving average is above the 200-day moving average.

Again, this doesn’t mean that markets can’t rally when they are trending down. This simply means that risk and volatility are greater when markets are trending down.

Market Outlook & Portfolio Positioning
Market bottoms typically take time. The process often includes choppy price action and, in many cases, a retest of the lows—or at least a 61.8% retracement of the initial rally. A quick, V-shaped recovery back to all-time highs is less common.
So before diving into my market outlook and portfolio positioning, let’s review some 15–30% market declines from the past 40 years.
S&P in 2015:

S&P in 2011:

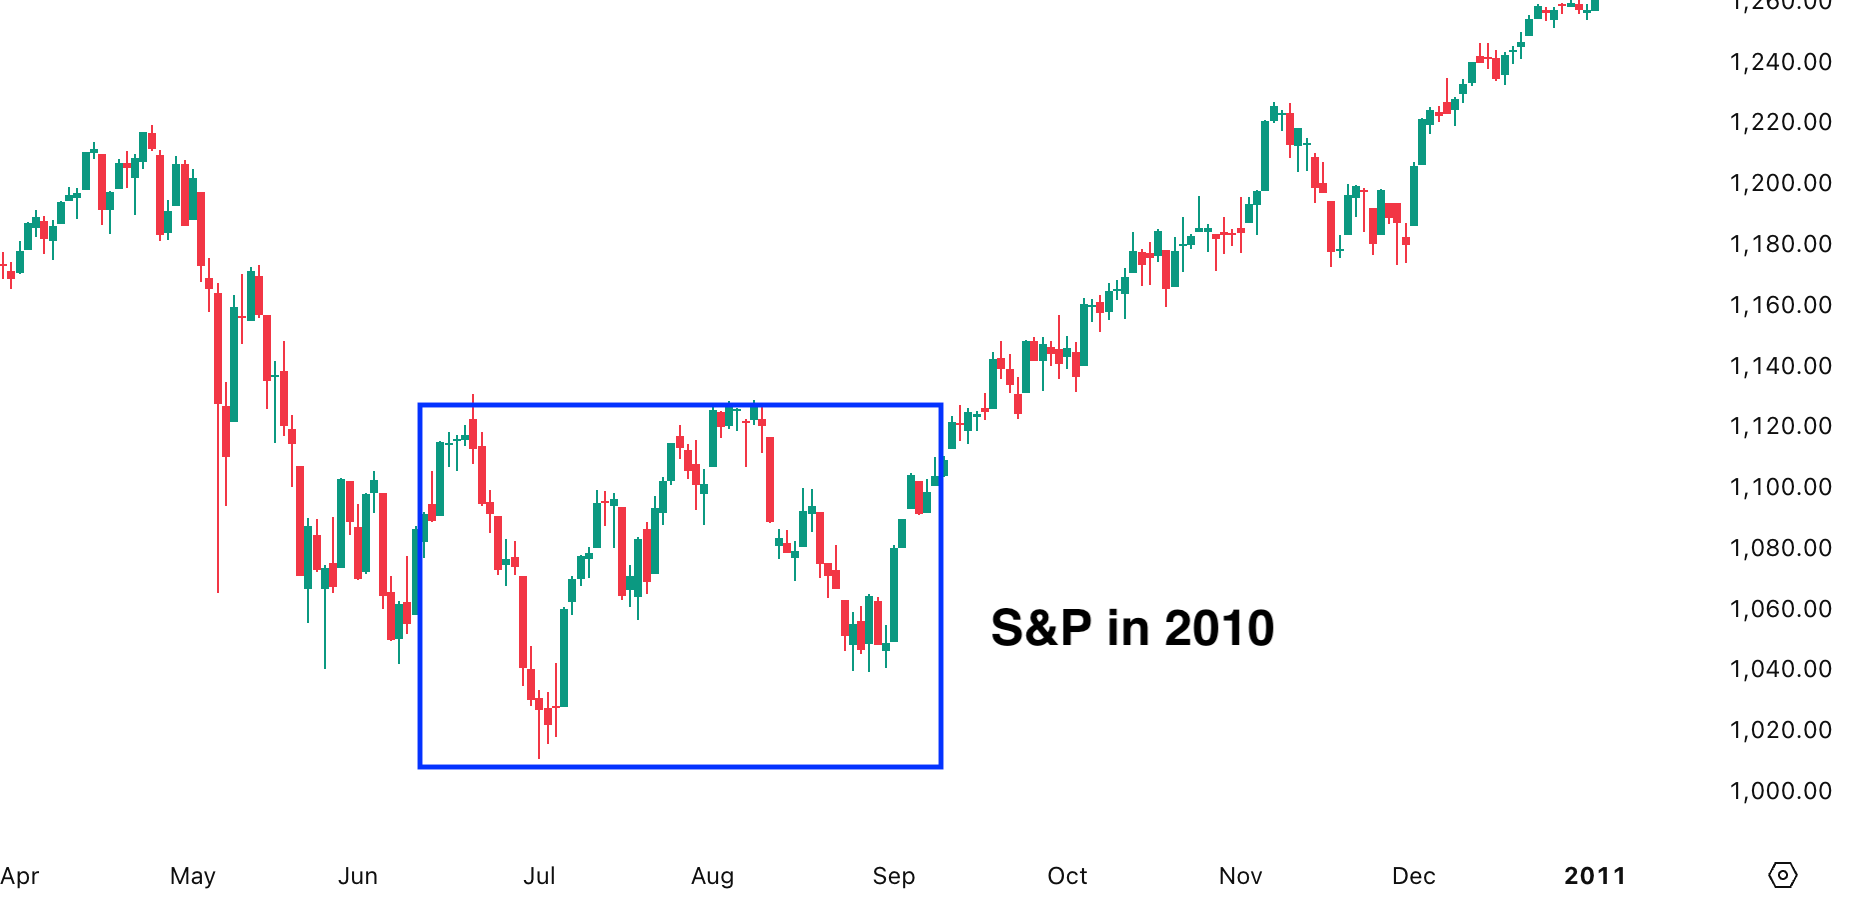
S&P in 2010:
S&P in 1998:

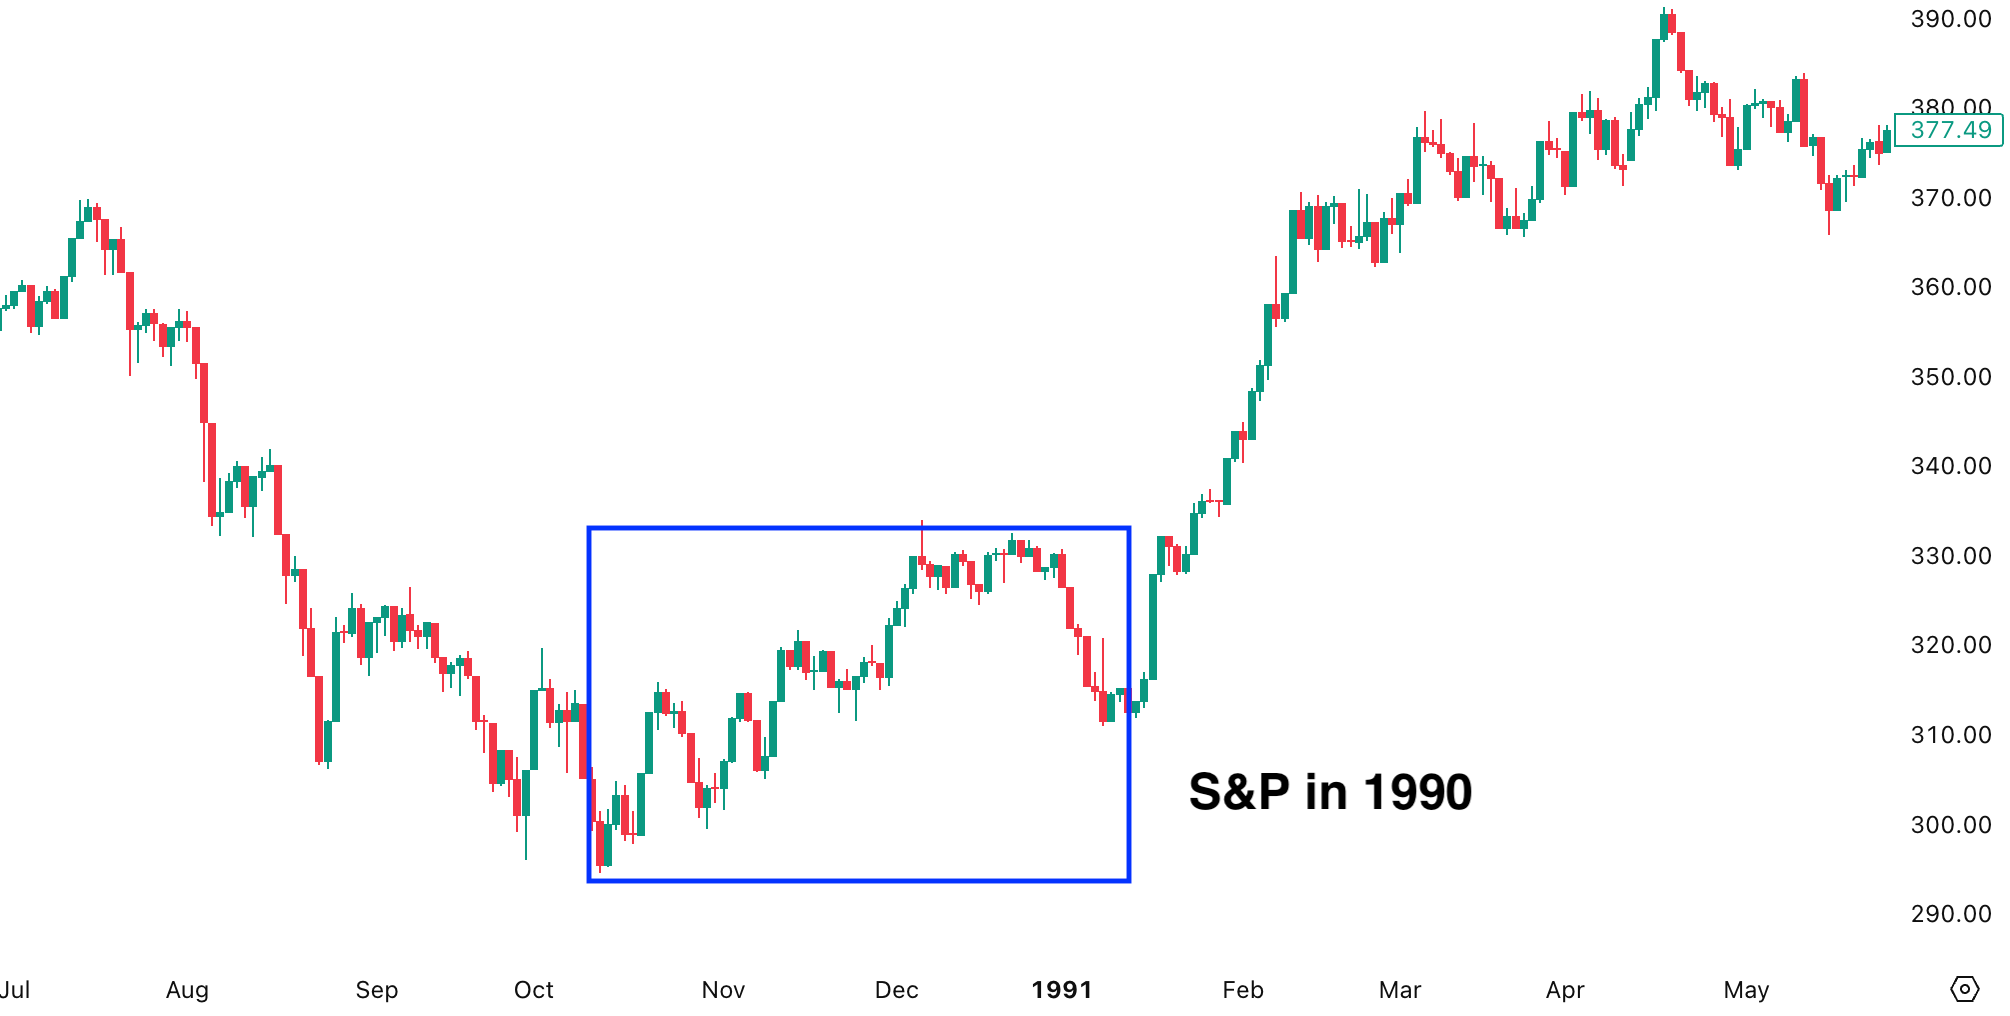
S&P in 1990:
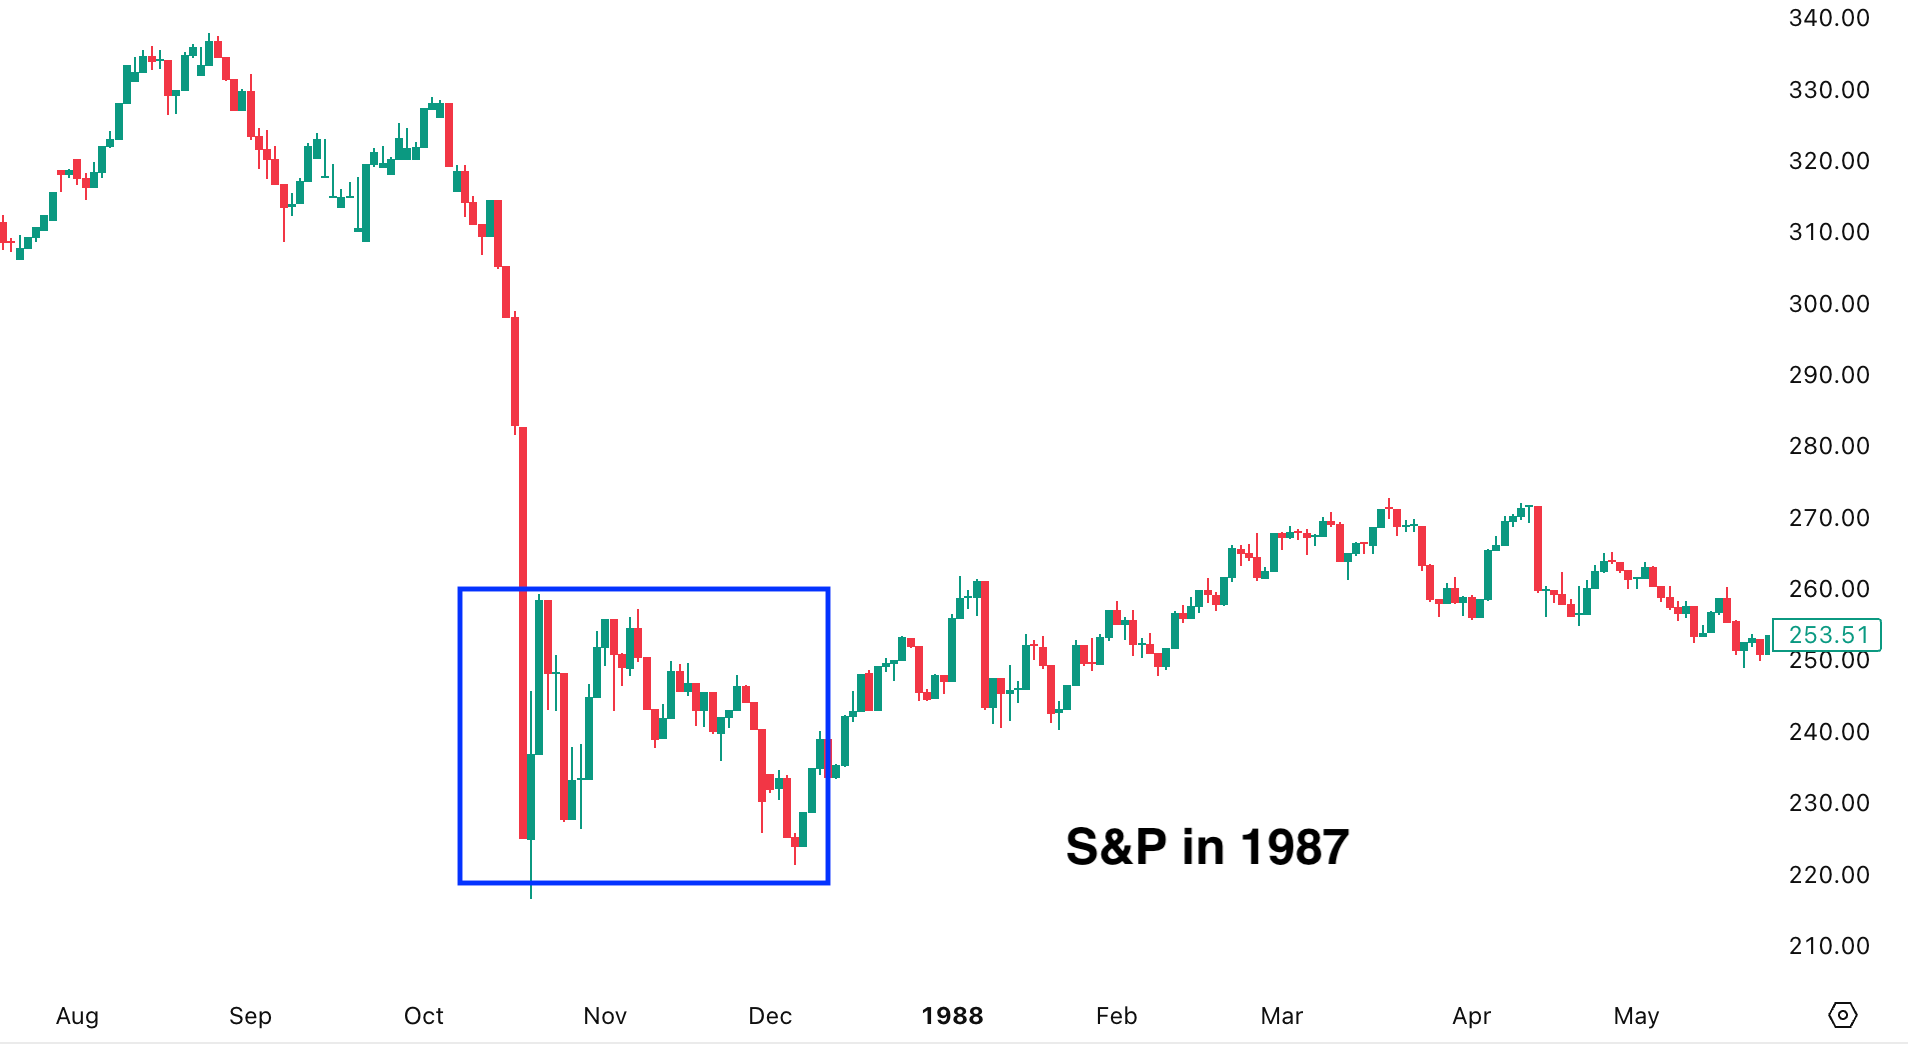
S&P in 1987:
Markets don’t often rally straight back to all-time highs without pause. V-shaped bottoms typically require significant policy support. If Trump makes a deal and reduces tariffs on China, that could help trigger a V-shaped recovery.

S&P in 2018:

Overall, I lean toward a “choppy bottom” instead of a V-shaped recovery.
Bottomline: the current rally should continue, but with significant volatility. While a V-shaped recovery is possible, it is not the most likely scenario.
My Portfolio:
*Click here if you don’t understand how I trade
Mean-Reversion Position – Long Oversold Tech Stocks: Targeting at least a mean-reversion rally. I increased my position size earlier this week and will buy more if stocks re-test the bottom. This is now my biggest position.
Core-position - Long Gold: SOLD. For months my biggest position was long gold. I expect gold to fall.
Mean-Reversion Position (Non-Core) - Long Silver: Sold 1/2 of my silver position. Waiting for a mean-reversion bounce.
Mean-Reversion Position (Non-Core) - Long Indian Equities: Big beneficiary of Trump’s tariffs.
Mean-Reversion Position (Non-Core) – Long U.S. Treasury Bonds: Small position size, irrelevant for my P&L.
Gold & silver
For months my biggest position was long gold as I emphasized the bullish theme/narrative that was driving gold’s rally. I have now sold my gold position.
I said:
Global central banks (e.g. China) are buying gold because they fear holding U.S. Treasuries that could be confiscated in a geo-political conflict (e.g. economic/trade wars). As the US. ratchets up trade pressure on allies and foes, expect the demand for gold to increase. Here are the annual purchases of gold by central banks:

Gold surged to new all-time highs this week while the U.S. Dollar and bonds got crushed. I expect these markets to mean-revert:
Gold should fall from these extremely overbought levels.
The Dollar and bonds could rally as foreigners slow down their selling of U.S. assets.
China has been the largest buyer of gold in recent years. But with U.S. tariffs hurting China’s export-driven economy, the question is whether China will have the financial capacity to continue buying gold. As the Chinese government prepares for emergency fiscal stimulus, much of its $$ may be redirected toward supporting the domestic economy instead of buying gold.
Other indicators suggest that the current environment presents elevated risks for gold.
GLD Call volume jumped to a record this Friday:
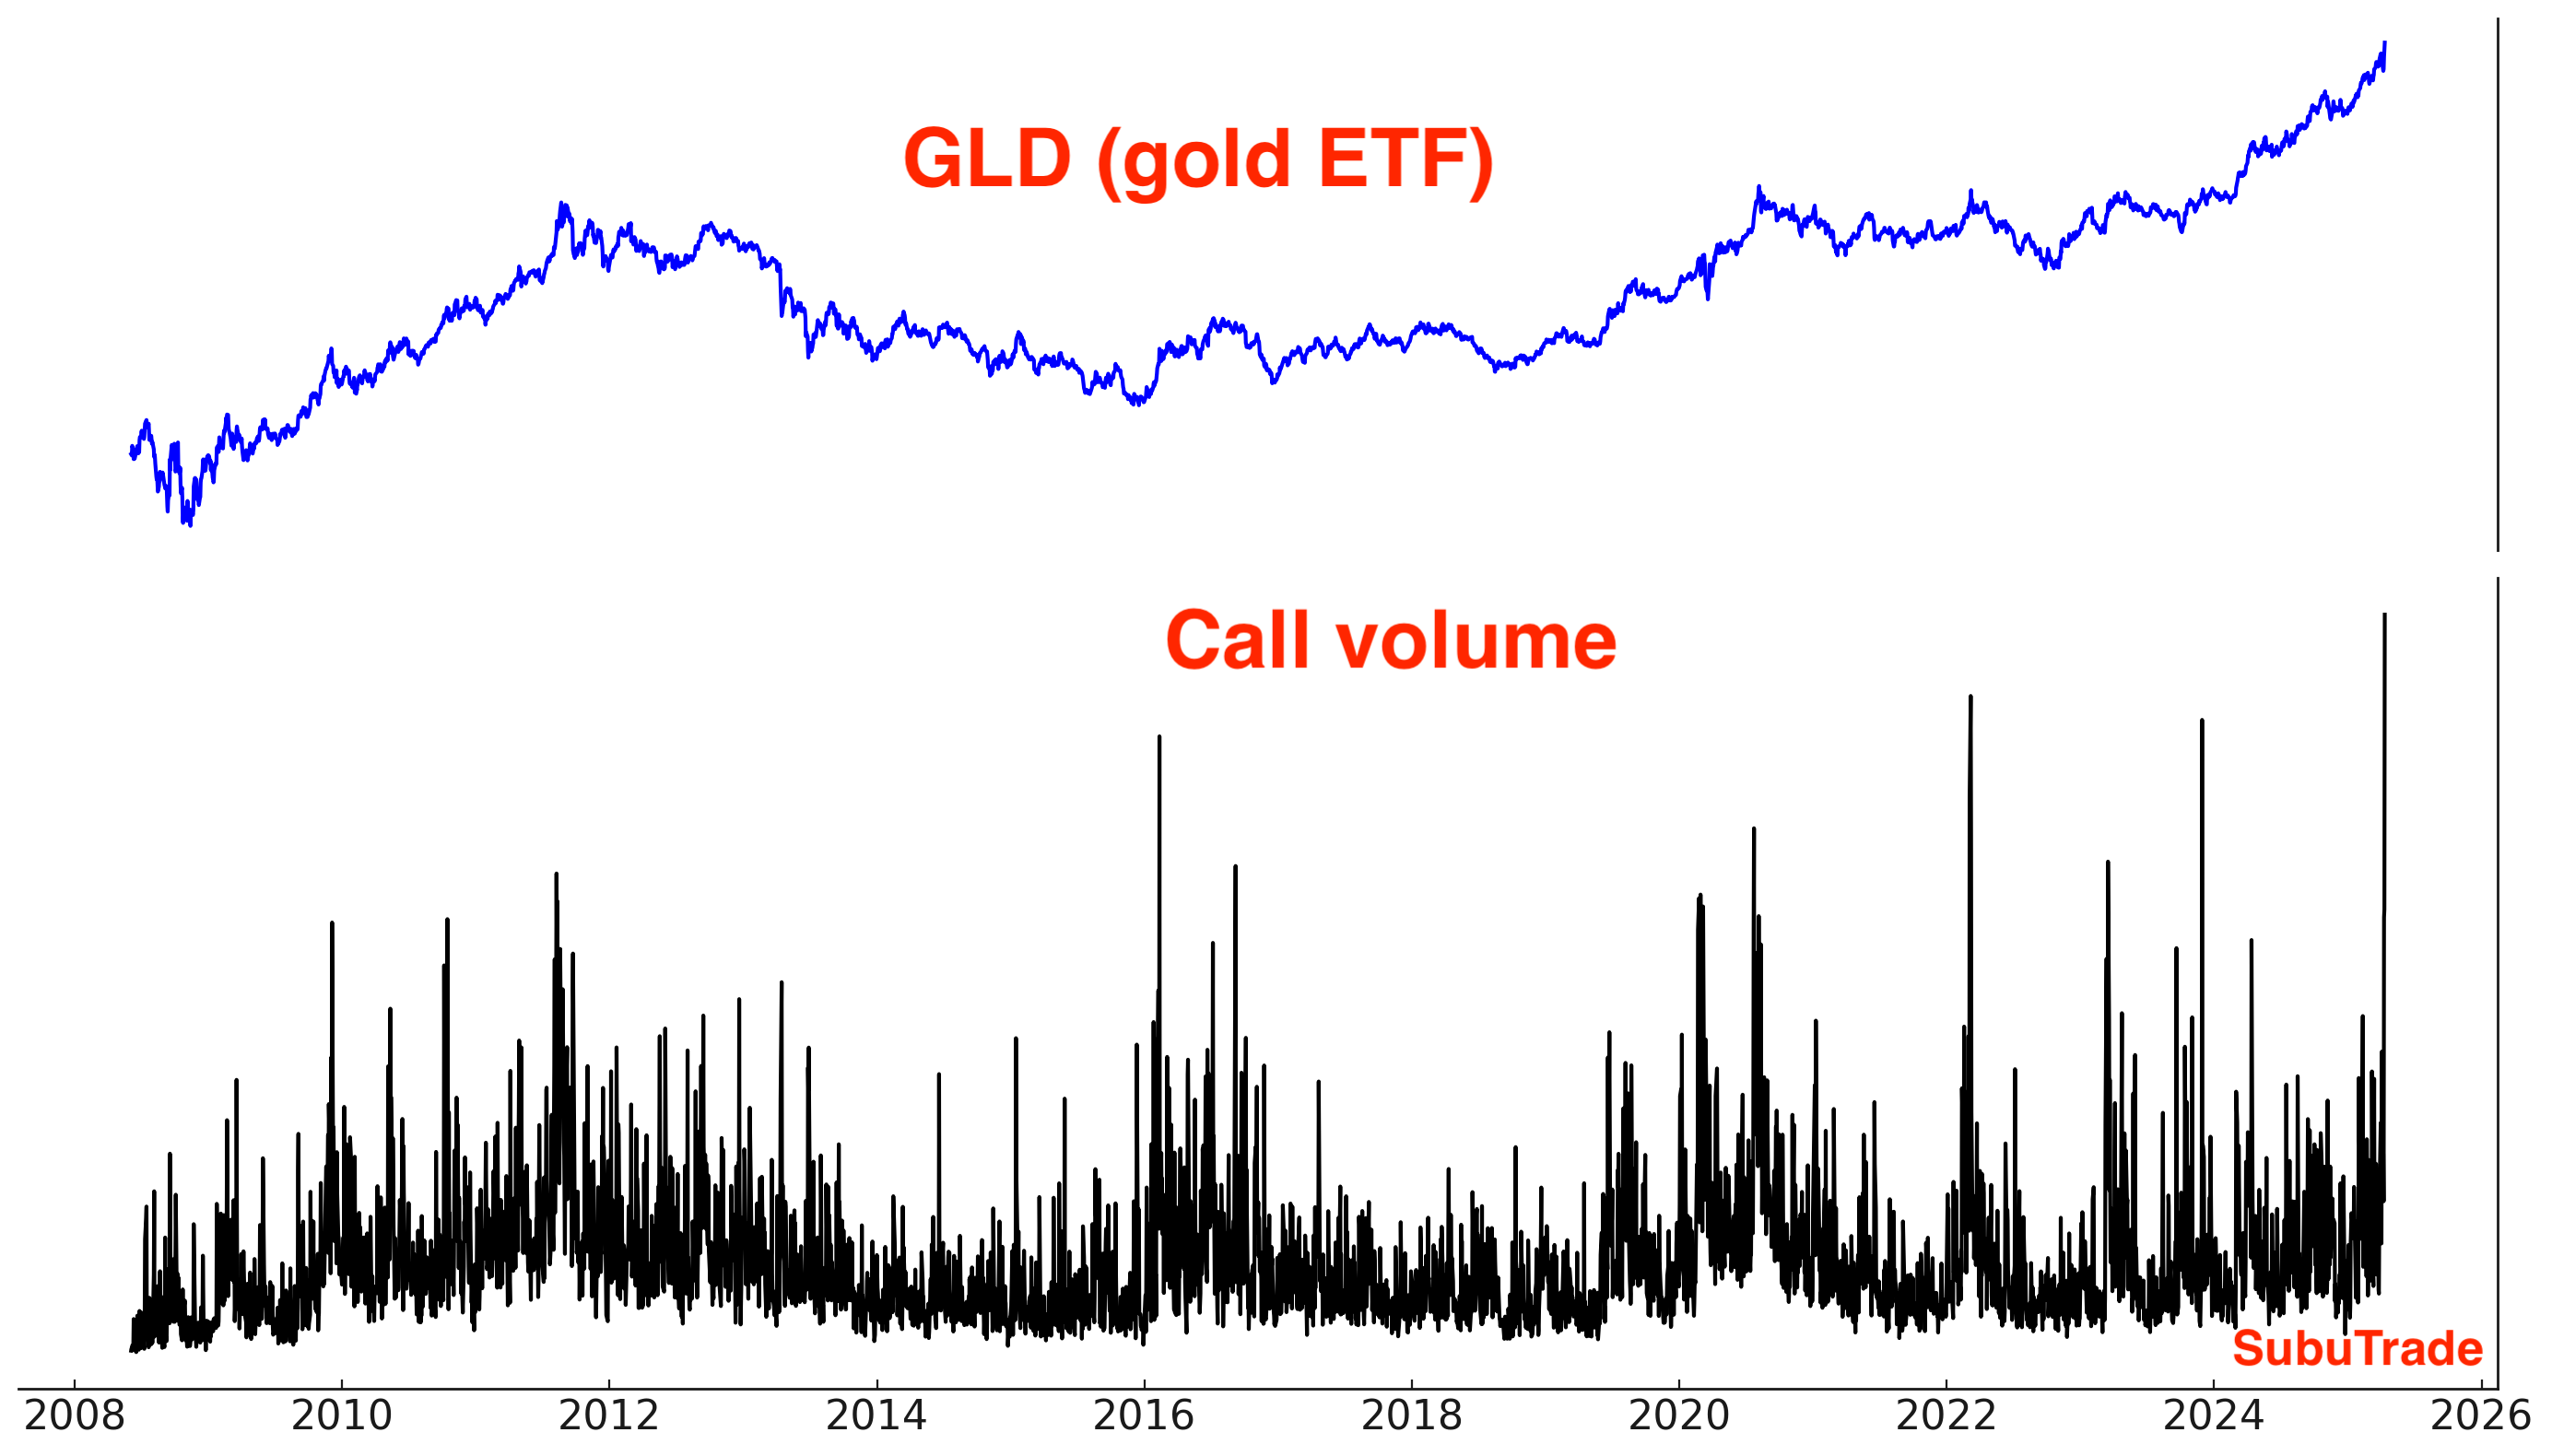
The value of these calls is going parabolic:

We continue to see strong inflows into gold ETFs like GLD:

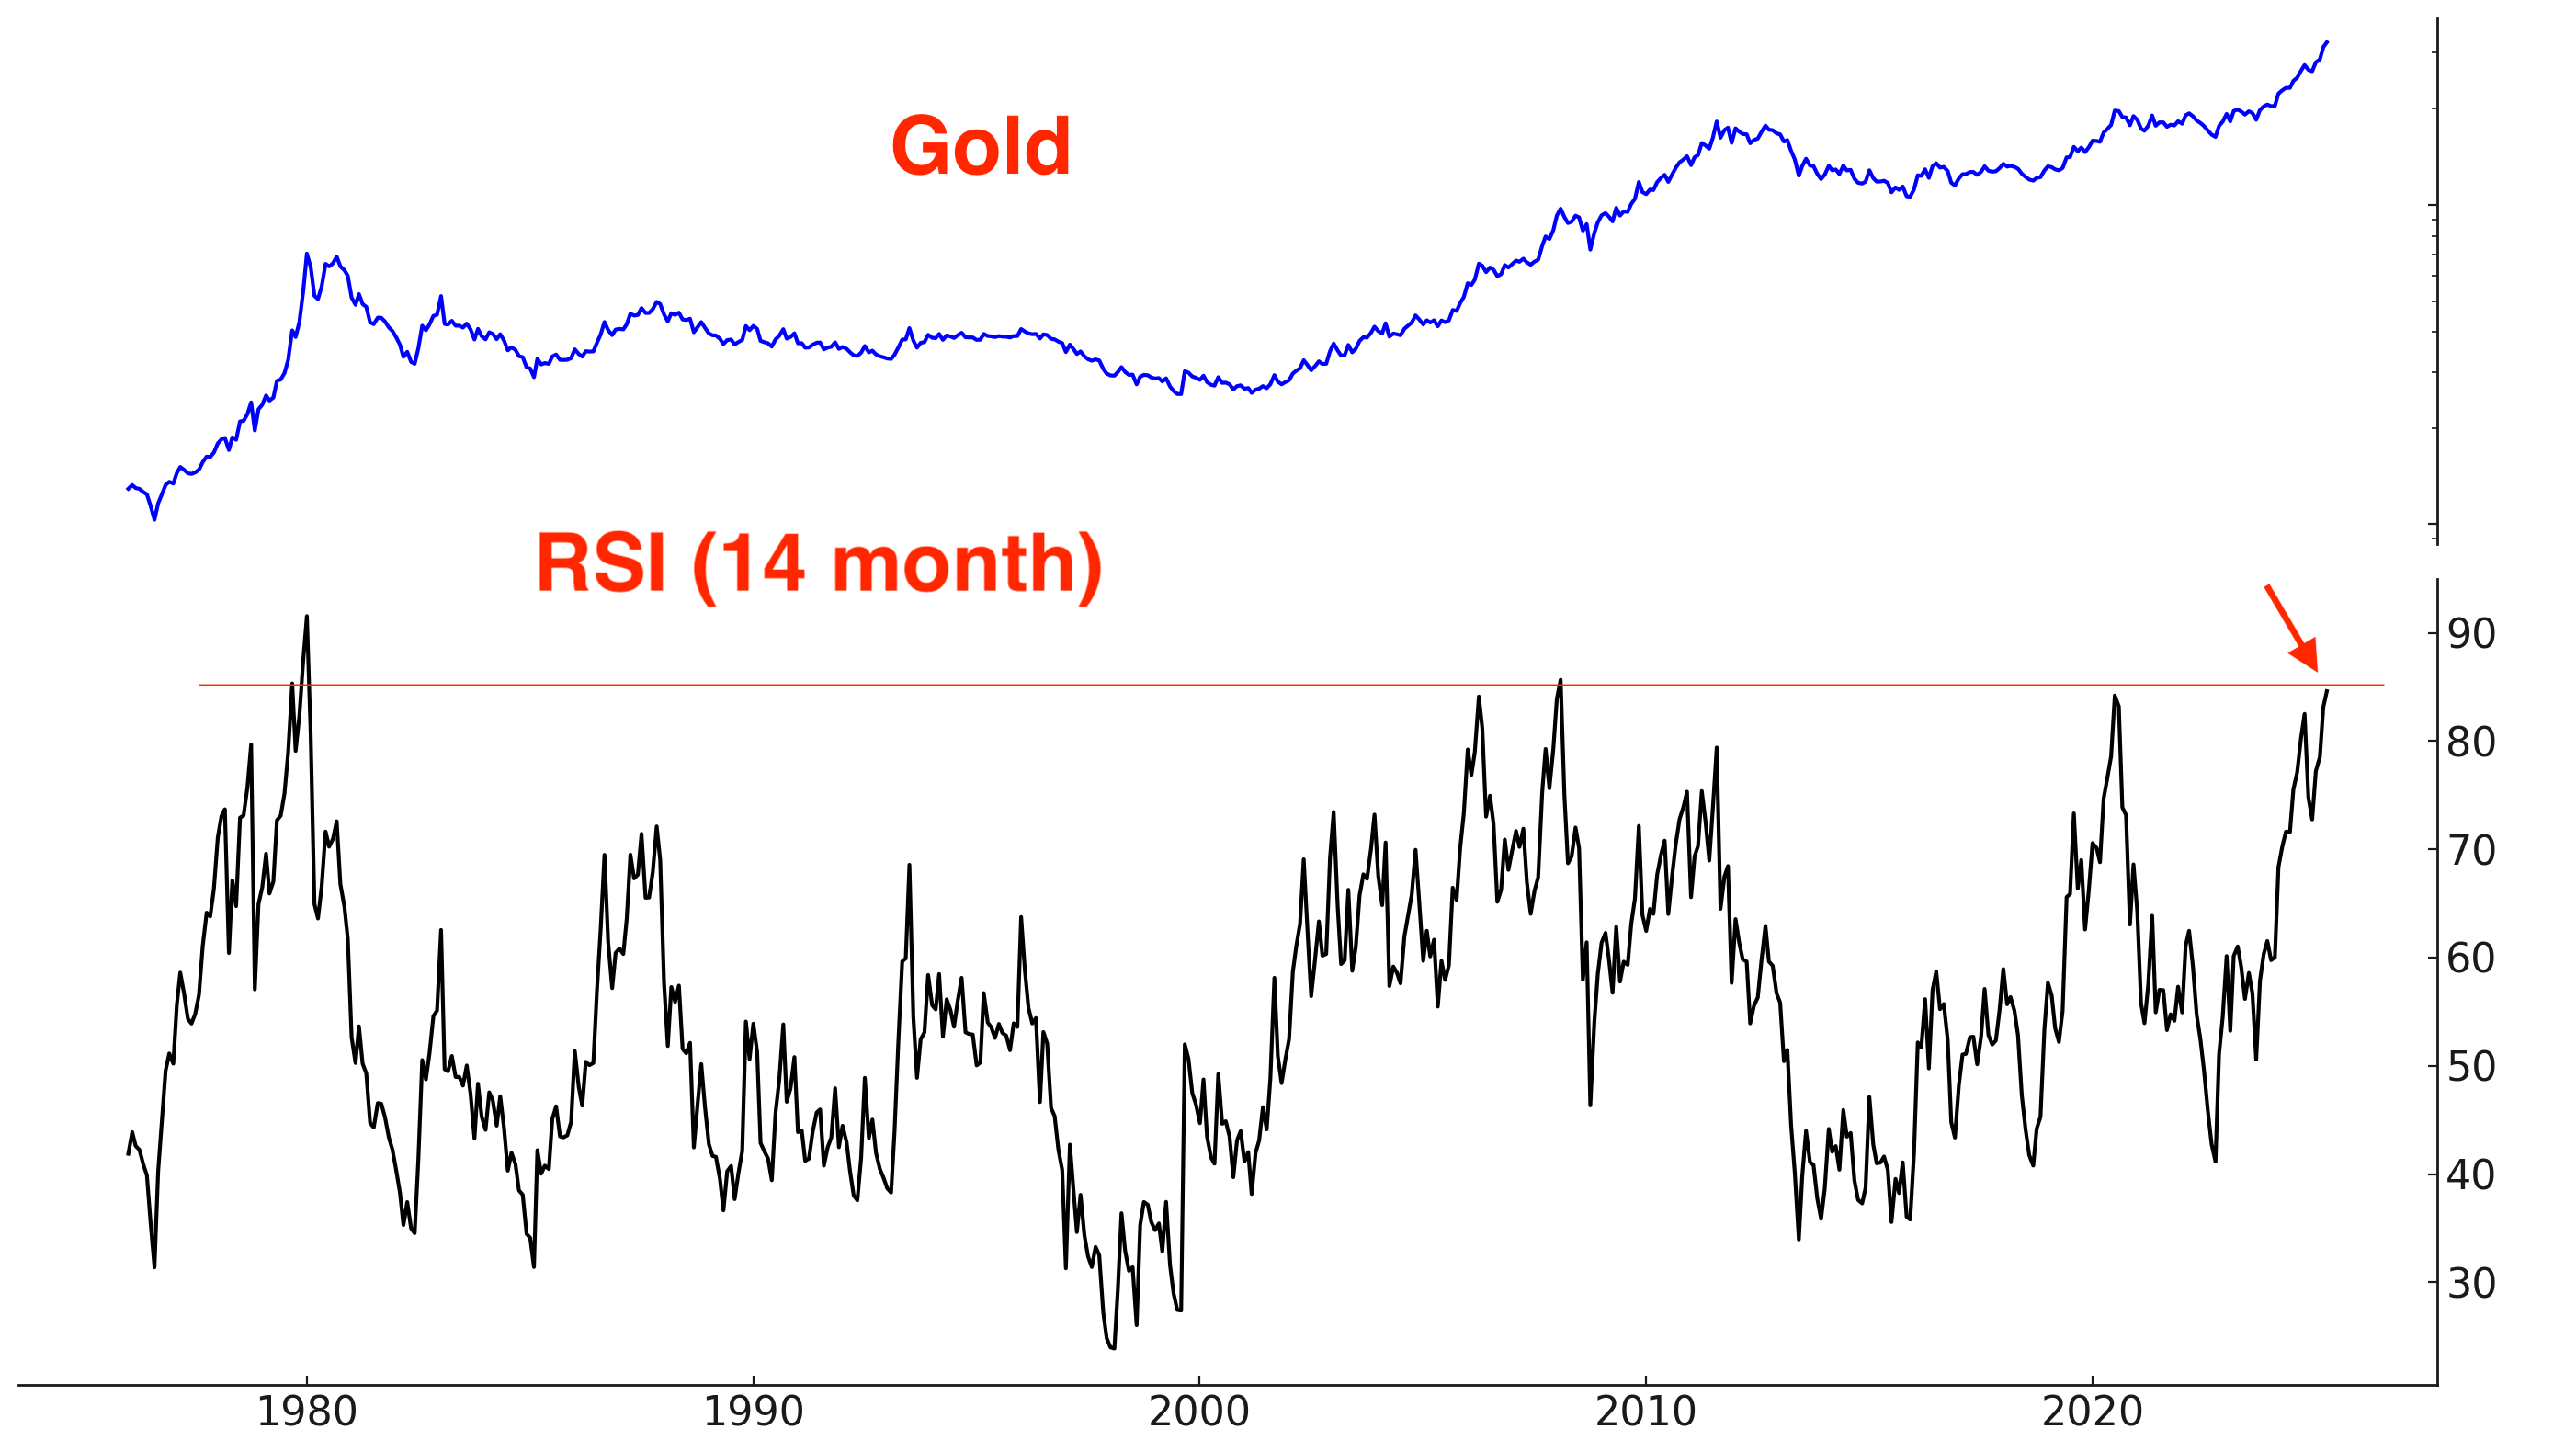
Gold is firmly trending higher:
Gold’s sentiment remains elevated:
Overall, risk/reward does not favor gold bulls right now.
It’s worth noting the divergence between gold and silver over the past 2 weeks. While gold rallied to new all-time highs, silver has significantly underperformed.
Silver is being pulled by 2 opposing forces:
On one hand, gold’s safe-haven rally is dragging silver Up.
On the other hand, rising recession fears have weighed on industrial metals like copper—and silver is feeling that pressure too, given its higher exposure to industrial demand than gold.
I exited my gold position but held onto 1/2 of my silver exposure. I believe that safe-haven demand for gold will start to fade, while metals that were pressured by recession fears—like silver—have more room to rally.
I also expect other commodities impacted by recession concerns—such as crude oil—to rebound as well.
India & China
I’m bullish on India, and I believe this is the Indian Century. While much of the world is focused on the U.S.-China economic rivalry, few people recognize that India stands to be one of the biggest beneficiaries.
Trump’s tariffs may bring back some high-end manufacturing to the U.S., but they won’t revive labor-intensive manufacturing. Labor in many developing countries costs a fraction of U.S. wages—often just 10%—and tends to be more flexible. So why do I see India, rather than Southeast Asia, emerging as the biggest winner from Trump’s tariffs on China?
India faces several structural disadvantages in manufacturing compared to China such as high levels of corruption, land acquisition challenges, and labor union rigidity. However, the U.S.’ tariff policies are effectively acting as a form of “affirmative action” in global trade. As long as Indian exports are subject to lower tariffs than Chinese exports, India has an automatic advantage in international trade, despite its internal inefficiencies.
Additionally, the rapidly growing presence of Indian-Americans in leadership roles across U.S. corporations and the U.S. government creates a natural affinity for working with India instead of China in goods & services trade.
Even if the U.S. and China eventually reach a trade deal, I expect tariffs on Chinese goods to remain higher than those on Indian exports over the long term. That’s why India’s ruling party, the BJP, favored a Trump victory before last November’s election—they understood that his trade war would hurt China, thereby boosting India’s manufacturing industry.
As for Southeast Asia, there are 2 key limitations:
Population: Southeast Asia’s combined population is less than half of India’s. For mass-scale manufacturing that can rival China, only India has the necessary labor pool.
Geography: Southeast Asia is fragmented across numerous islands, making it difficult to form manufacturing clusters. India, with its vast, contiguous landmass, can develop efficient industrial hubs in states like Tamil Nadu, Karnataka, Andra, Maharashtra, and Gujarat.
In short, India is uniquely positioned to absorb the long-term shifts in global supply chains triggered by the U.S.-China economic war.
To prove my point, Apple is expanding rapidly in India and shifting production out of China. The U.S.-China trade war is a once-in-a-century gift for India:

I have a small long position in Indian equities.
Trend: Indian equities are in a bottoming process:
Outflows from Indian ETFs have stabilized:

Here are the % of Nifty 50 stocks above their 200-DMA:

I am more long term bullish on India than China. However, that doesn’t rule out a short-term bounce in Chinese stocks following the sharp sell-off last Friday and this Monday. The decline saw widespread, panic-driven selling:

Bonds
Last week I wrote that a stock market bounce should lead to a pullback in bonds.
Bonds didn’t just pullback this week. They sank.
Bonds are under pressure as foreign holders—including China—reduce their exposure to U.S. assets. This selling is also hurting the U.S. dollar. Additionally, there are concerns that the initial effect of tariffs on China could lead to a resurgence in inflation, which further hurts the bond market.
In the short term, I expect U.S. Treasury bonds will bounce along with the U.S. Dollar. Long term, I believe that bonds will swing within a wide range as they’ve done over the past few years. I have a small long bonds position that’s not really consequential to my P&L.
This week saw a record spike in TLT put volume as bond prices sank:

TLT ETF volume spiked, which is normal when a market collapses:

TLT continues to swing within a wide range:
Sentiment is mostly neutral:
Currencies
The U.S. Dollar and bonds sank this week while gold rallied. I believe that the Dollar and bonds will rally together while gold falls.
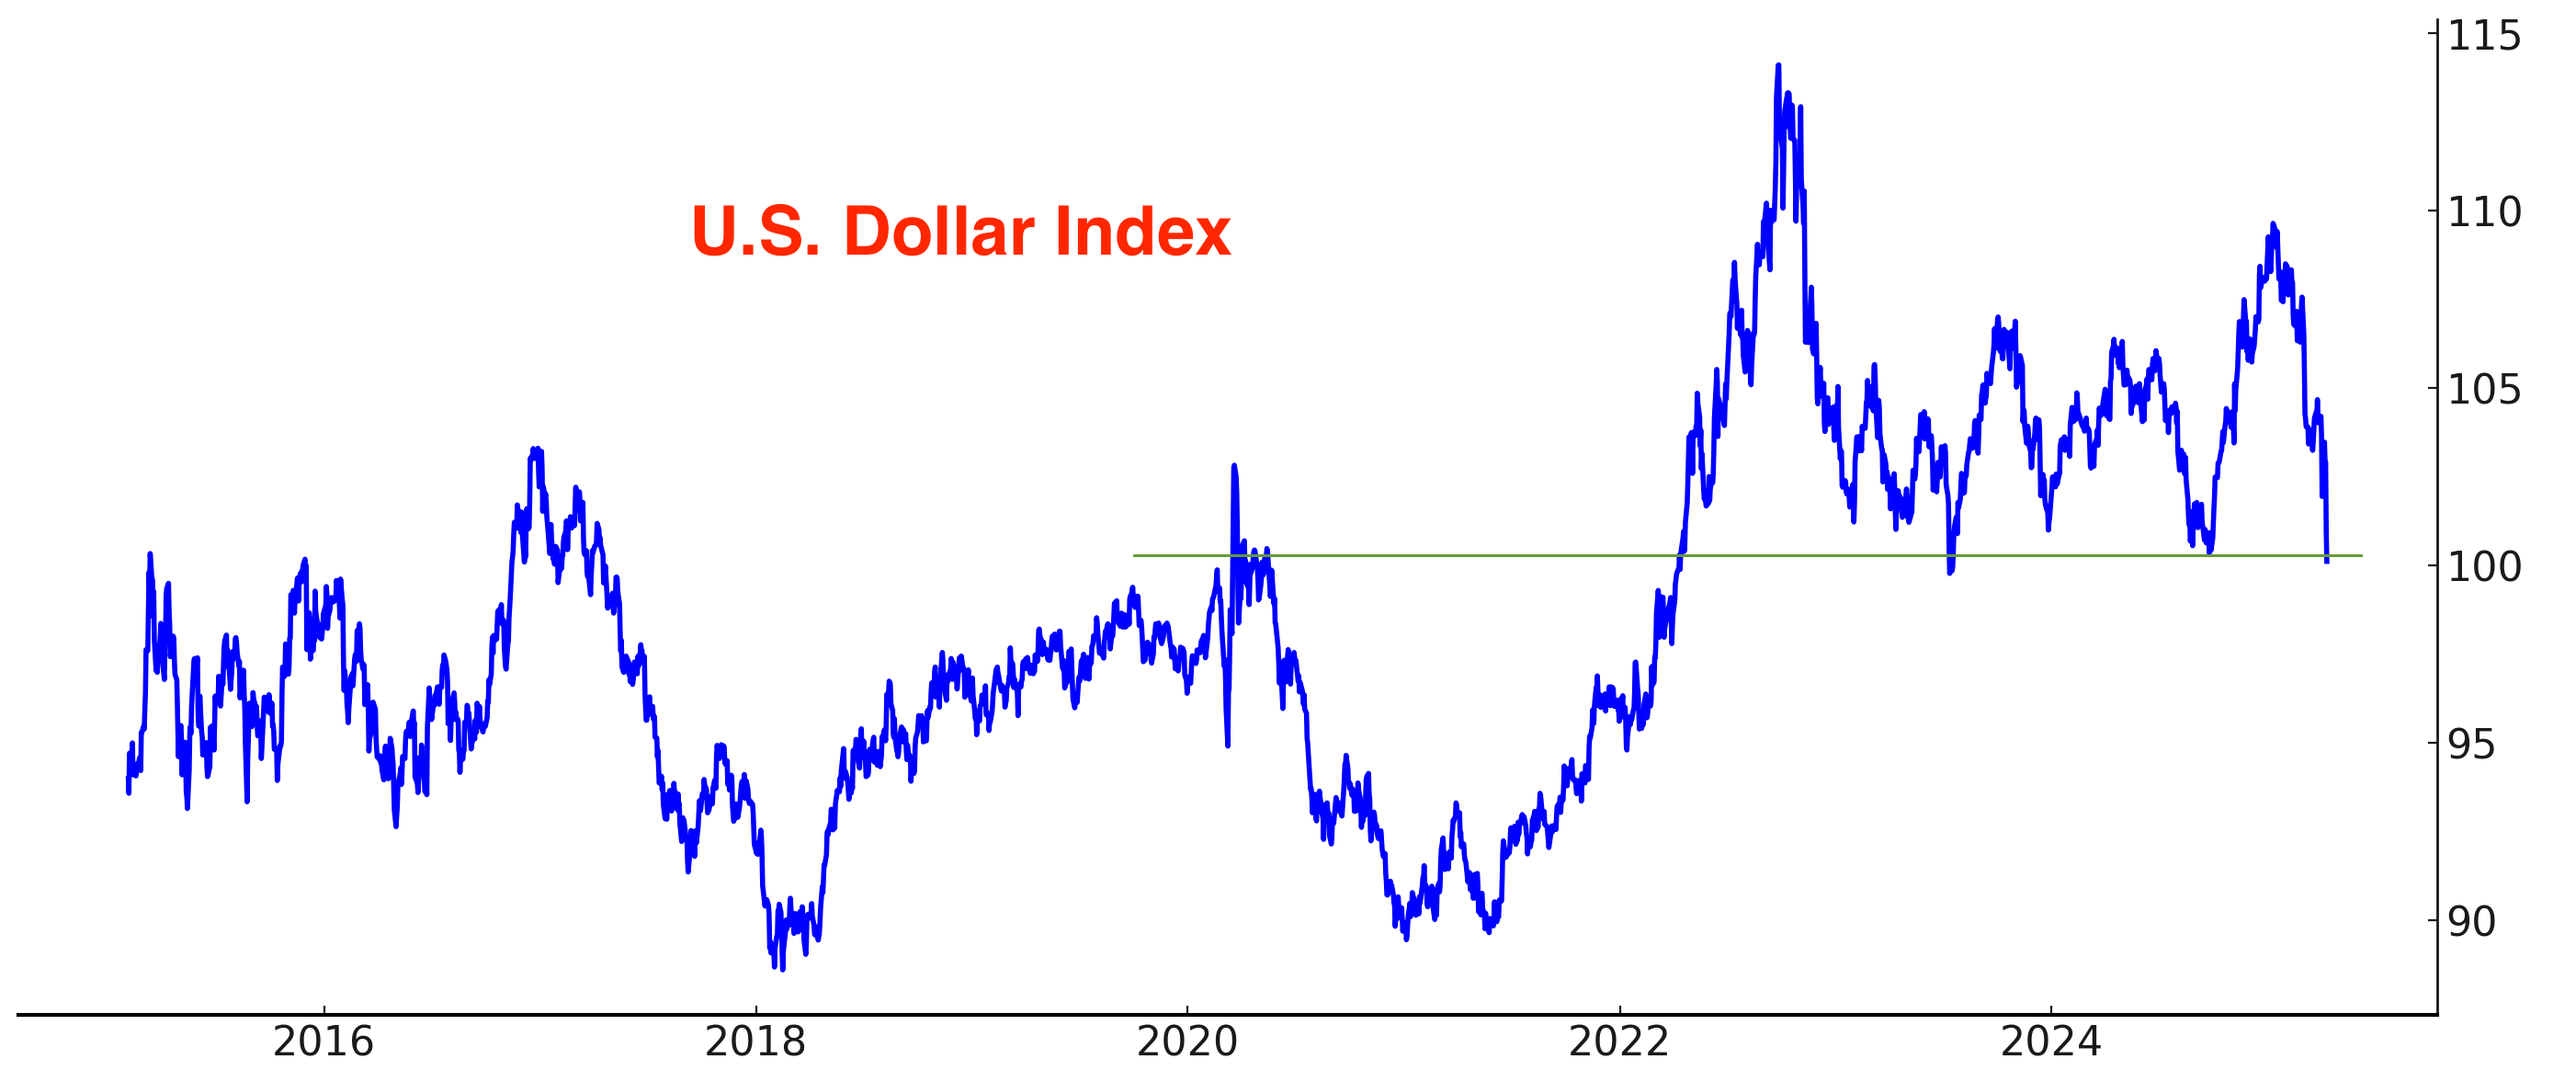
The Dollar is trending Down:

Sentiment is coming down:

I do not have a currencies position.
Bitcoin
Bitcoin is a high-beta, risk-on asset that generally rises when stocks rally and struggles when stocks fall. While its directional correlation with stocks is clear, its price action is unique—less wave-like, more staircase: sharp moves followed by prolonged consolidation.
Bitcoin has performed relatively well while stocks crashed. Usually a stock market crash of this magnitude would see Bitcoin collapse, which hasn’t happened so far. I have no position in crypto, but a stock market rally will probably coincide with a Bitcoin rally.
My Portfolio
*Click here if you don’t understand how I trade
My portfolio right now:
Mean-Reversion Position – Long Oversold Tech Stocks: Targeting at least a mean-reversion bounce. I increased my position size earlier this week and will buy more if stocks re-test the bottom. This is now my biggest position.
Core-position - Long Gold: SOLD. For months my biggest position was long gold. I expect a correction in gold.
Mean-Reversion Position (Non-Core) - Long Silver: Sold 1/2 of my silver position. Waiting for a mean-reversion bounce.
Mean-Reversion Position (Non-Core) - Long Indian Equities: Big beneficiary of Trump’s tariffs.
Mean-Reversion Position (Non-Core) – Long U.S. Treasury Bonds: Small position size.
This content is for informational purposes only and is not financial or investment advice. I am not a licensed financial advisor. Trading involves risk, and past performance does not guarantee future results. You are responsible for your own financial decisions, and I am not liable for any losses.
Great read & data; thanks. The insider buying (really the lack thereof) is telling. The uncertainty that is holding execs back from BTFD is permeating corporate actions as well. Important time to stay very alert.
thanks again. It is hard to see positive catalysts for stocks at this stage. It will take quite some time to negotiate deals let alone have China come to the table to negotiate, i have hard time to see off ramp here so none lose face in this poker play. Besides, trade wars are usually premise for geopolitical unrest (ie 1930s)...What could be the way for China to come to the table w/o losing face? How could it be a bottom if we haven't yet priced in a recession potential and reset once companies provide very poor guidance from a strong Q (as people would have stockpiled)...the earnings season might be the trigger for more downside on stocks no? No ceo can plan investment nor spending in that environment IMO leading too poorer guidances and lower P/E and thus lower stocks...?cheers