
Markets Report: important week ahead
Next week is extremely important for markets. Here's my trading plan.

Next week will be extremely important, with Trump expected to announce tariffs on Wednesday (April 2). In highly uncertain times like today, good traders should not be focused on predicting the news. Forecasting the news is a 50/50 bet. And even if you correctly forecast the news, the market’s reaction to the news adds another layer of uncertainty.
Instead, traders should focus on risk management, think about the probabilities of various scenarios, and keep dry powder.

My Portfolio & Market Outlook
*Click here if you don’t understand how I trade
Mean-Reversion Position (Non-Core) – Long Oversold Tech Stocks:
Currently at 40% of the potential max size. Targeting at least a mean-reversion bounce. Will increase position size if stocks fall more.Core Position – Long Gold and Silver: long with a trailing stop. Risk of a correction is increasing.
Black Swan Position – Long Chinese Equities: long with a trailing stop.
Mean-Reversion Position (Non-Core) - Long Indian Equities: Was extremely oversold, mean-reversion rally is now underway.
Mean-Reversion Position (Non-Core) – Long U.S. Treasury Bonds: Small position size.
U.S. Equities
Last week I wrote “The stock market’s weak bounce thusfar is a minor cause for concern. While not a major warning sign, it is a development worth monitoring.” When markets are deeply oversold but fail to bounce vigorously, it often signals underlying weakness.
This week validated my concern, as equities struggled to rally despite extremely oversold conditions. My portfolio remains tactically positioned for a bounce, but the focus remains on risk management and maintaining ample dry powder in the event of further downside.
Next week’s tariff news will determine whether the stock market makes new lows or pushes higher. Let’s dig into the data.
Sentiment Surveys
The latest Consumer Confidence survey from the Conference Board shows a notable shift in sentiment:
A sharp decline in the % of Consumers expecting stocks to rise
A significant jump in the % of Consumers expecting stocks to fall

These big shifts in sentiment are rare, and historically were followed by stock market gains over the next 6-9 months.
The March 2007 case is particularly noteworthy: while consumers were ultimately correct in turning bearish (2008 crash), their timing was too early. Equities continued to rally for months before the bull market ended.
Other sentiment indicators remain subdued. The Investors Intelligence Bulls-Bears spread climbed back above 0, but remains low:

AAII Bears fell from 58.1% to 52.2%:

This is still quite high, with Bears remaining above 50% for 5 weeks in a row:

The NAAIM Exposure Index is finally coming down. It’s still not as extreme as Investors Intelligence or AAII:

Other sentiment indicators
The S&P 500’s Daily Sentiment Index has not rebounded:

My Short Term Sentiment indicator has rebounded:
CNN Fear & Greed remains in “fear” territory:
Options
The options speculative excess that I noted at the start of this year has been fully reversed:

QQQ Options Flow remains low:
Friday saw another huge spike in HYG put volume. As a result, HYG’s total Call - Put volume over the past month has fallen to the lowest level since the COVID crash:
Volatility
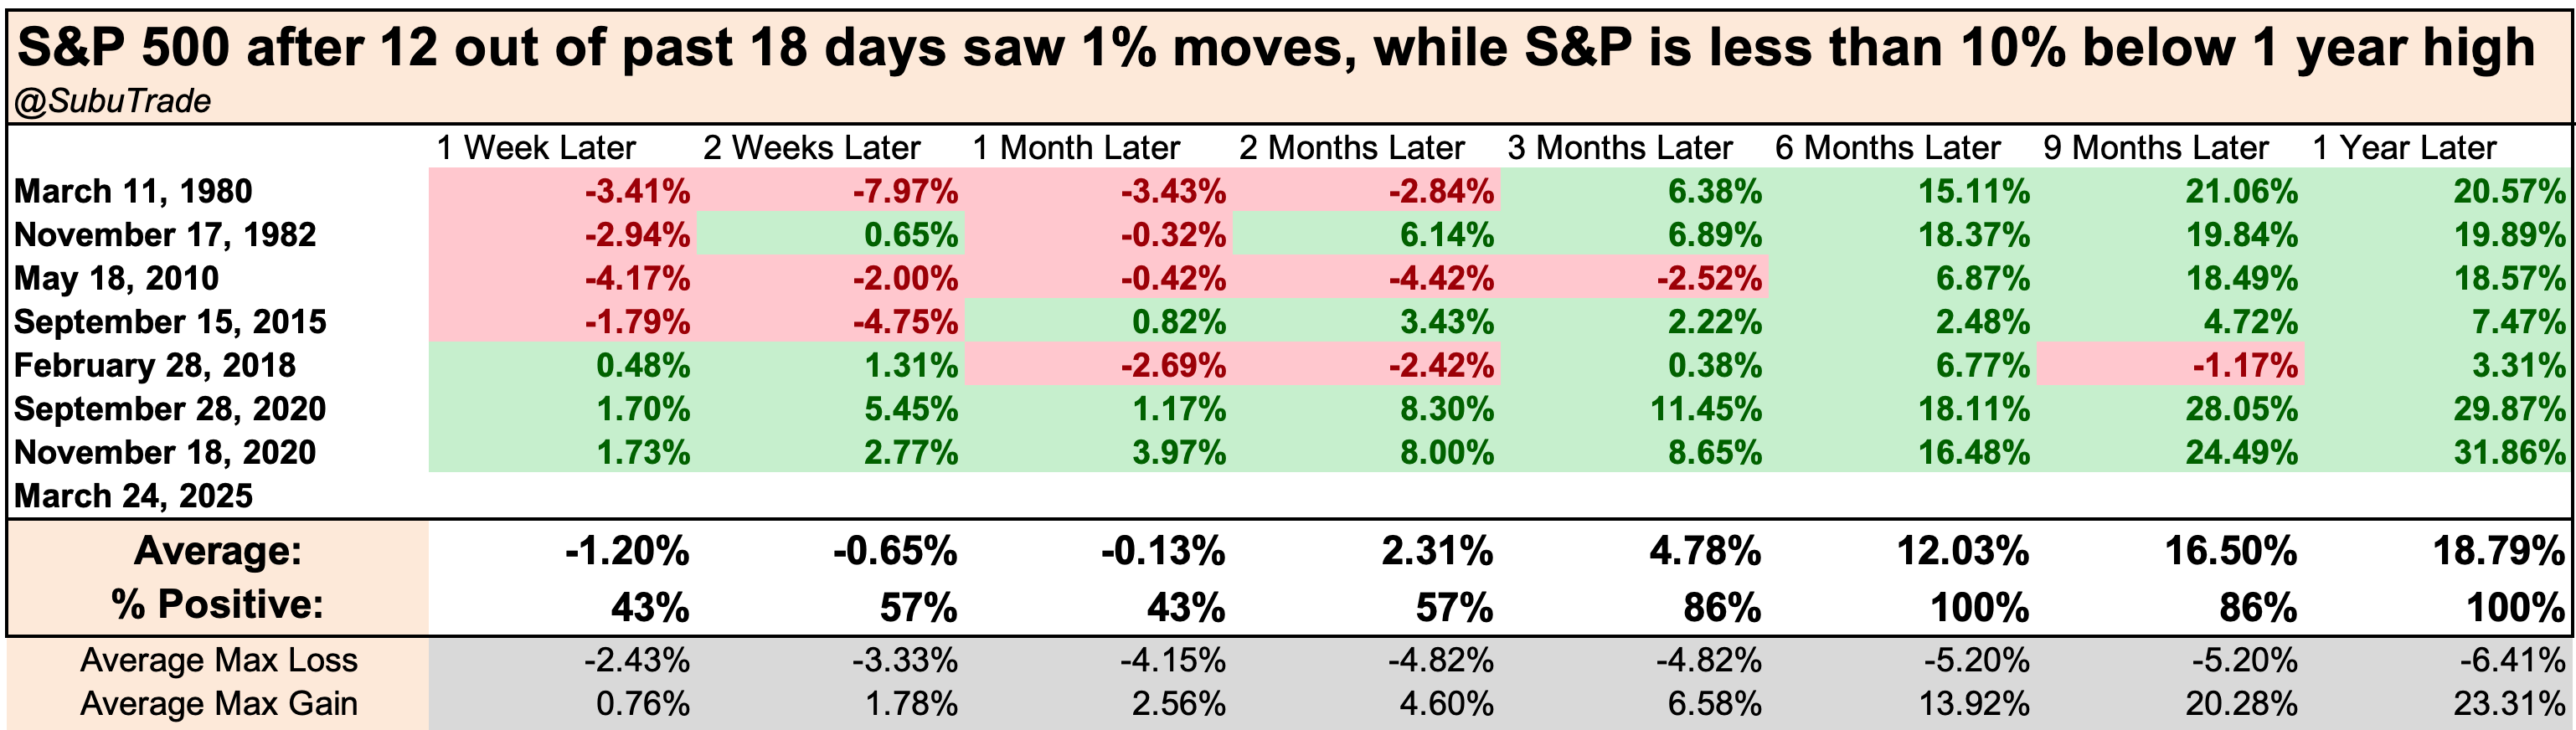
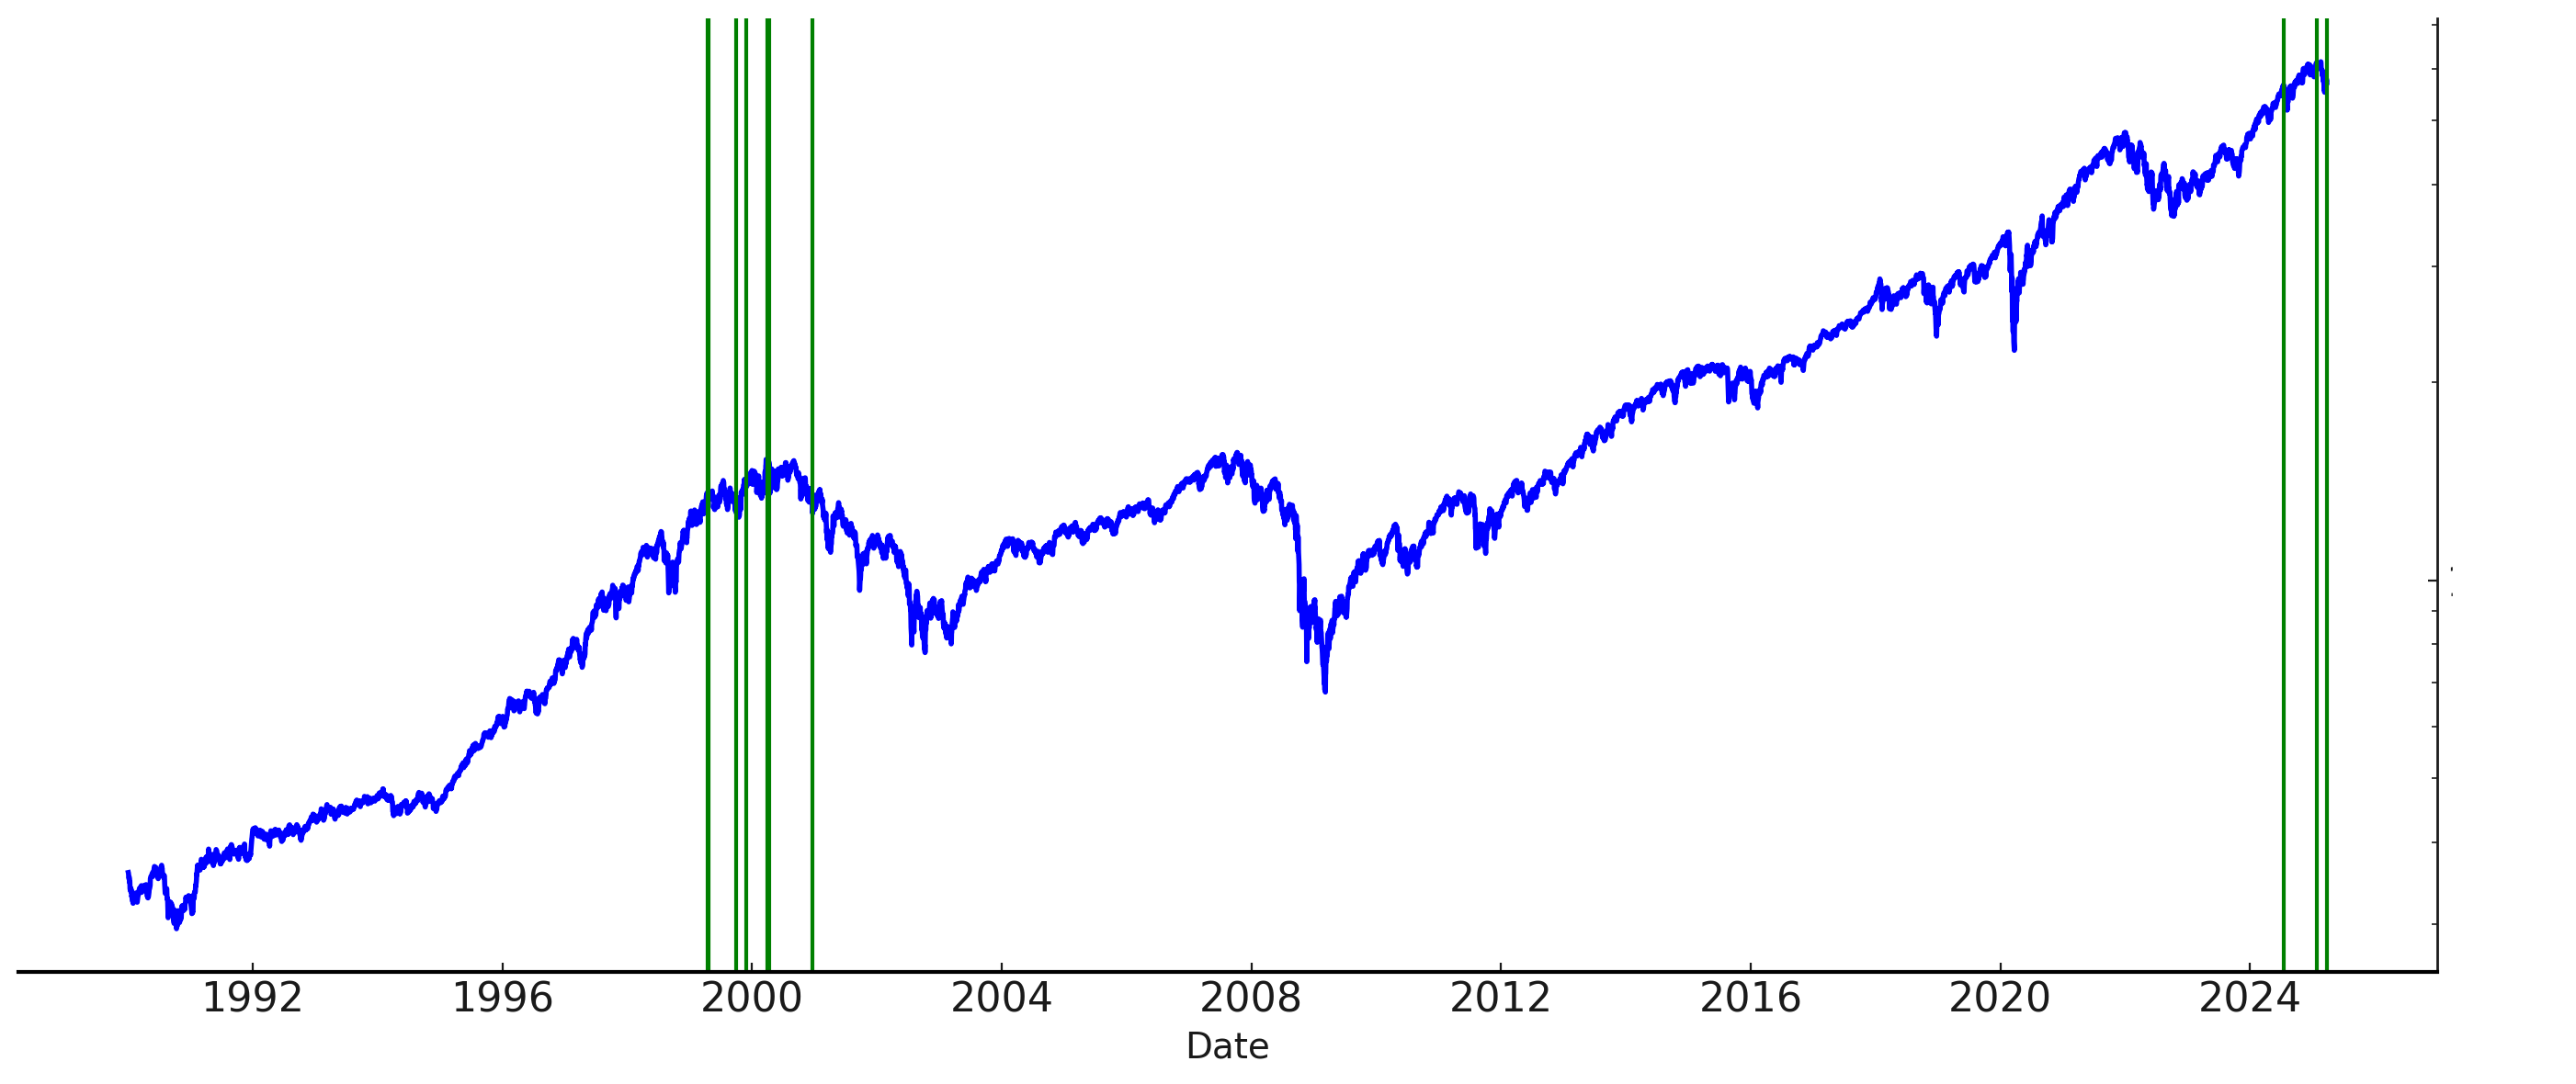
As I noted on Twitter/X, it’s been a volatile few months for stocks. As of Monday, the S&P 500 had moved ±1% in 12 of the past 18 trading sessions.
This kind of volatility is typical during bear markets (drawdowns of -20% or more), but less common when the S&P remains in correction territory (drawdowns of -10%). Historically, such volatility during a correction was usually followed by gains over the next 3-6 months.
Breadth
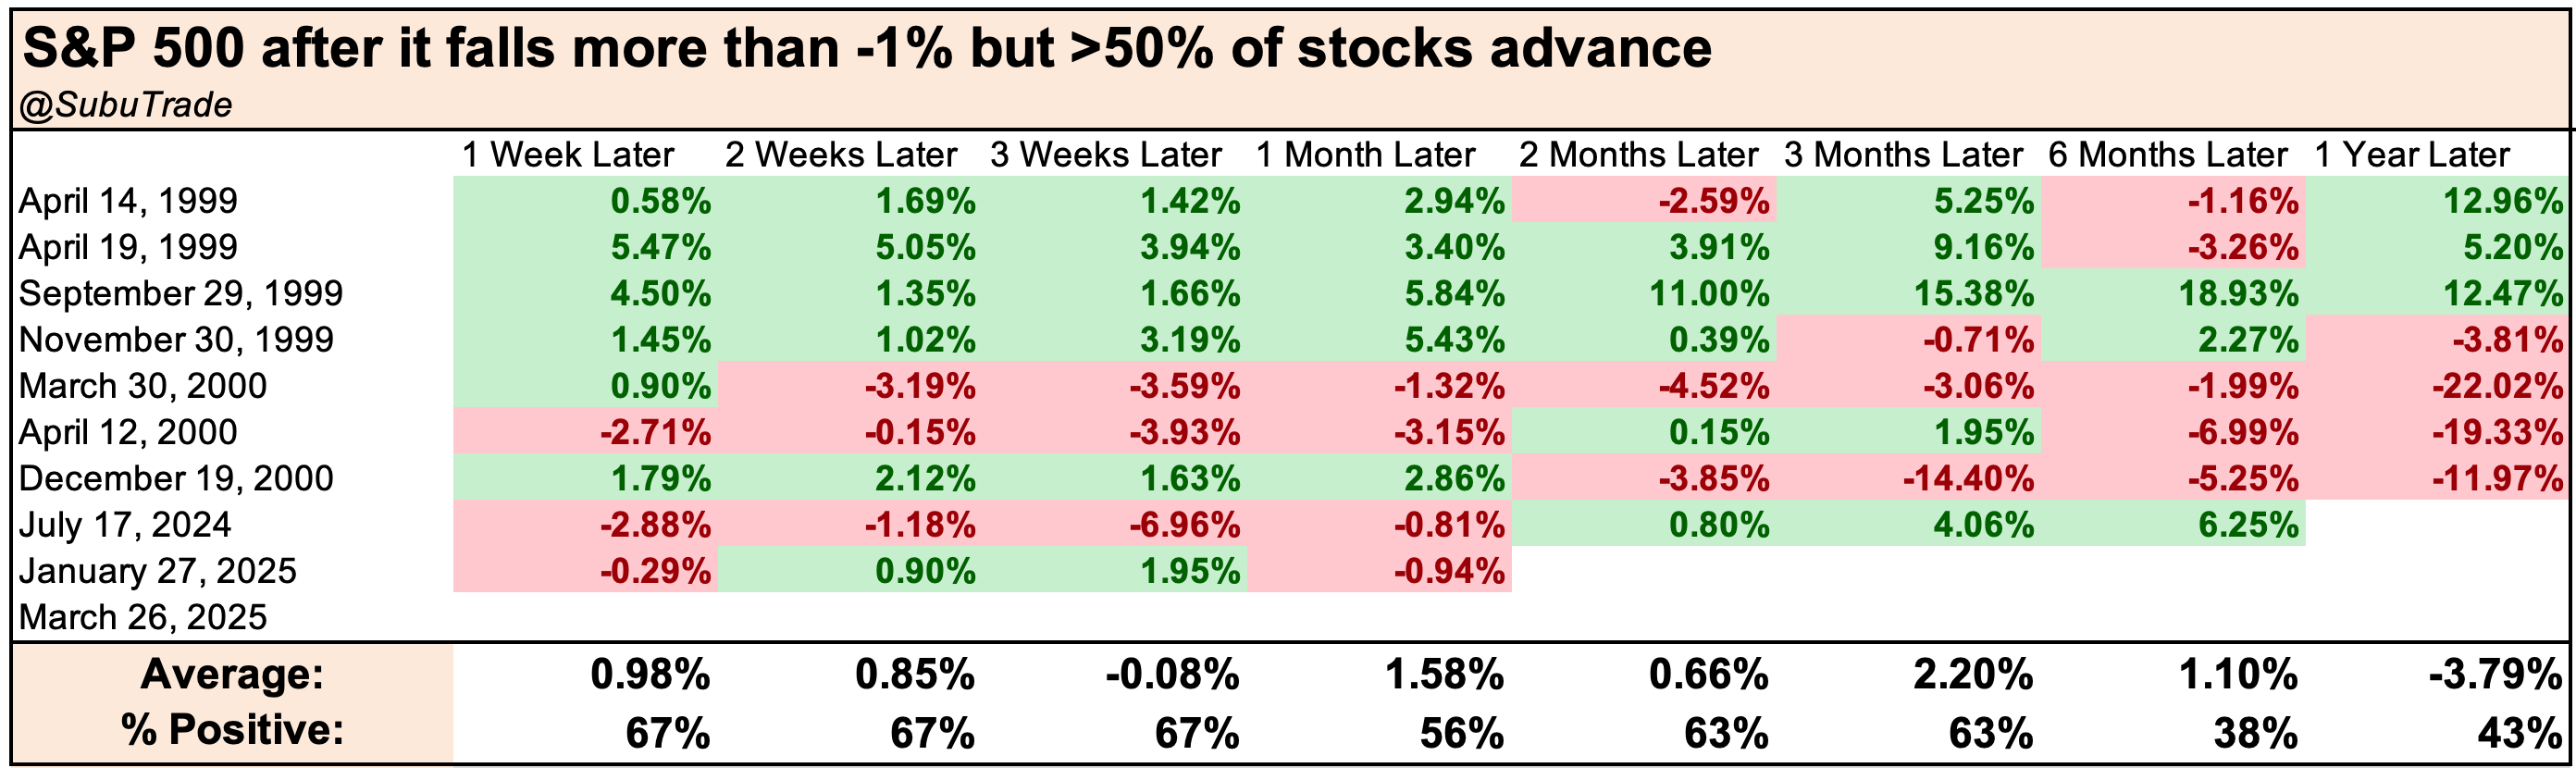
We saw some interesting breadth signals this week. Wednesday saw the S&P 500 fall more than -1% even though more than half of its stocks went up. A few large cap stocks dragged down the index:
This dynamic was common in 1999–2000, during the final stages of the dot-com bubble. It tends to emerge late in a bull cycle, reflecting extreme index concentration in a few large-cap stocks. As a result, weakness in these names can disproportionately drag down the broader index:
Speaking of breadth, less than half of the S&P 500’s stocks are above their 200 day moving average and 50 day moving average:
Corporate Insiders:
Corporate Insiders are not buying this dip:

Fund Flows:
TQQQ traders are contrarian: they buy the dip and sell the rip.
2 weeks ago I noted huge inflows into TQQQ as traders were betting on a rally. With the stock market attempting to find a bottom, TQQQ inflows are starting to come down:

VIX ETF traders are also contrarian: they sell when VIX spikes and buy when VIX falls.
2 weeks ago I noted huge outflows from VIX ETFs as traders took profits on their long volatility positions. With the stock market attempting to find a bottom, VIX ETFs are witnessing inflows:

Trend
The trend is your friend, until it ends. The U.S. stock market is no longer in an Up-trend:
Why does this matter? Because from a trend following perspective, it is better to buy when the stock market is trending higher than when it’s not:
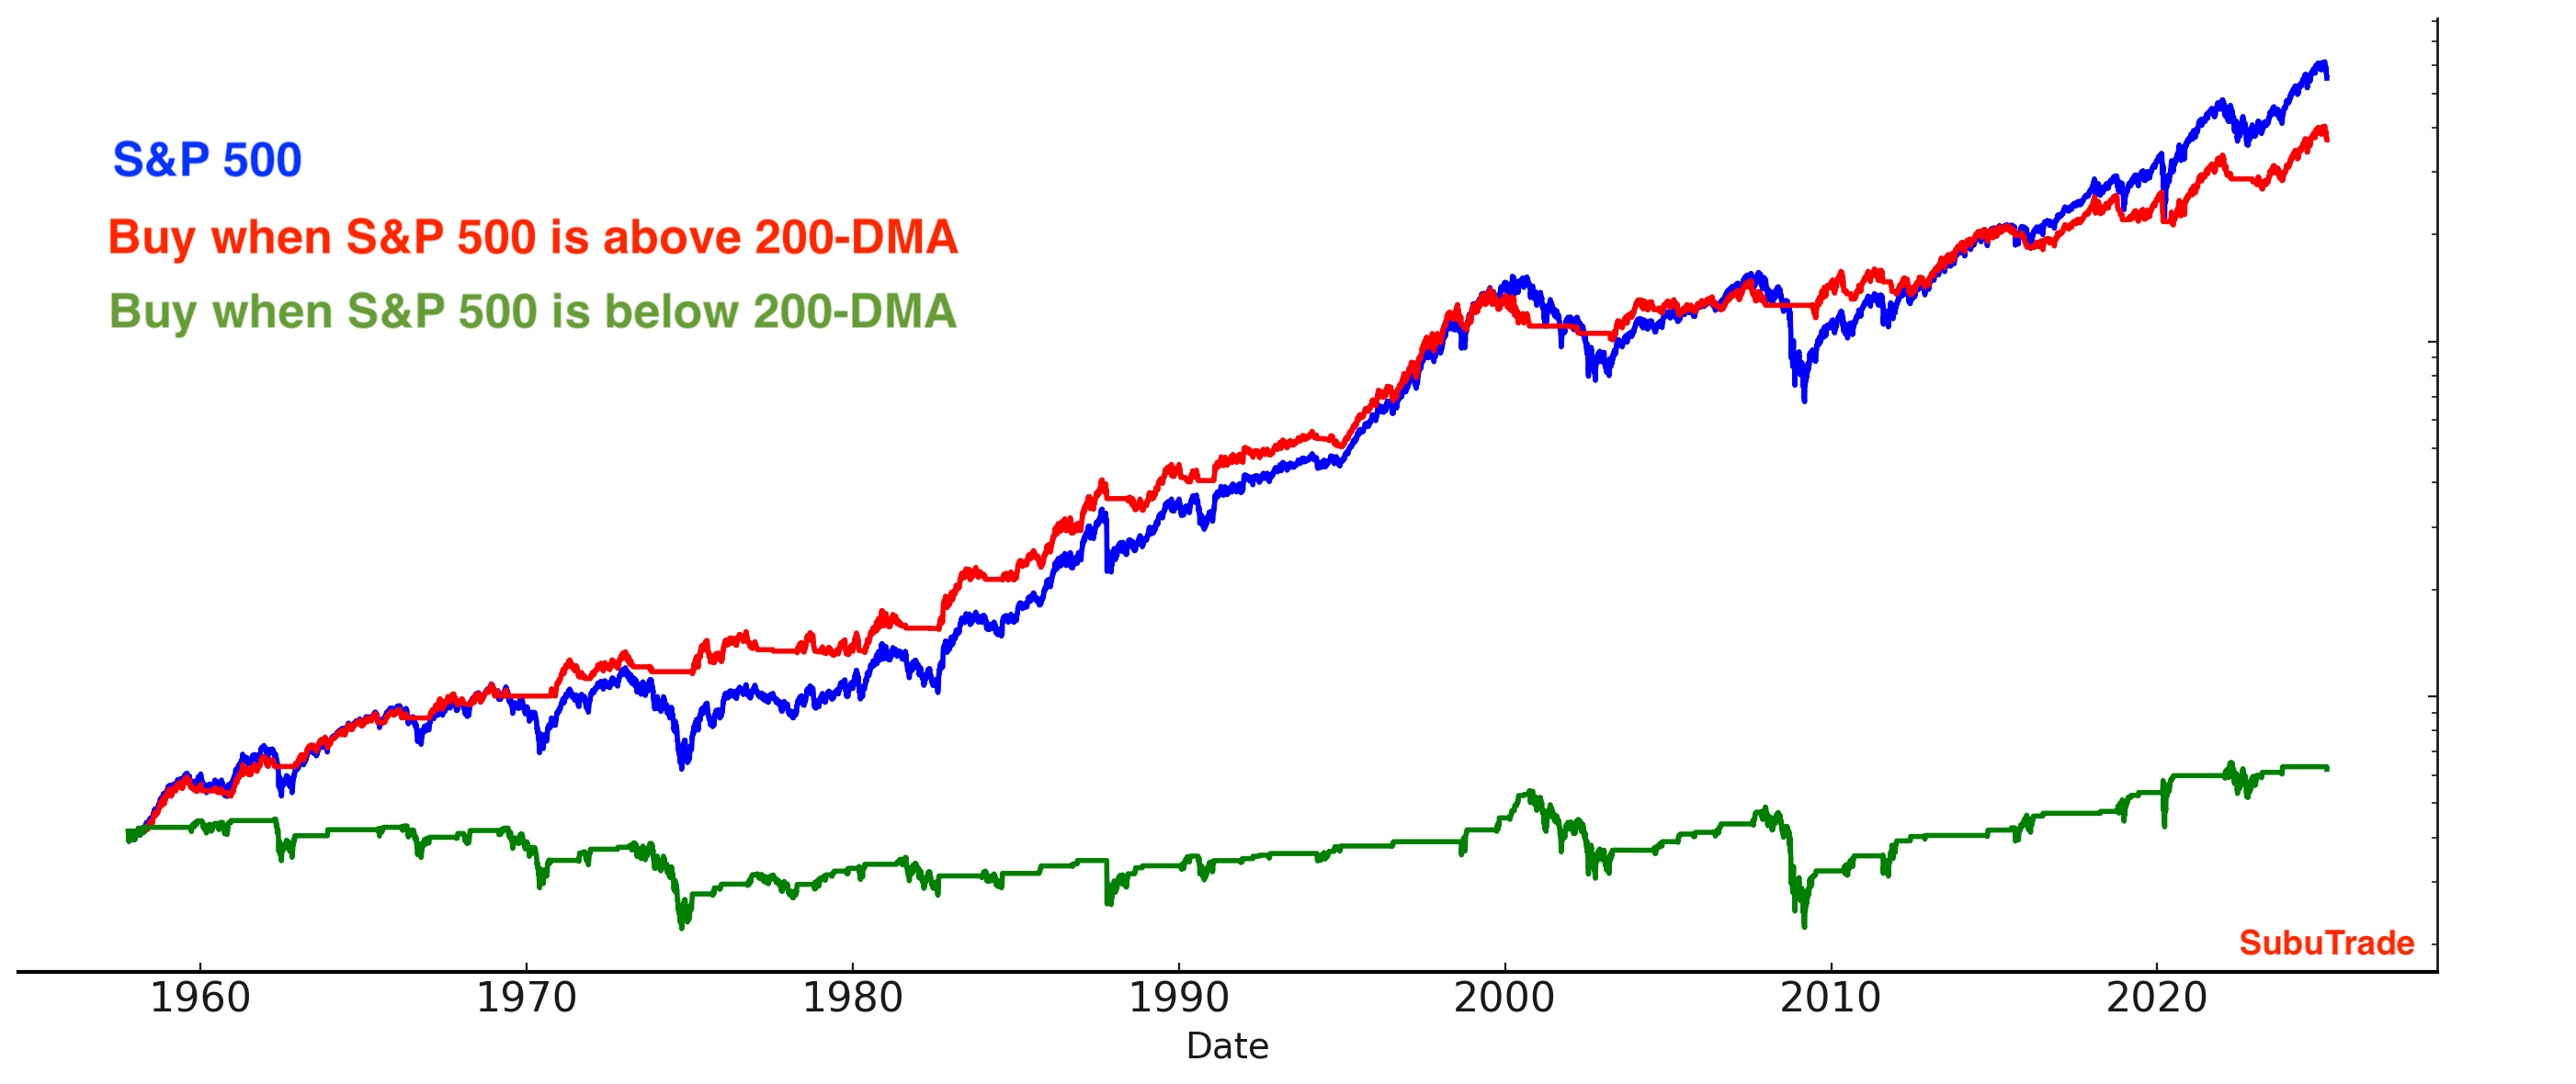
Trend followers should not be long stocks right now. The only traders who should be long are mean-reversion, contrarian traders.
It’s important to put this correction into perspective
According to Goldman Sachs, the stock market’s decline thusfar is of a normal magnitude. As I noted in December, 2025 was likely to be a year marked by elevated volatility. Following 2 years of strong returns in 2023 and 2024, it would have been unrealistic to expect a similar performance in 2025.

Gold & silver
I am long precious metals, but it’s important to be aware of mounting risk.
Gold is up 12 out of the past 13 weeks.

Historically, this was bearish for gold over the next 3 months:

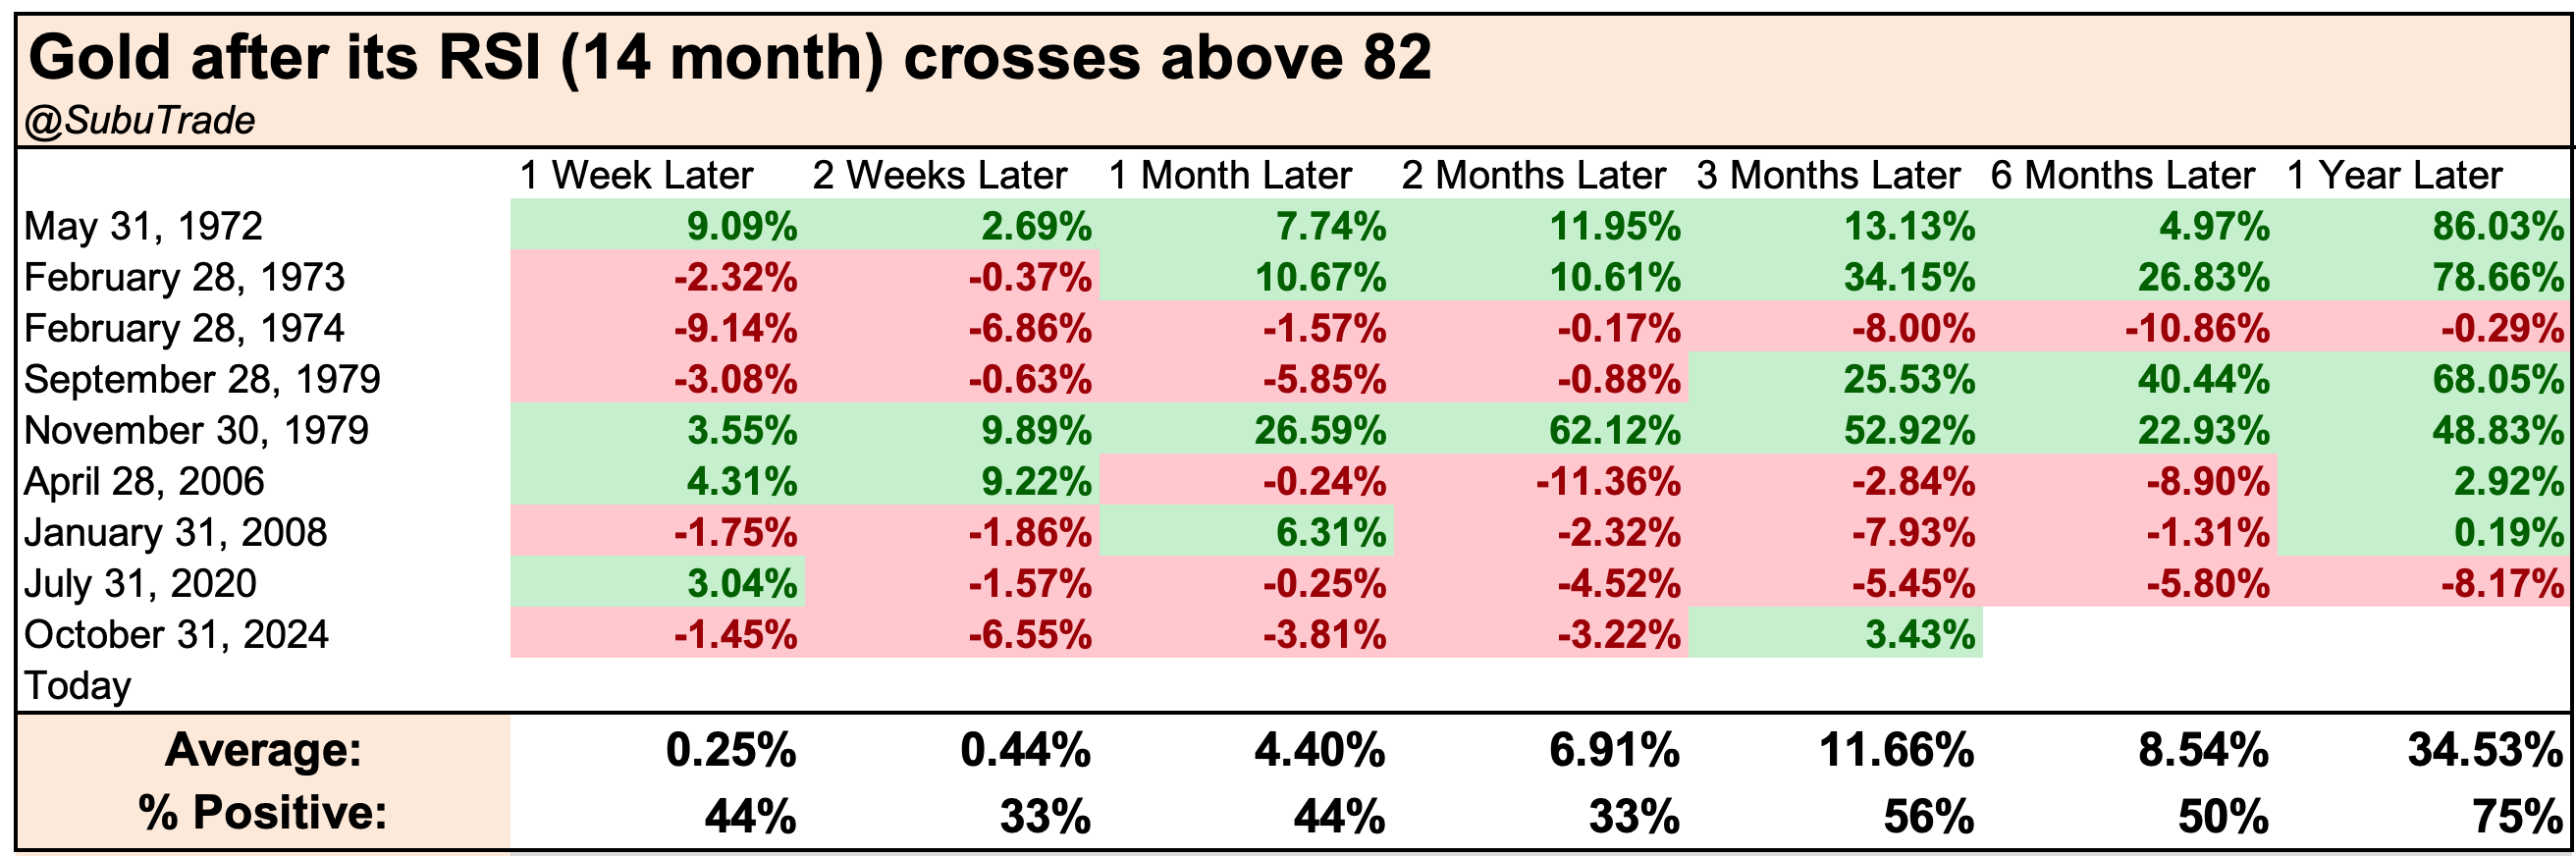
Gold’s monthly RSI is also extremely high:
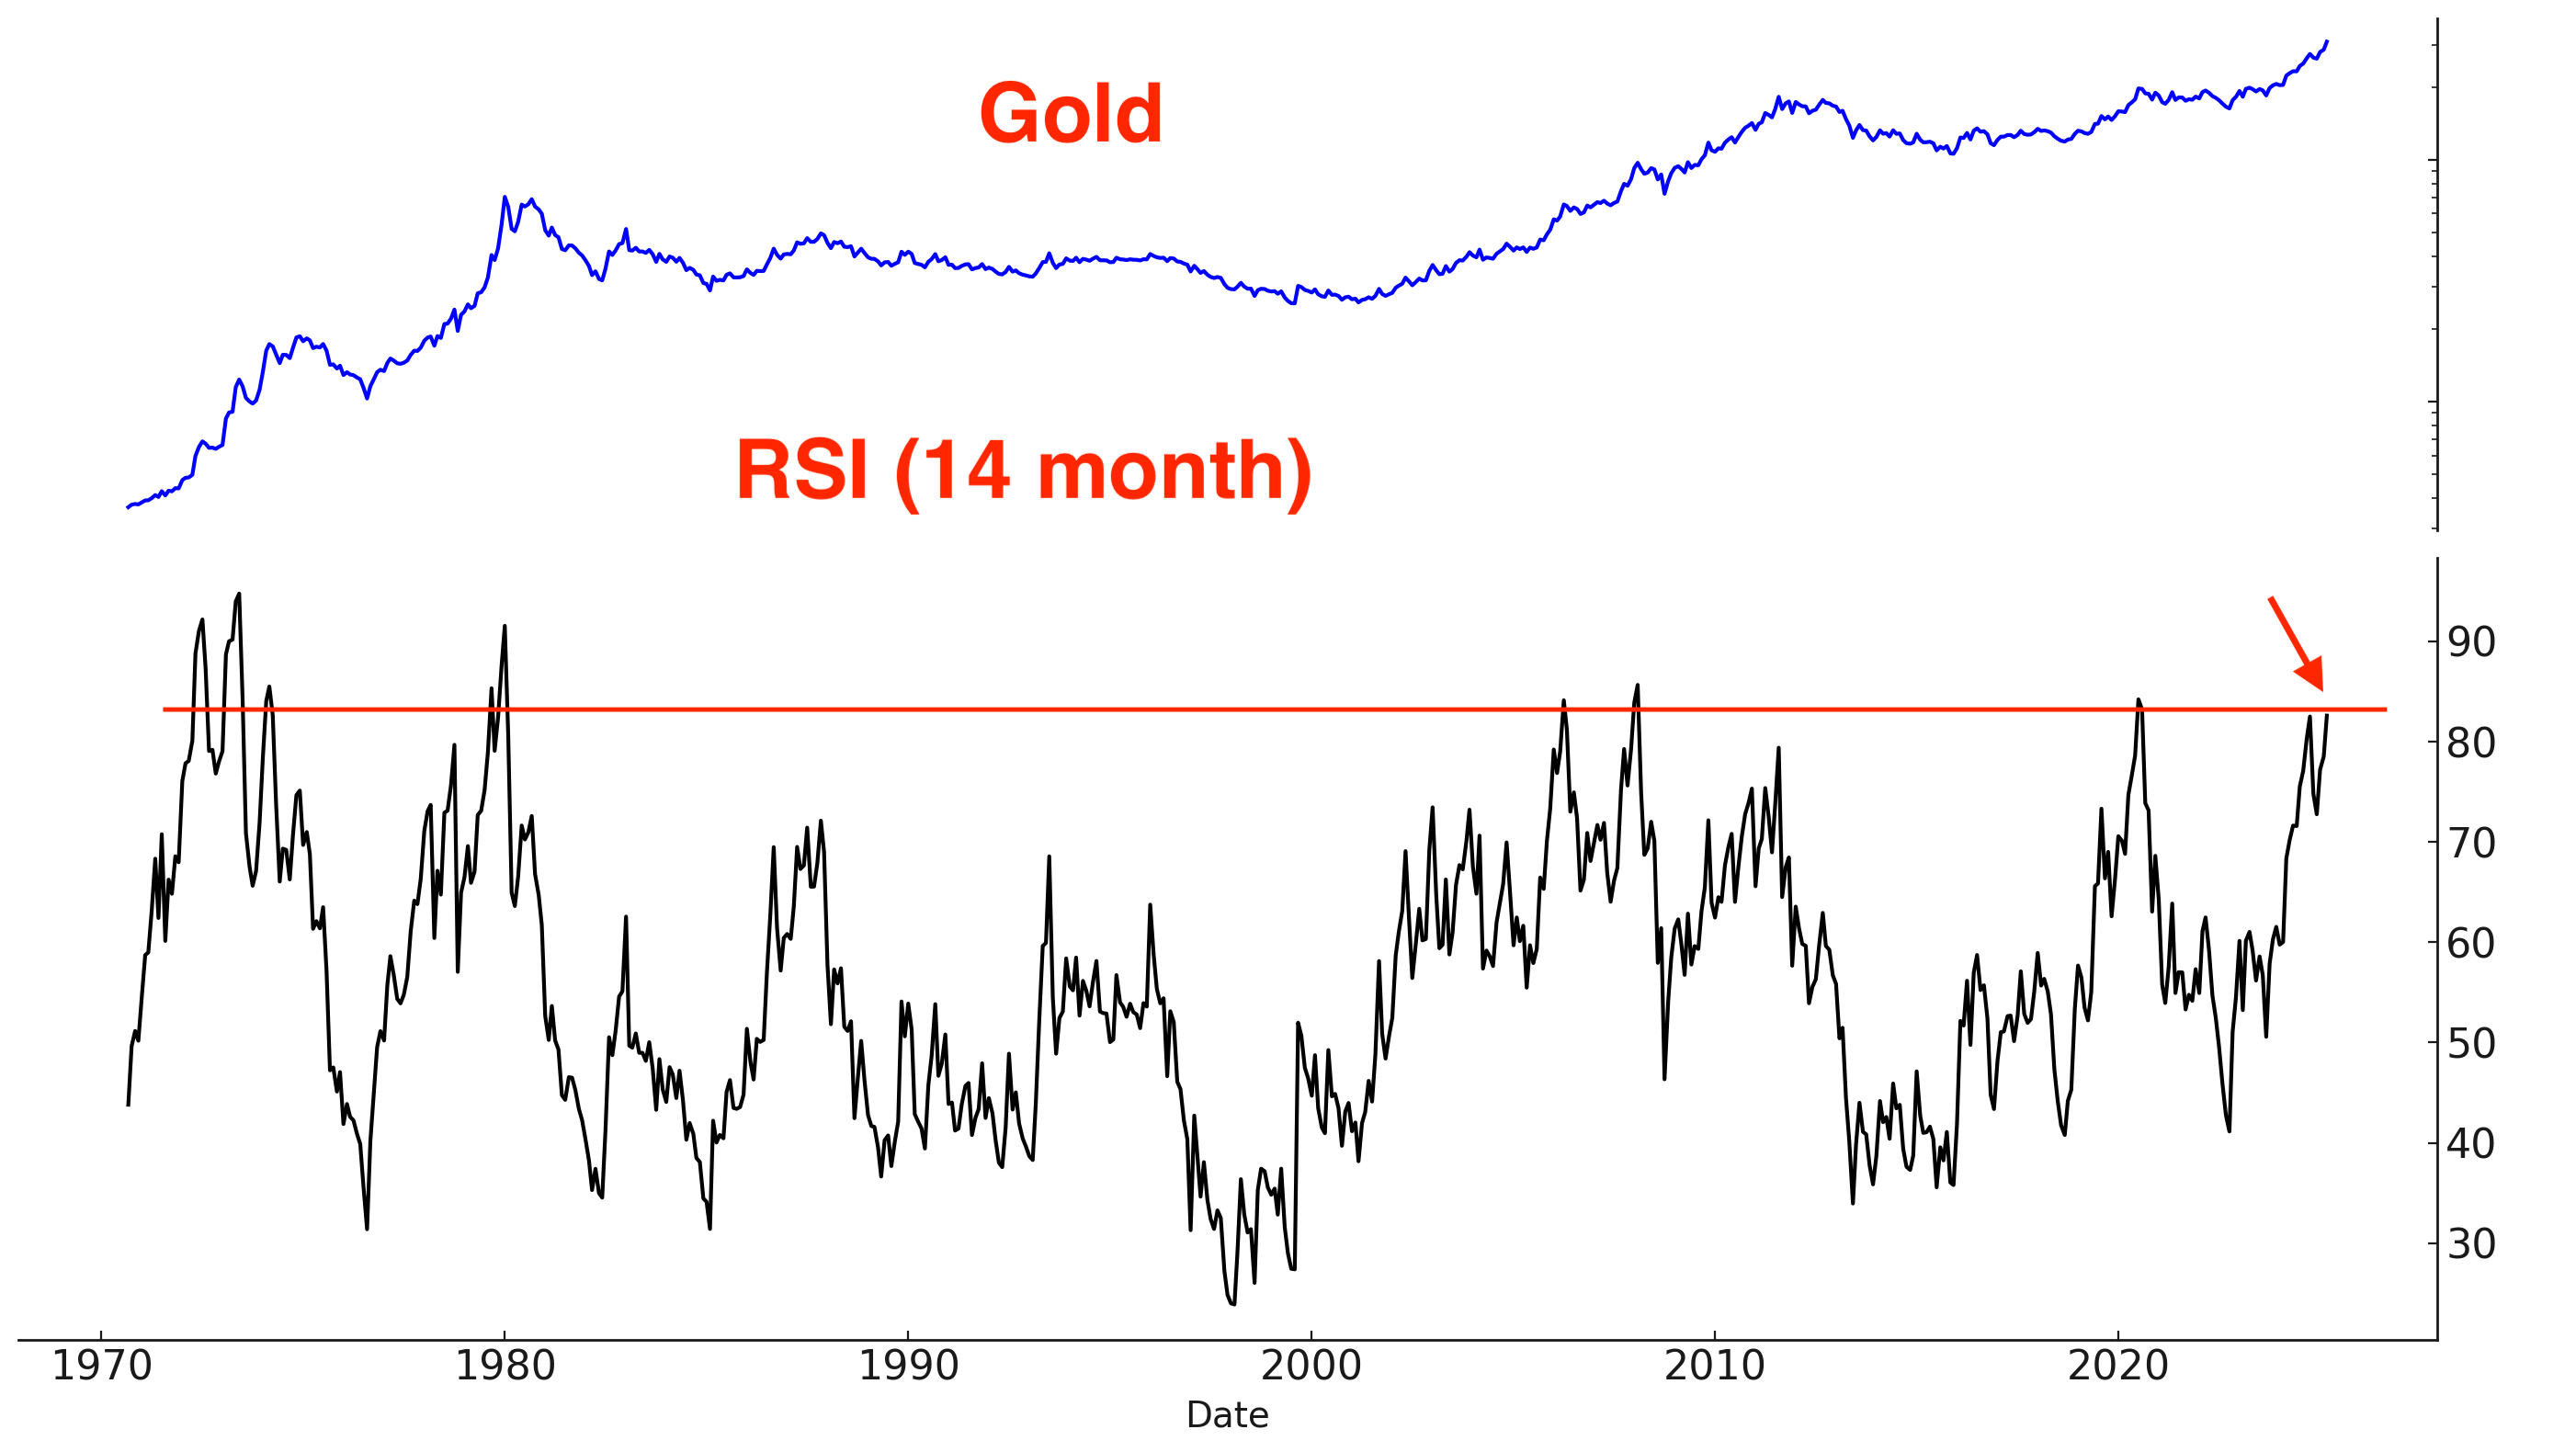
Over the past 20 years, this was a bearish sign for gold for the next 2 months:
GLD Options Flow remains elevated:

A correction in gold and silver is increasingly likely. The only question remains: will precious metals first make a blow off top, or is this the top right now?
For traders who do not have an existing long position, initiating new long positions here presents an unfavorable risk/reward profile given the overbought conditions.
Traders with existing long exposure can consider 2 options: partially reducing position size to lock in gains, or maintaining full exposure with a trailing stop to protect against downside risk. Cutting 100% of your long position may be premature, as there remains a non-negligible probability of a final rally. While the probability is not high, it cannot be ruled out.
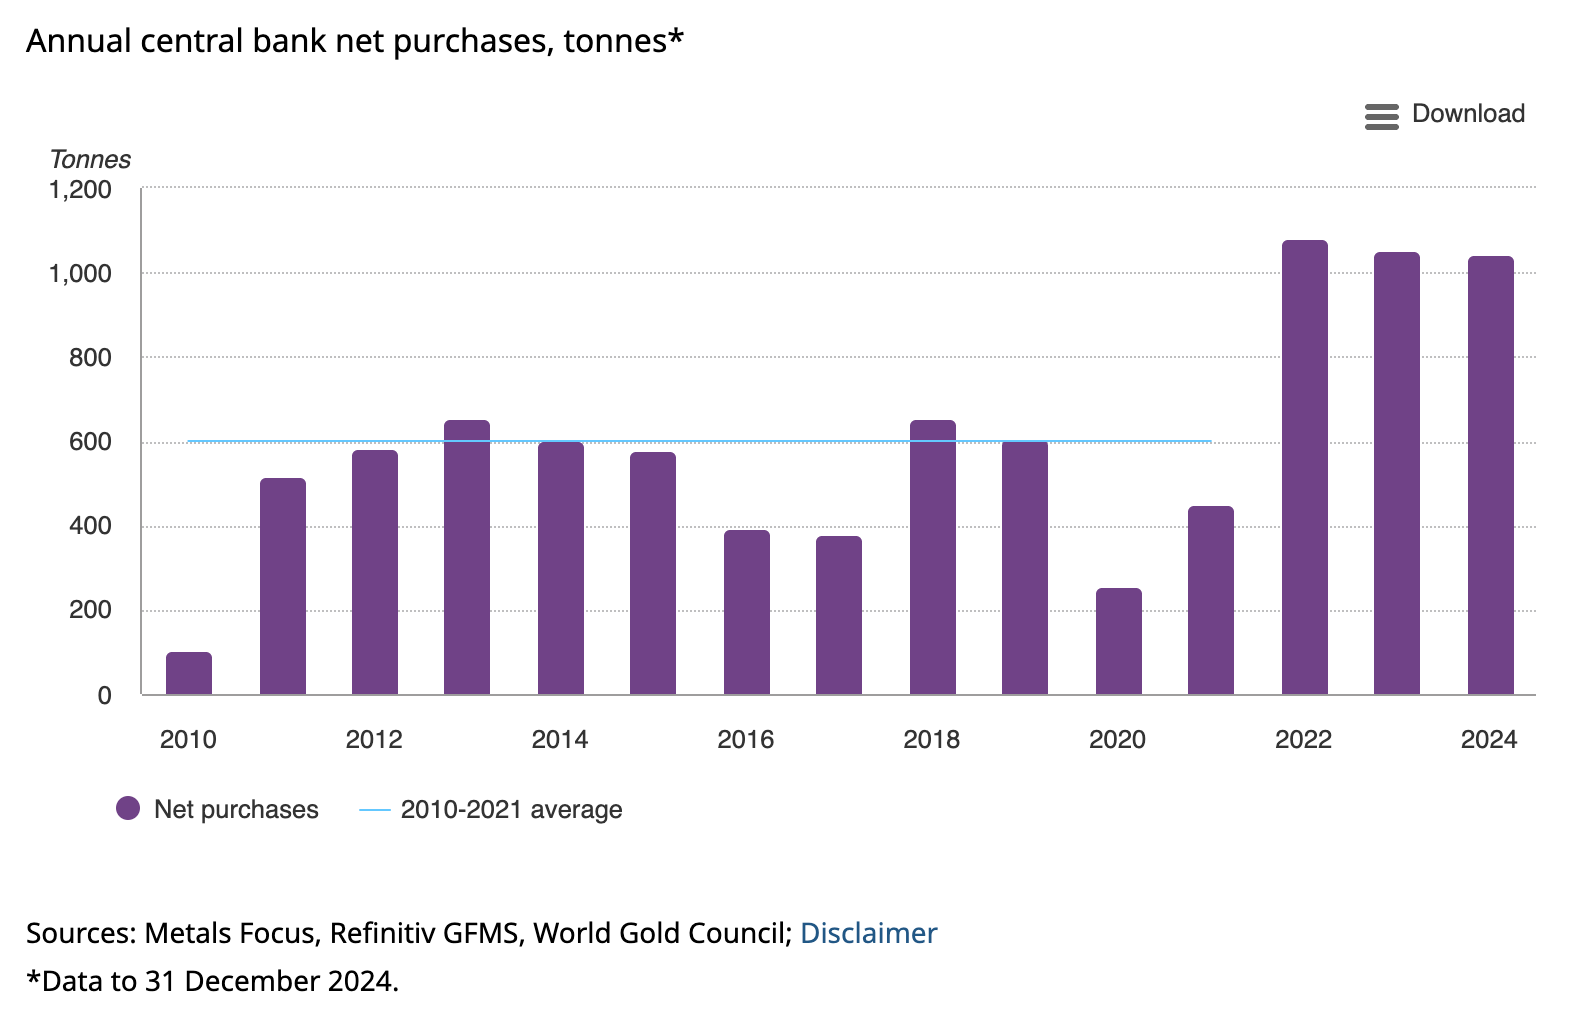
The bullish narrative/theme for gold remains. Global central banks are buying gold because they fear holding U.S. Treasuries that could be confiscated in the middle of a geo-political conflict (e.g. U.S.-China economic war). As the US. ratchets up trade pressure on allies and foes, expect the demand for gold to increase. Here are the annual purchases of gold by central banks:
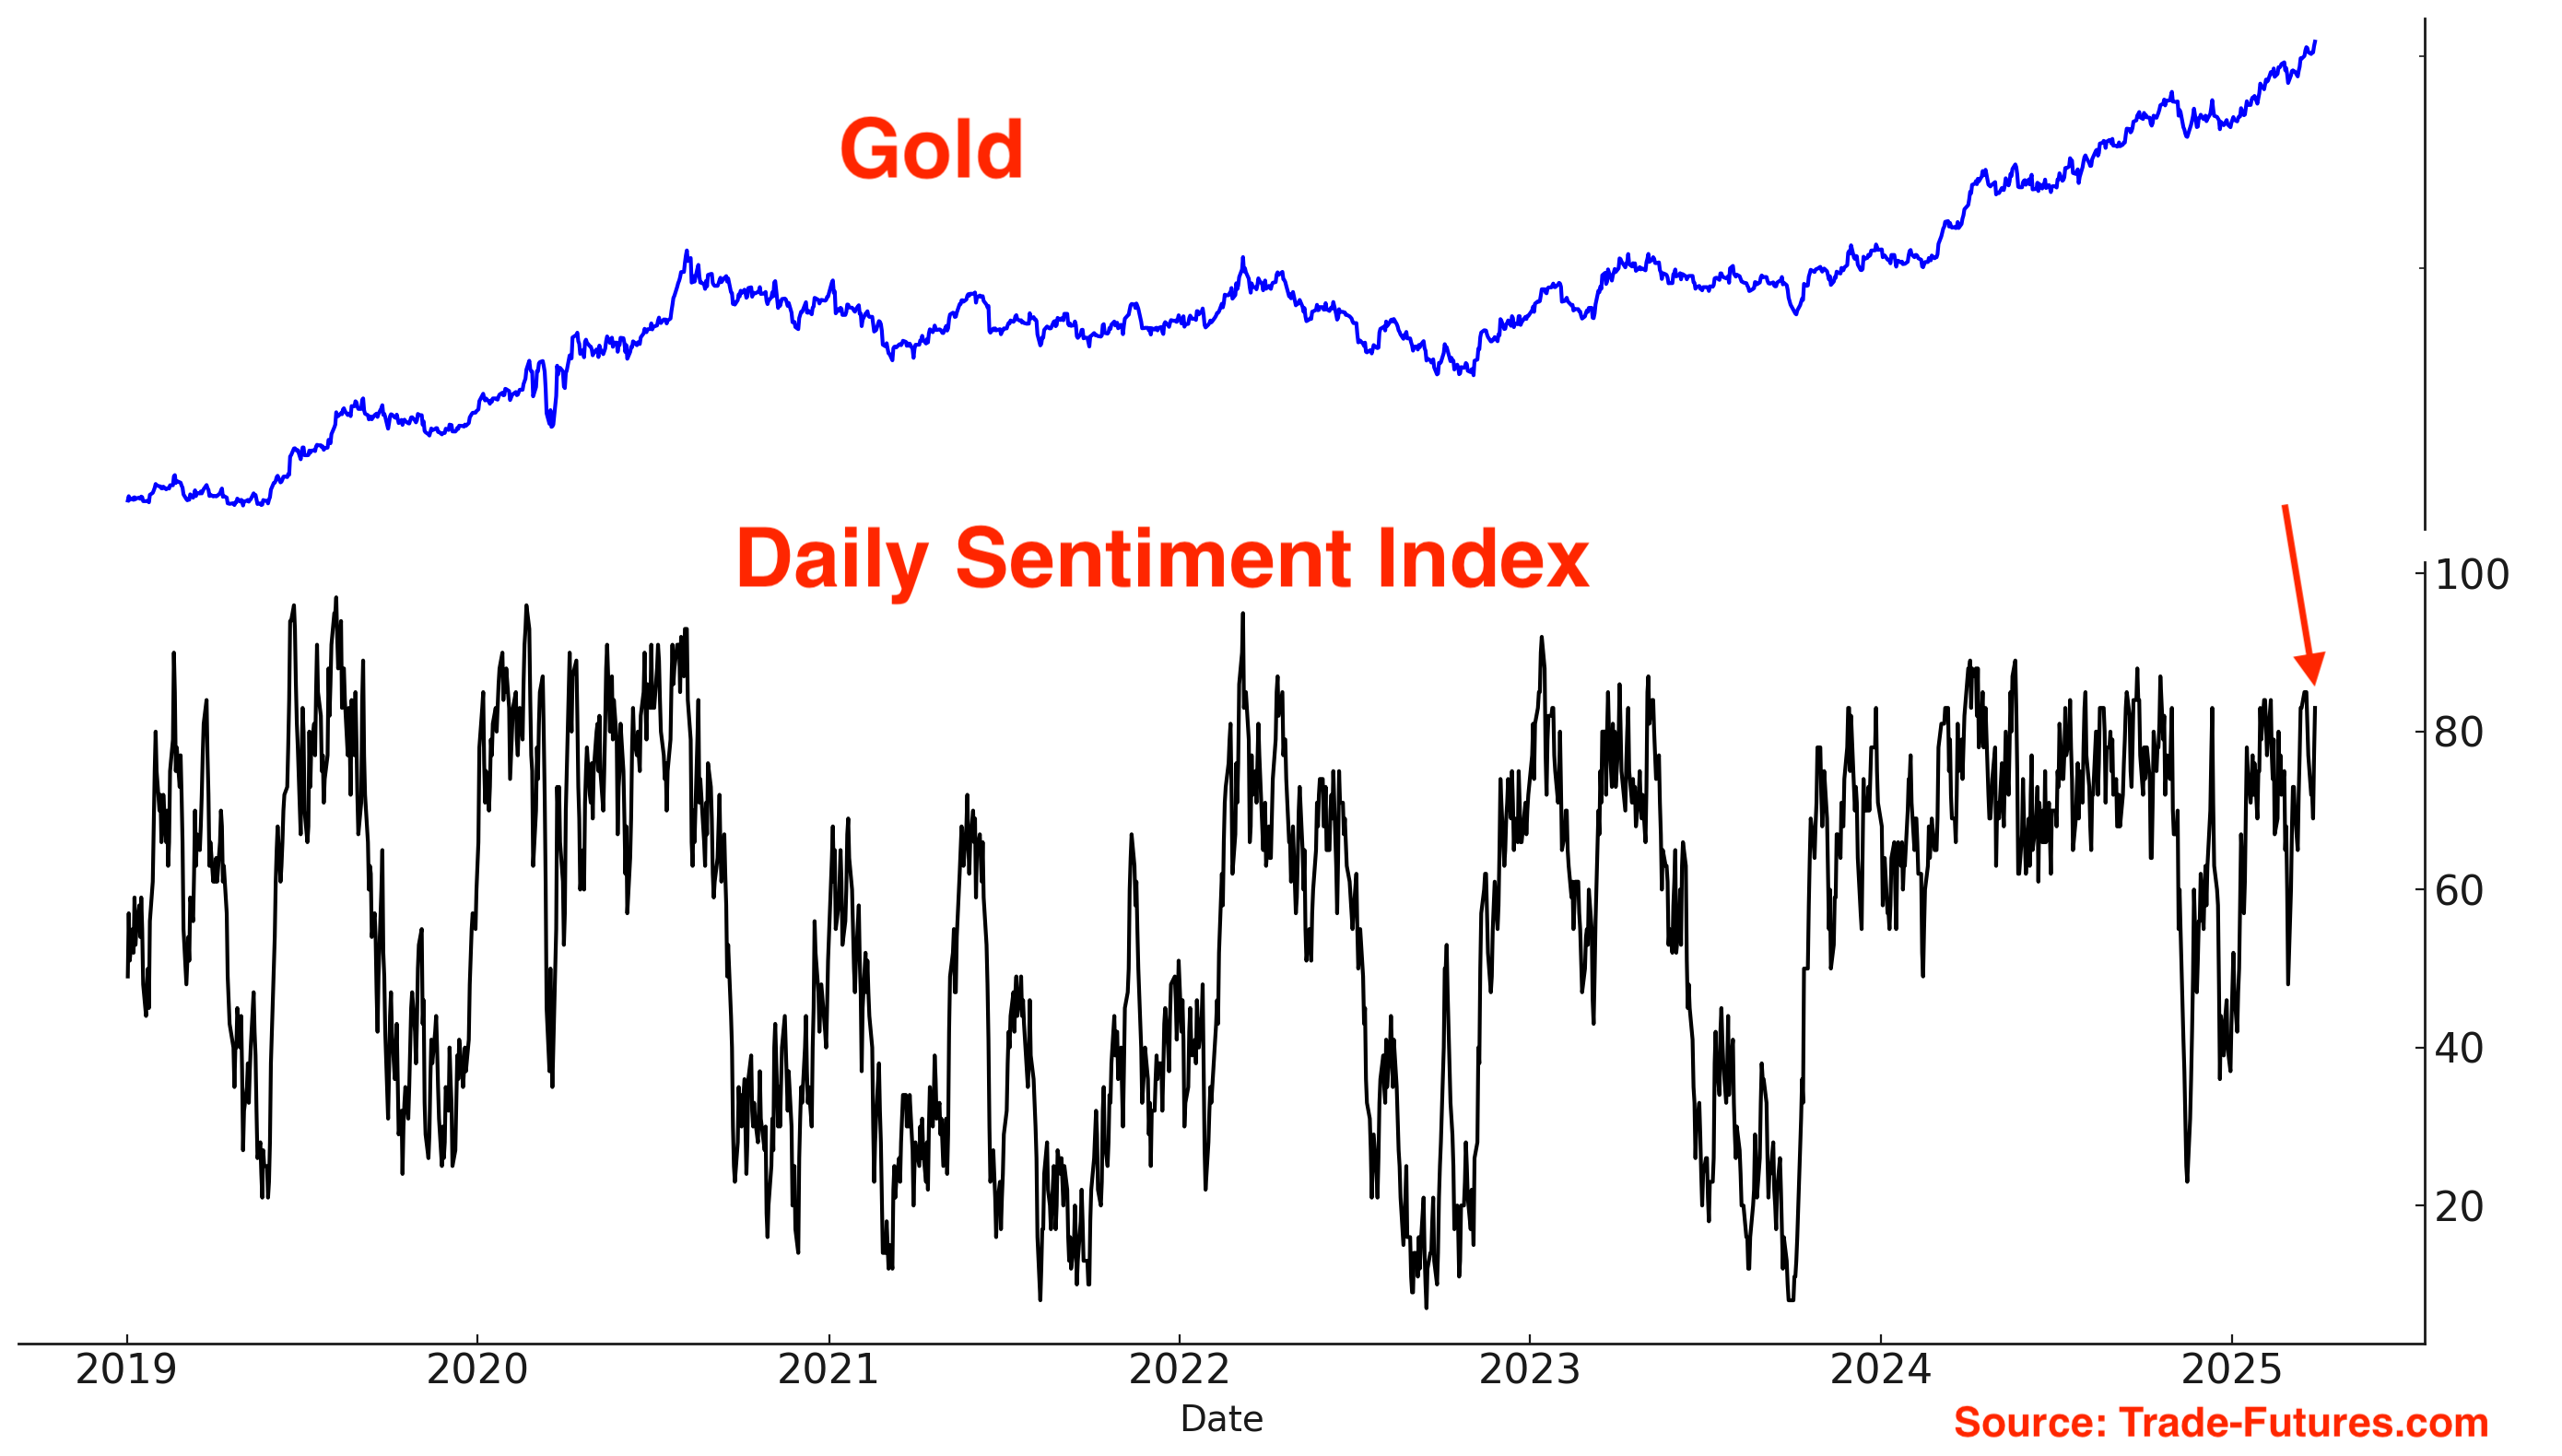
Gold continues to trend higher:
Sentiment remains elevated:
SLV short interest made a new all-time high:

One interesting scenario to think about: will silver massively outperform gold in the final leg of this precious metals rally? Silver is a much smaller market than gold, and all it takes is one good squeeze to push silver up to $50 (previous all-time highs).
Chinese Equities
The Chinese stock market continues to trend higher. By popular mean-reversion metrics, the current rally in Chinese equities is overbought, raising the potential for a correction. Despite the probability of a correction, I remain long with a trailing stop loss.
Chinese equities fell this week along with U.S. equities. But China continues to make a series of higher Lows and has not taken out my stops yet.
For now, focus on the trend in Chinese equities, which remains Up:
Foreign inflows into Chinese tech have completely reversed:

Short interest remains elevated:
India
Indian equities were extremely oversold at the start of March. A mean-reversion rally is still underway:

India’s rally merely reached the first 38.2% fibonacci retracement. That’s the bare minimum for a mean-reversion bounce. I’m looking for at least a 50% retracement:

India’s trend is turning Up:
Indian outflows have reversed. Now starting to see inflows:

I remain long Indian equities.
Bonds
I currently hold no strong conviction toward bonds.
Overall, I expect bonds to swing within a range in 2025. I do not expect a strong trending environment.
There’s a possibility that a sustained economic slowdown could trigger a substantial rally in bonds. Long bonds offers an asymmetric risk/reward trade:
If the economy does not continue to slow down, bonds could fall, but not significantly.
If the economy does slow down, bonds will rally significantly.
I have a small long position. This is not a large position or a high-conviction trade.
Here’s the 30 year’s Daily Sentiment Index: in neutral territory.

Short Term Sentiment is also neutral:
TLT short interest: backed off from all-time highs
From the latest Commitment of Traders Report (COT):

Currencies
The U.S. Dollar is trending downwards:
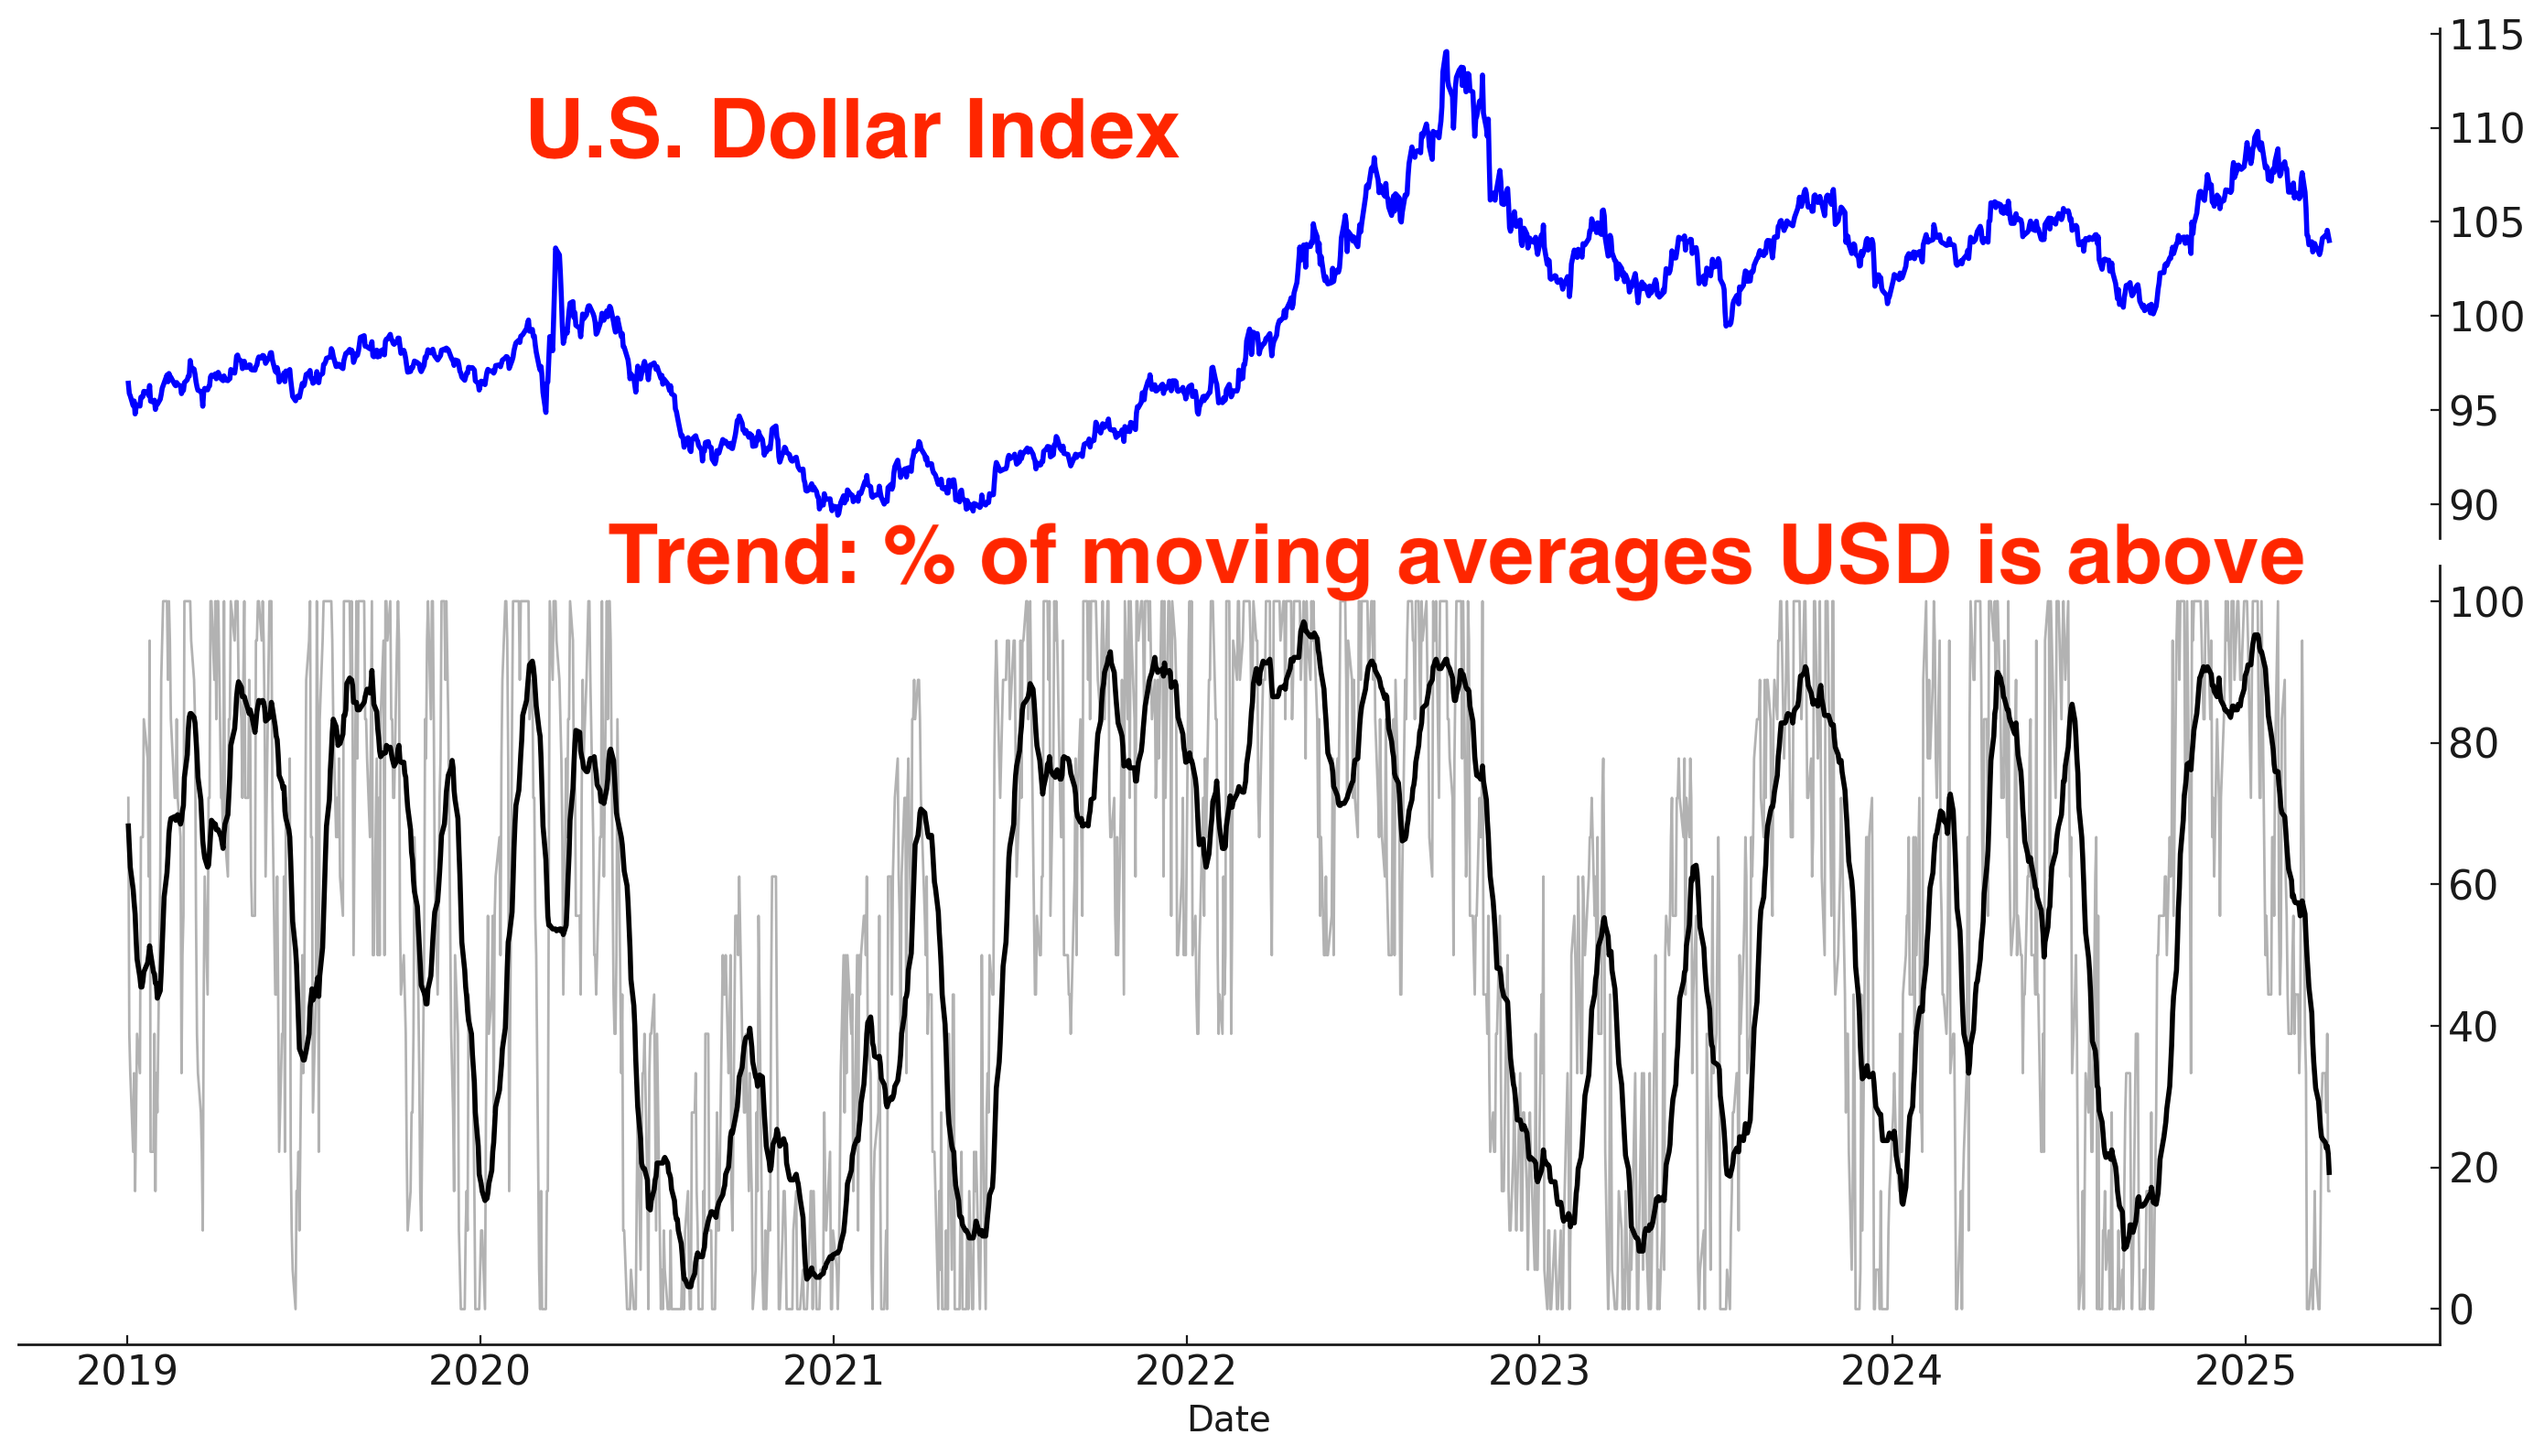
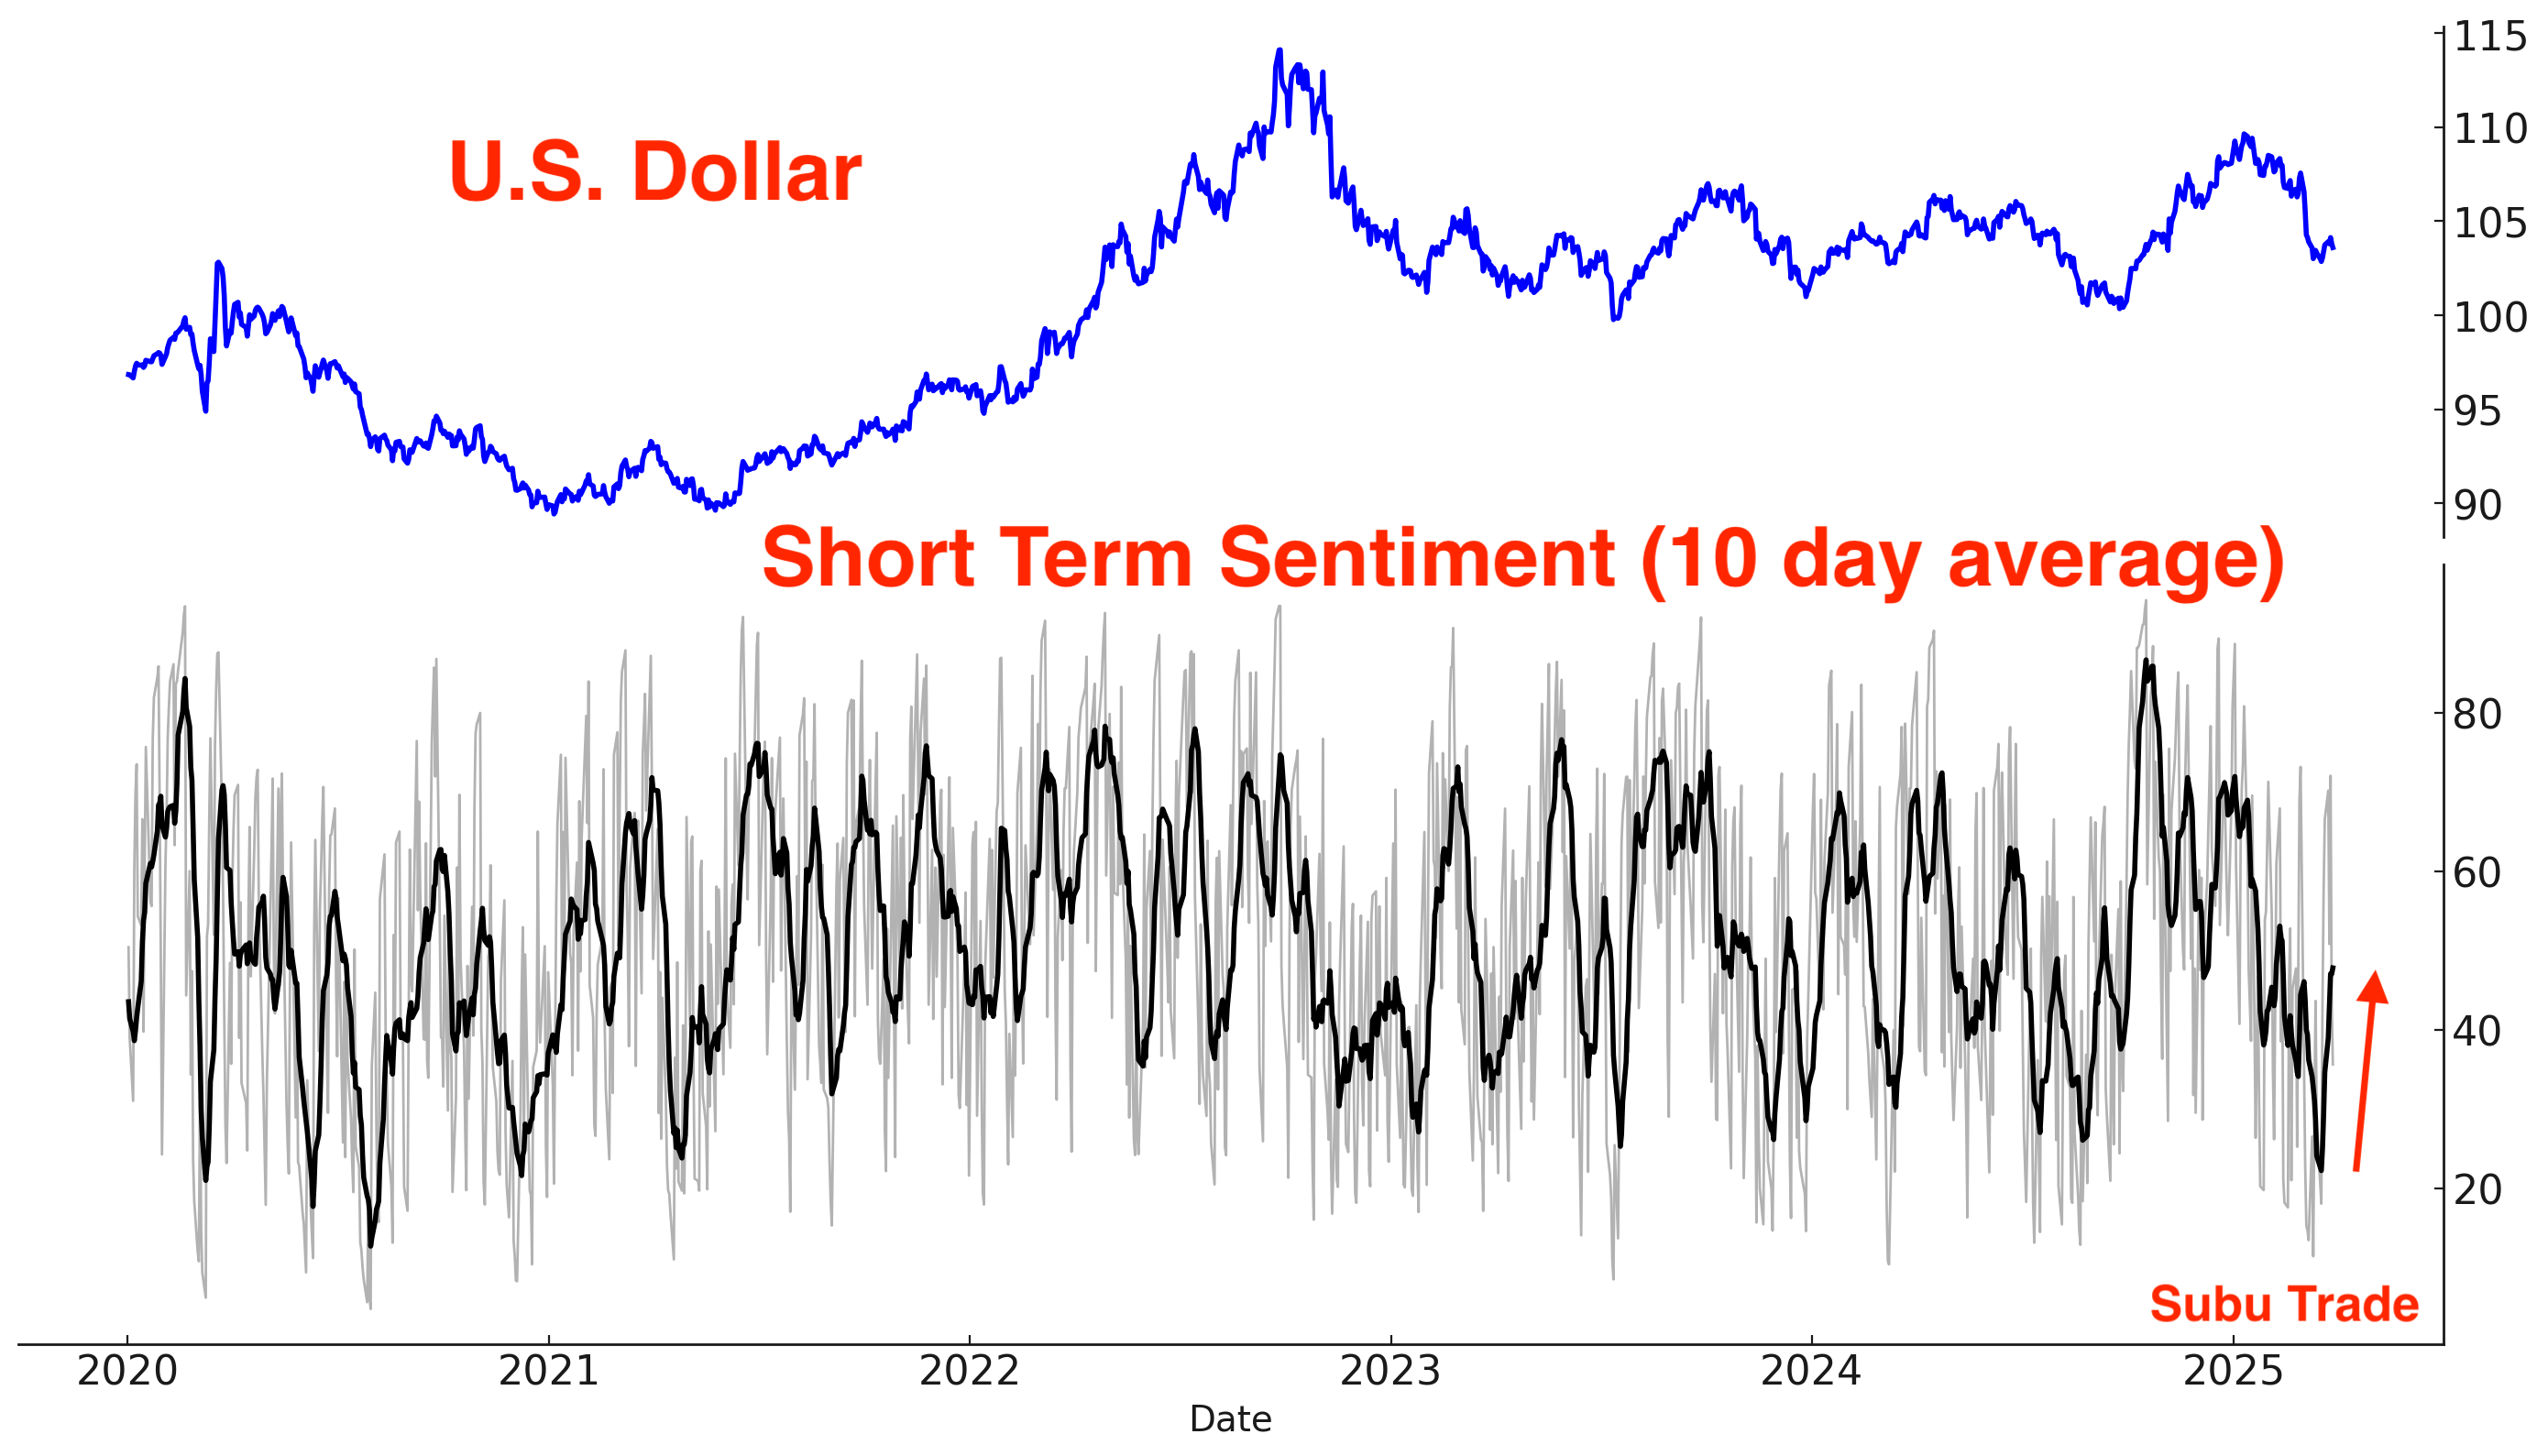
The U.S. Dollar’s sentiment: stuck in neutral territory.

Short Term Sentiment is bouncing back from extreme pessimism: now in neutral territory.
I do not have a currencies position.
My Portfolio
Mean-Reversion Position (Non-Core) – Long Oversold Tech Stocks:
Currently at 40% of the potential max size. Targeting at least a mean-reversion bounce. Will increase position size if stocks fall more. Next week is important.Core Position – Long Gold and Silver: long with a trailing stop. Risk of a correction is increasing.
Black Swan Position – Long Chinese Equities: long with a trailing stop.
Mean-Reversion Position (Non-Core) - Long Indian Equities: Was extremely oversold, mean-reversion rally is now underway.
Mean-Reversion Position (Non-Core) – Long U.S. Treasury Bonds: Small position size.
My friend Frank Cappelleri started a FREE Substack blog. I highly recommend that you check it out. Frank is a trader whose work I deeply respect.
This content is for informational purposes only and is not financial or investment advice. I am not a licensed financial advisor. Trading involves risk, and past performance does not guarantee future results. You are responsible for your own financial decisions, and I am not liable for any losses.
Thank you for sharing this. I like your zoomed out view. I use price action and this note helps me get a end-to-end view.
Great information, thank u!