
Stock market crash? Or just a pullback?
Put on your seatbelts.

The S&P 500 closed flat this week, but there was a lot of turbulence under the surface. Investors sold off once-high flying stocks (Ai, tech, high beta, low quality, growth) and rotated capital into sectors that were previously lagging (energy, healthcare etc).
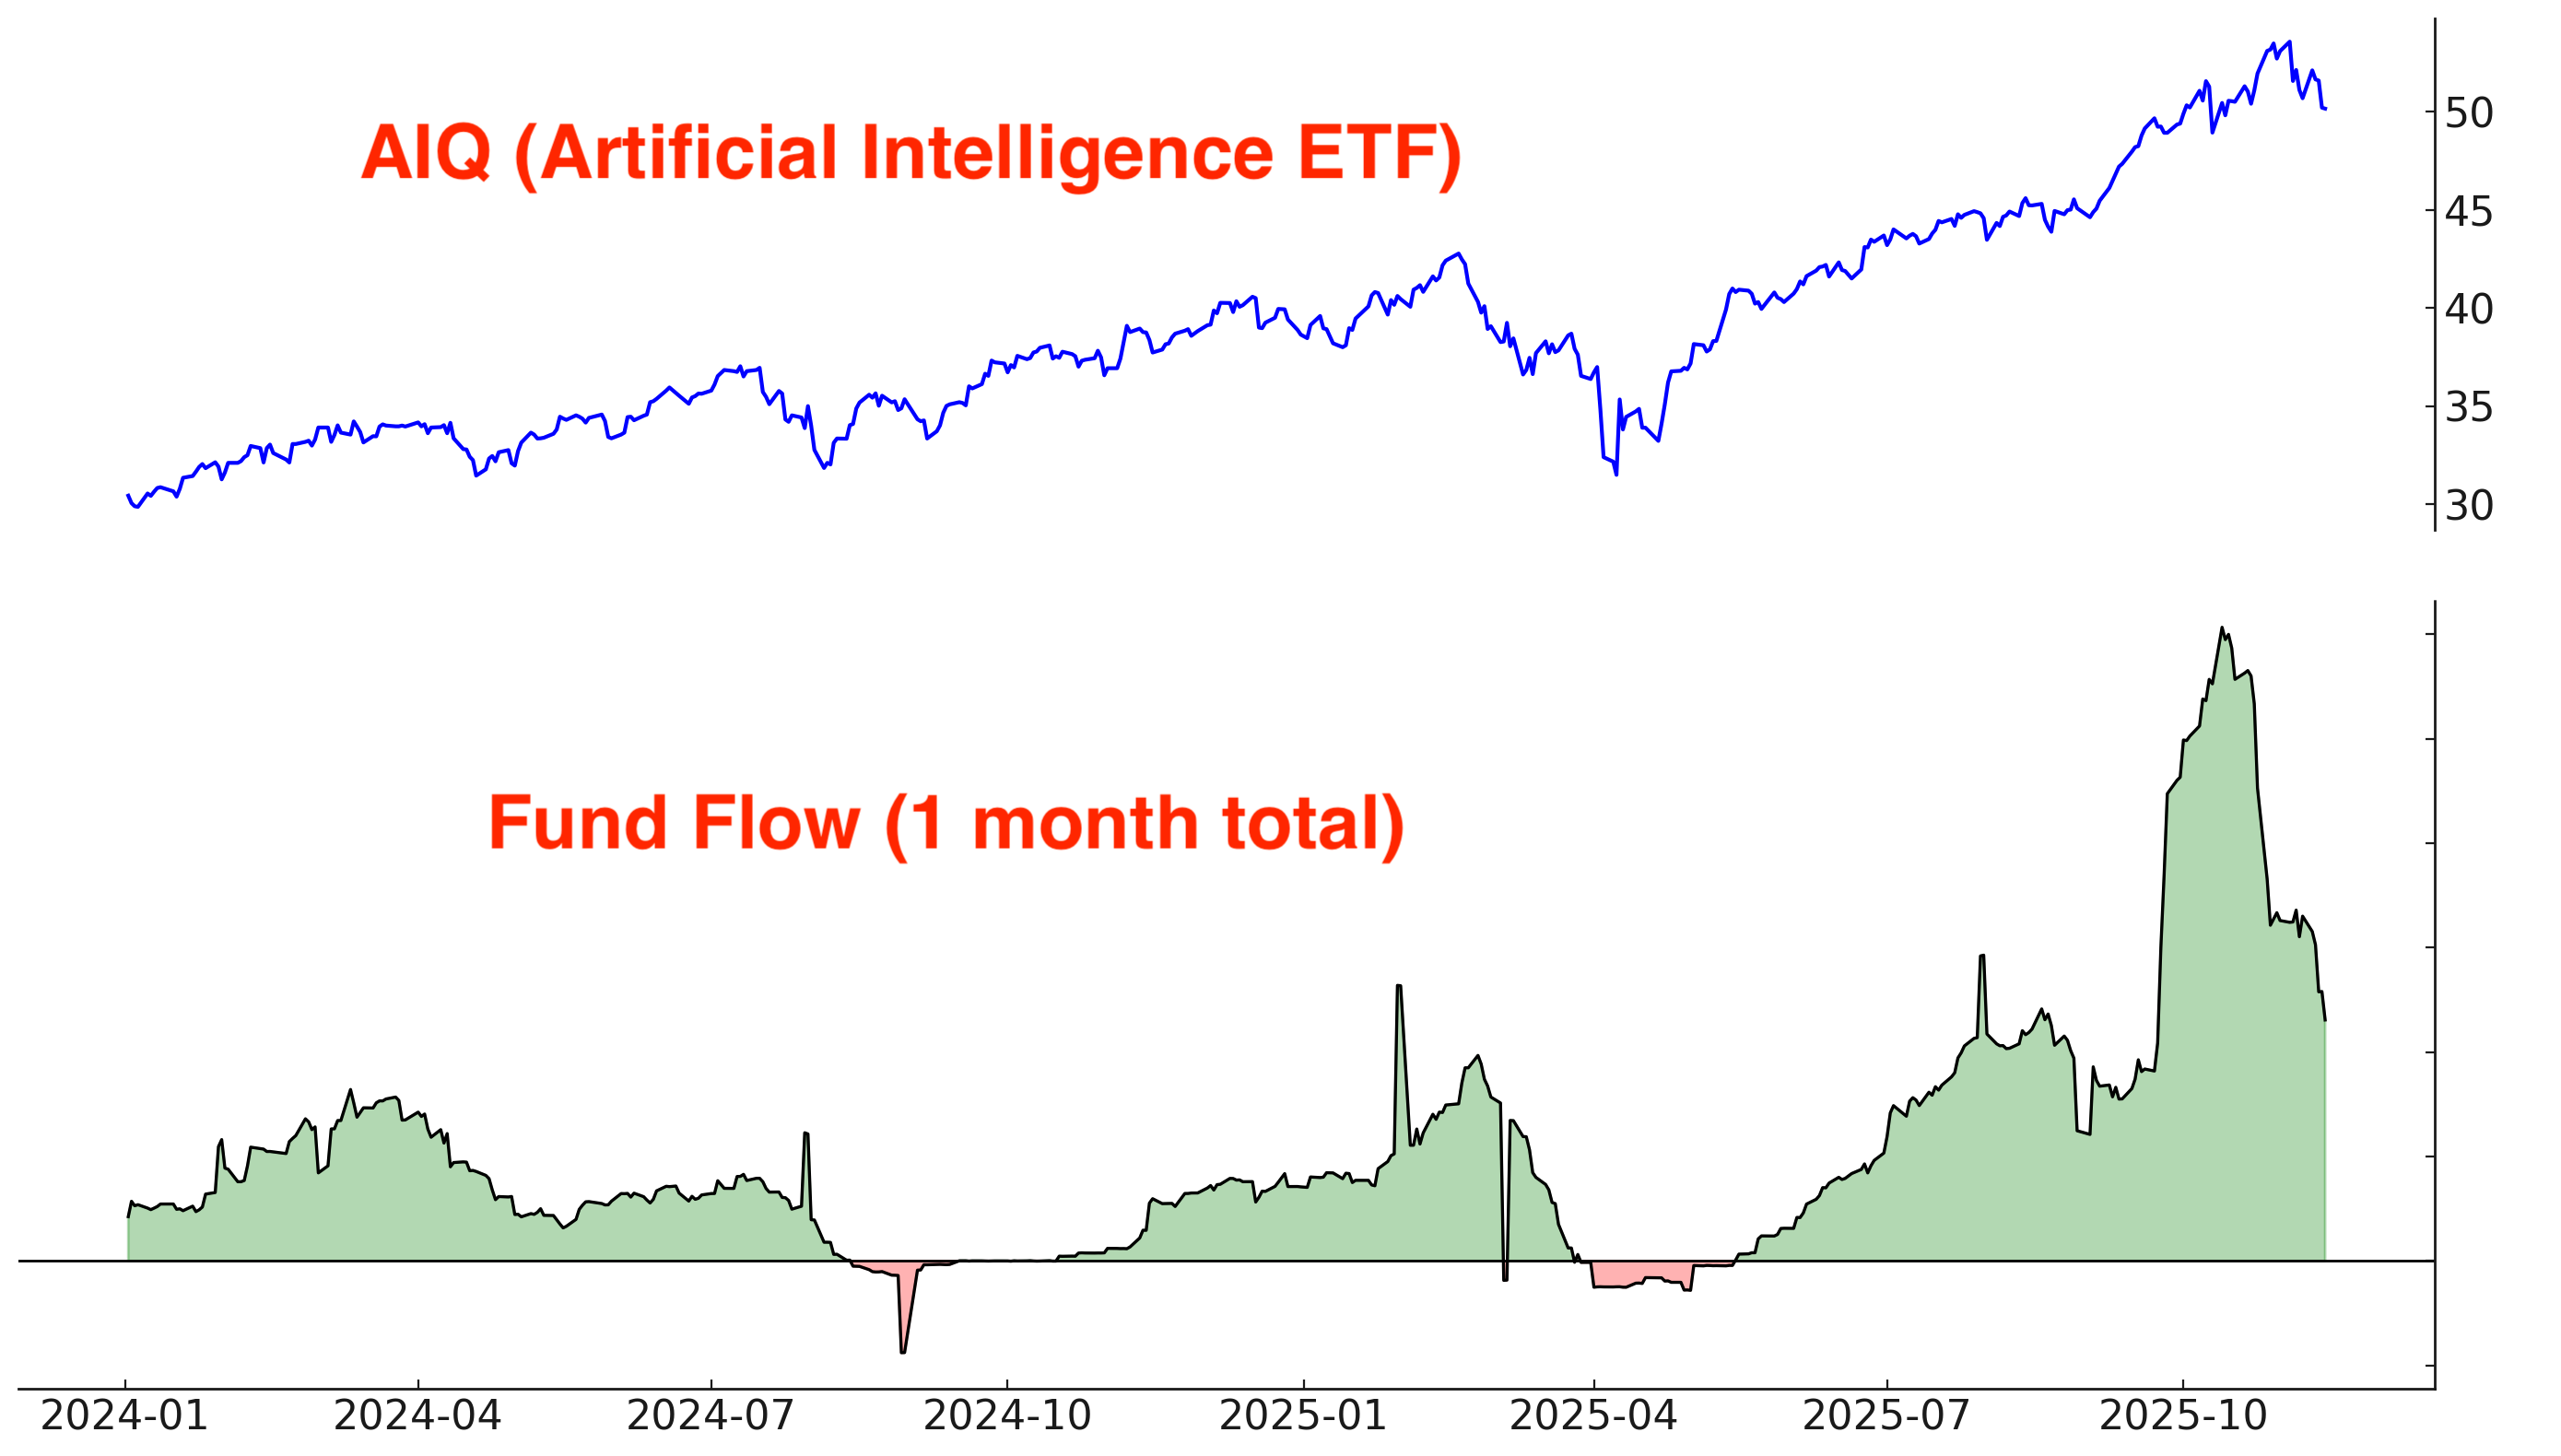
Out of AI….
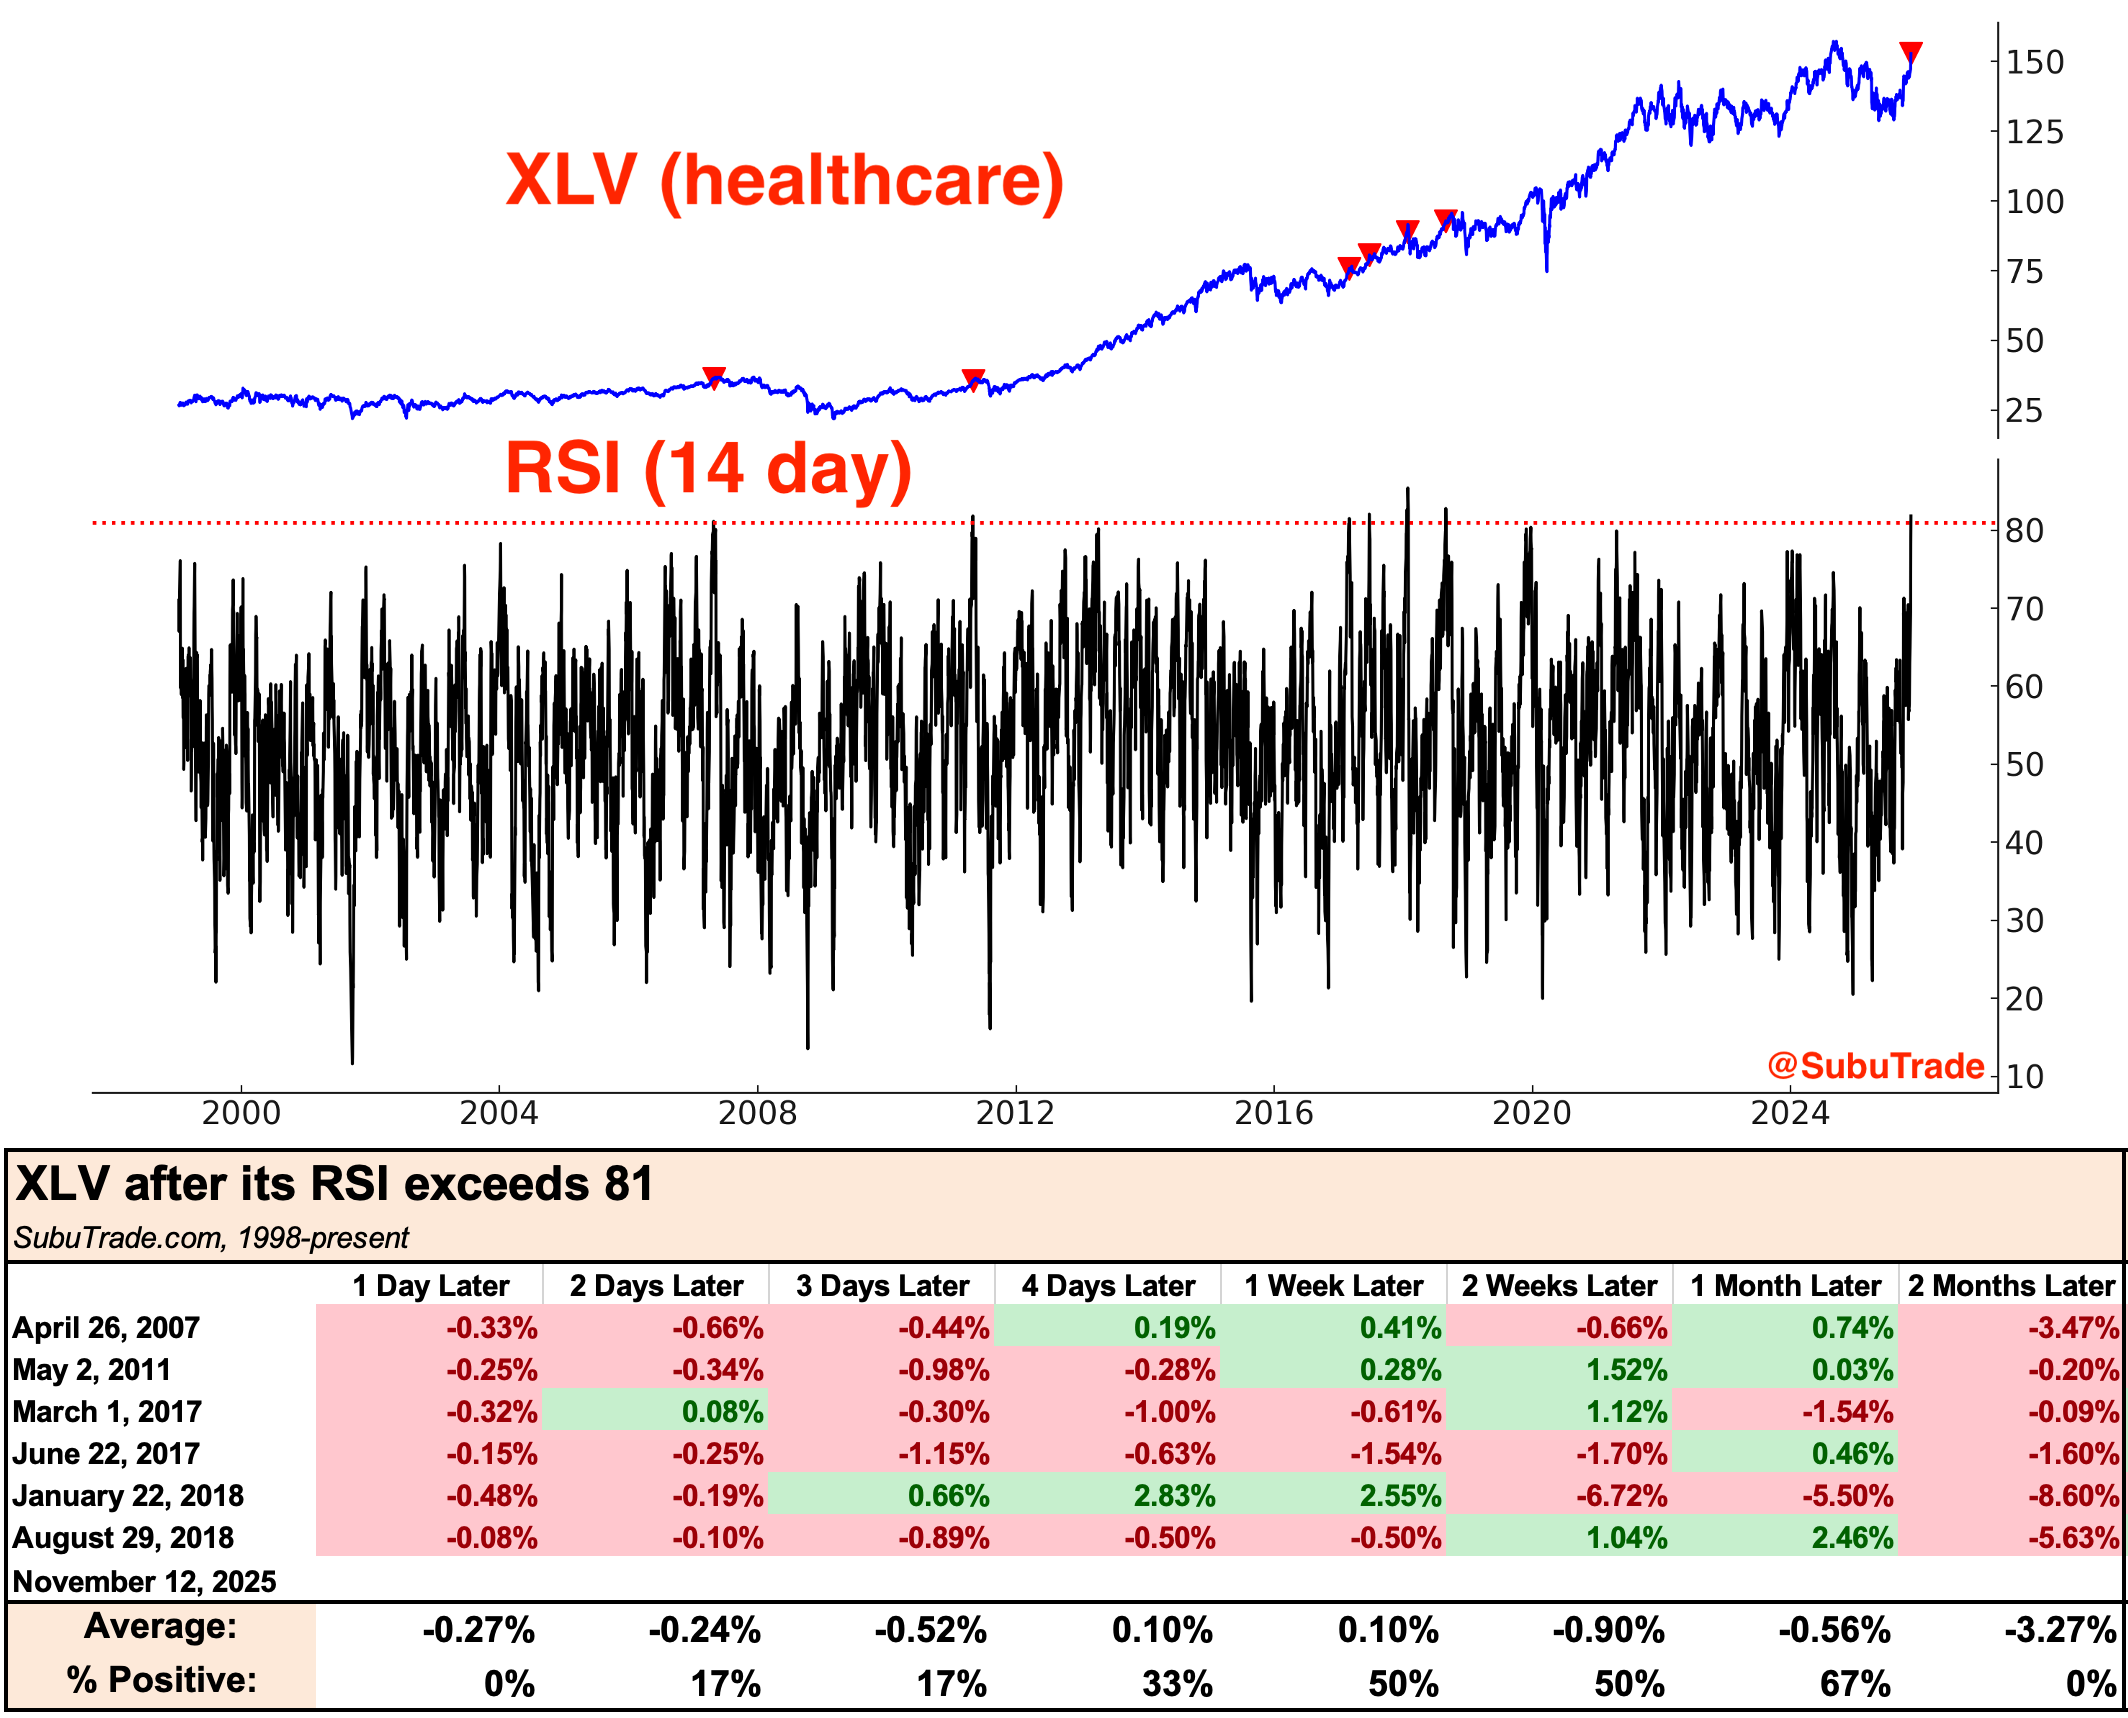
into Health Care….
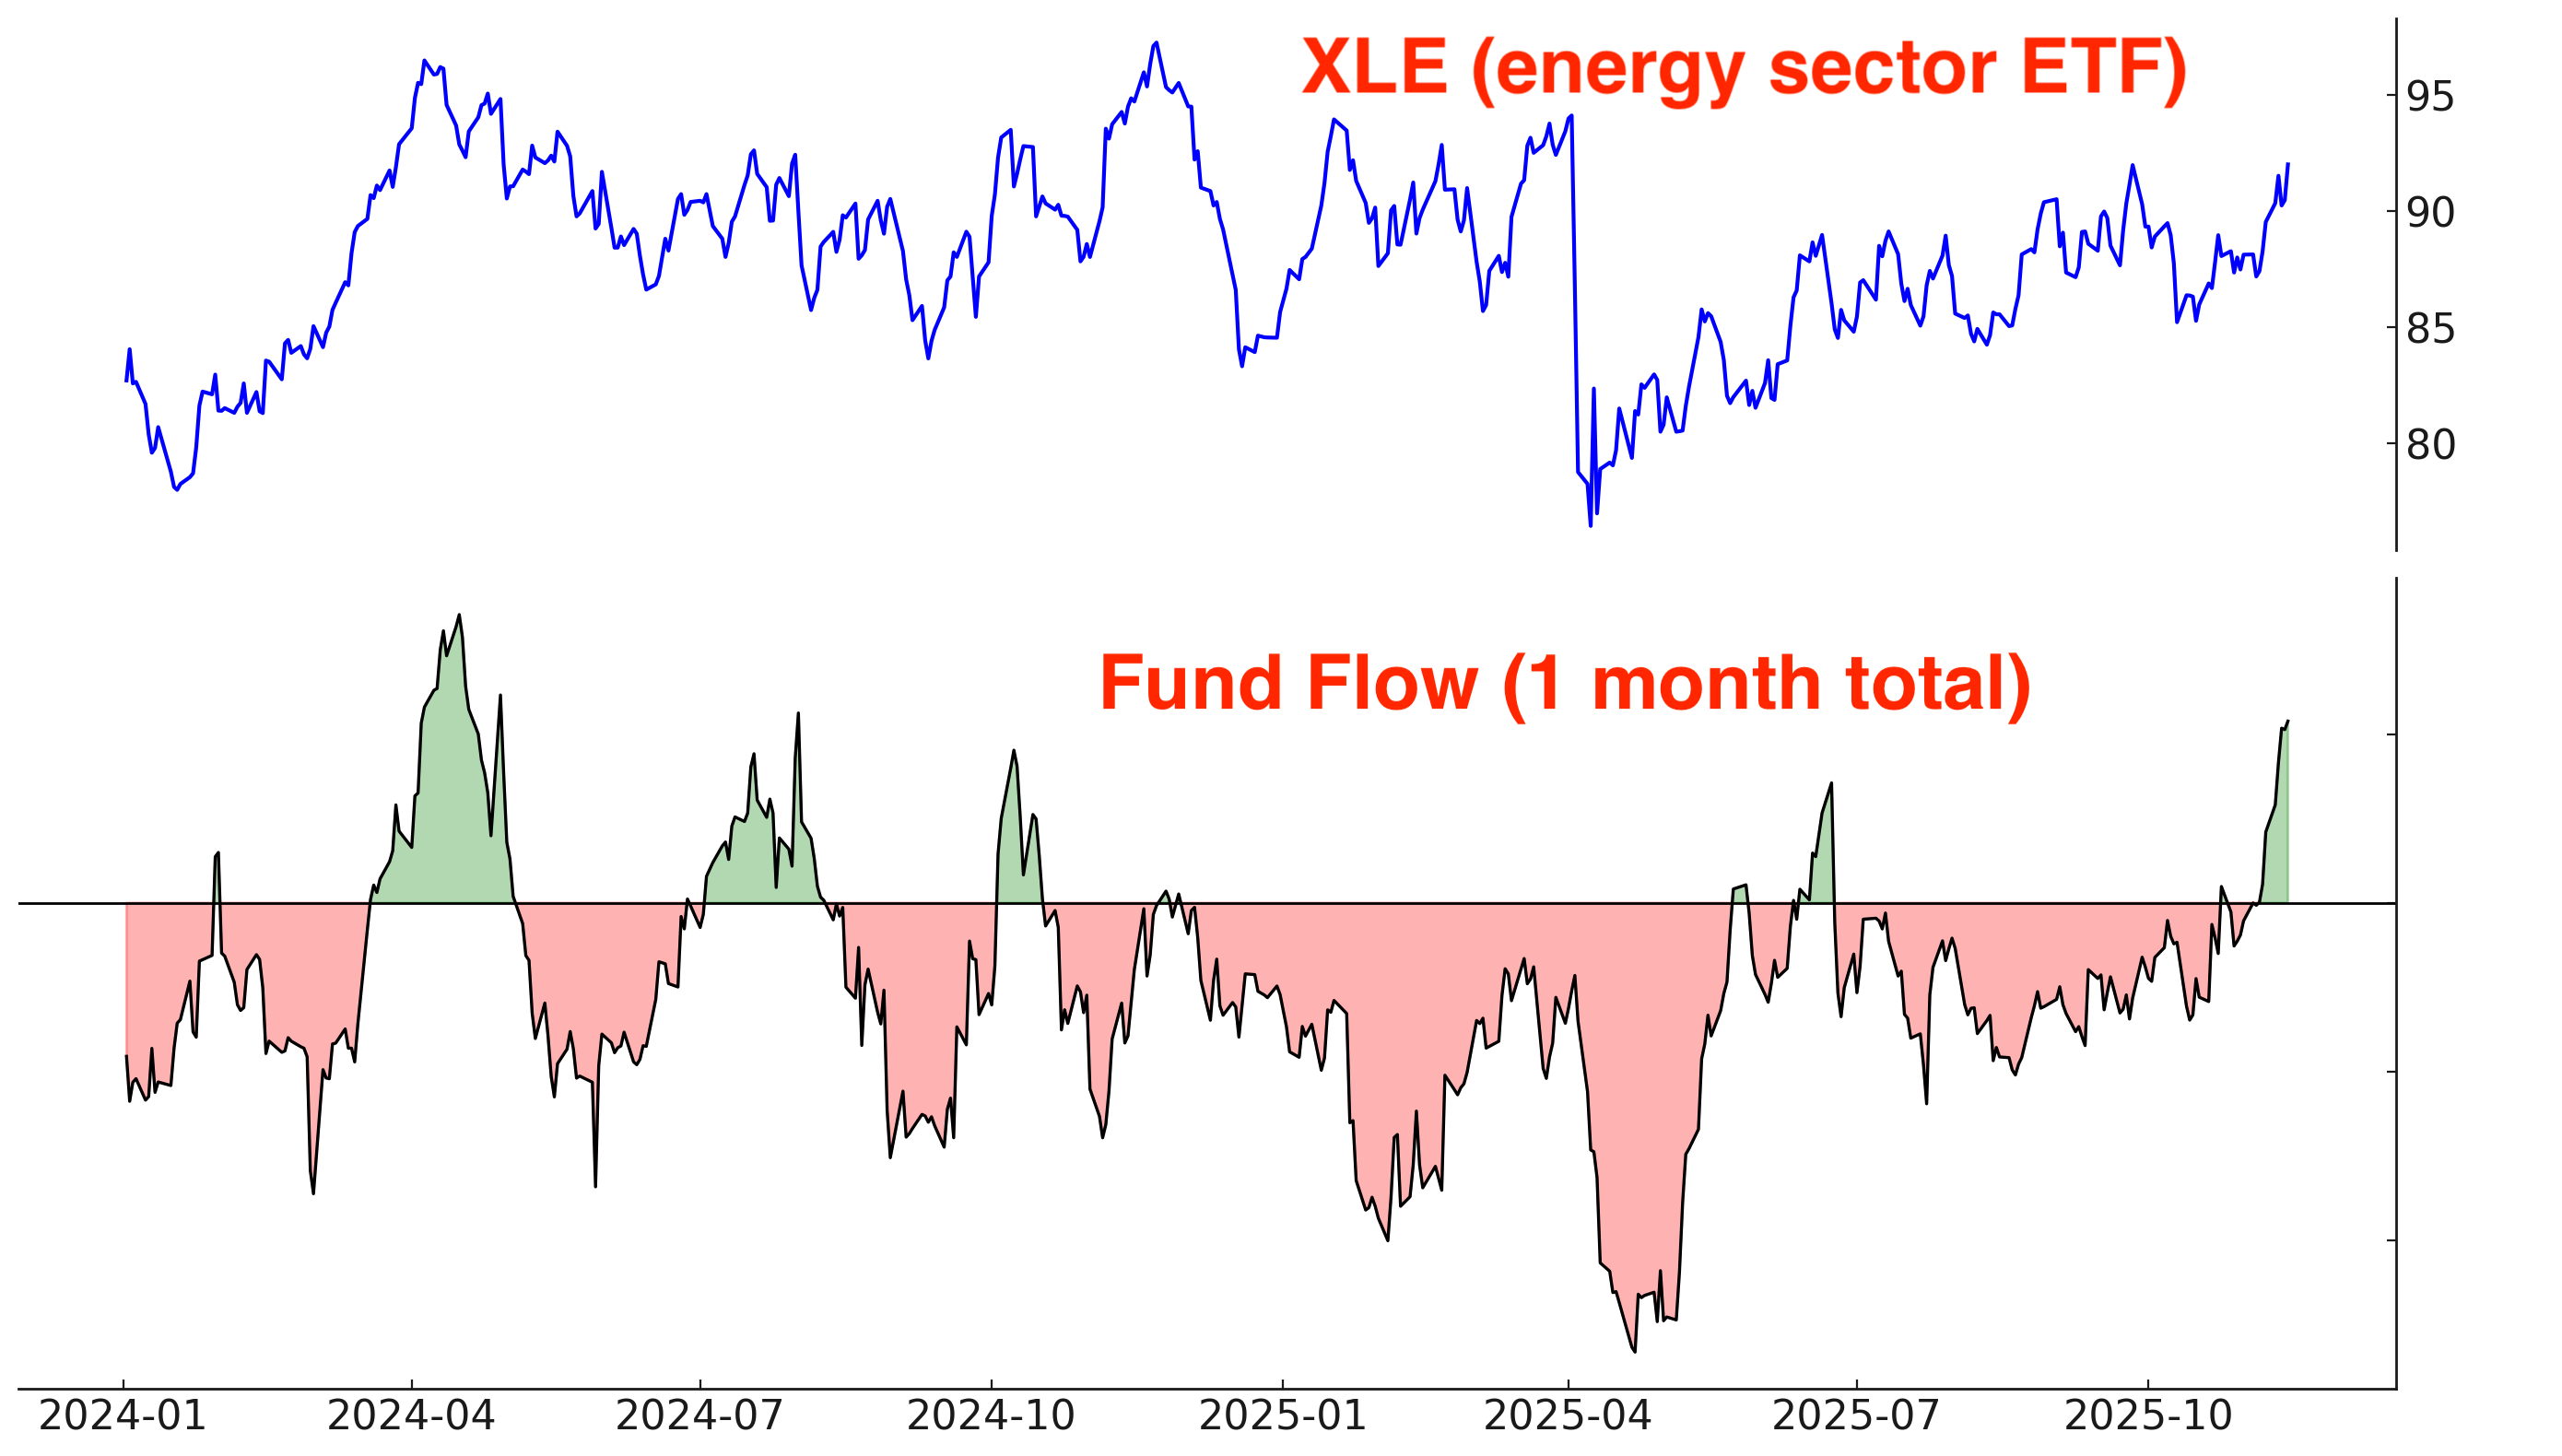
…. and into Energy.
This was to be expected after a massive 7 month rally that was driven by tech/AI. I wrote last week:
Indicators today can be broadly split into 2 types: Momentum vs. Mean Reversion. These 2 types of indicators are telling different stories right now about 2 different time frames.
Momentum indicators: The stock market’s momentum is strong. This tends to be bullish on a longer time frame (e.g. 6+ months forward).
Mean Reversion indicators: The market’s momentum is so strong, that the current rally may be exhausted. This tends to be a more short term bearish concern (e.g. next 1-3 months)
Markets are moving in-line with expectations.