
Momentum vs. Mean Reversion: 1 market, 2 stories
What is happening in markets right now, and where to next?

The most important thing a trader can do is separate Signal from Noise.
Indicators can be broadly split into 2 types: Momentum vs. Mean Reversion. These 2 types of indicators are telling different stories right now about 2 different time frames.
Momentum indicators: The stock market’s momentum is strong. This tends to be bullish on a longer time frame (e.g. 6+ months forward).
Mean Reversion indicators: The market’s momentum is so strong, that the current rally may be exhausted. This tends to be a more short term bearish concern (e.g. next 1-3 months)
Markets that rally on strong momentum don’t usually “end” (turn into bear markets) without at least a bearish divergence (i.e. price goes higher, but momentum weakens due to more pullbacks & corrections).
So where are we today? For starters, it’s been an incredible 7 months. When markets latch onto a narrative (e.g. Artificial Intelligence), rallies can far exceed the Majority’s expectations. For those who believe that this is a bubble, it’s important to always remember the phrase “markets can remain irrational longer than you can remain solvent”.
As traders it is not our job to debate whether this is a “bubble” or not. Leave that to the historians. Our job is to simply trade the price in front of us.
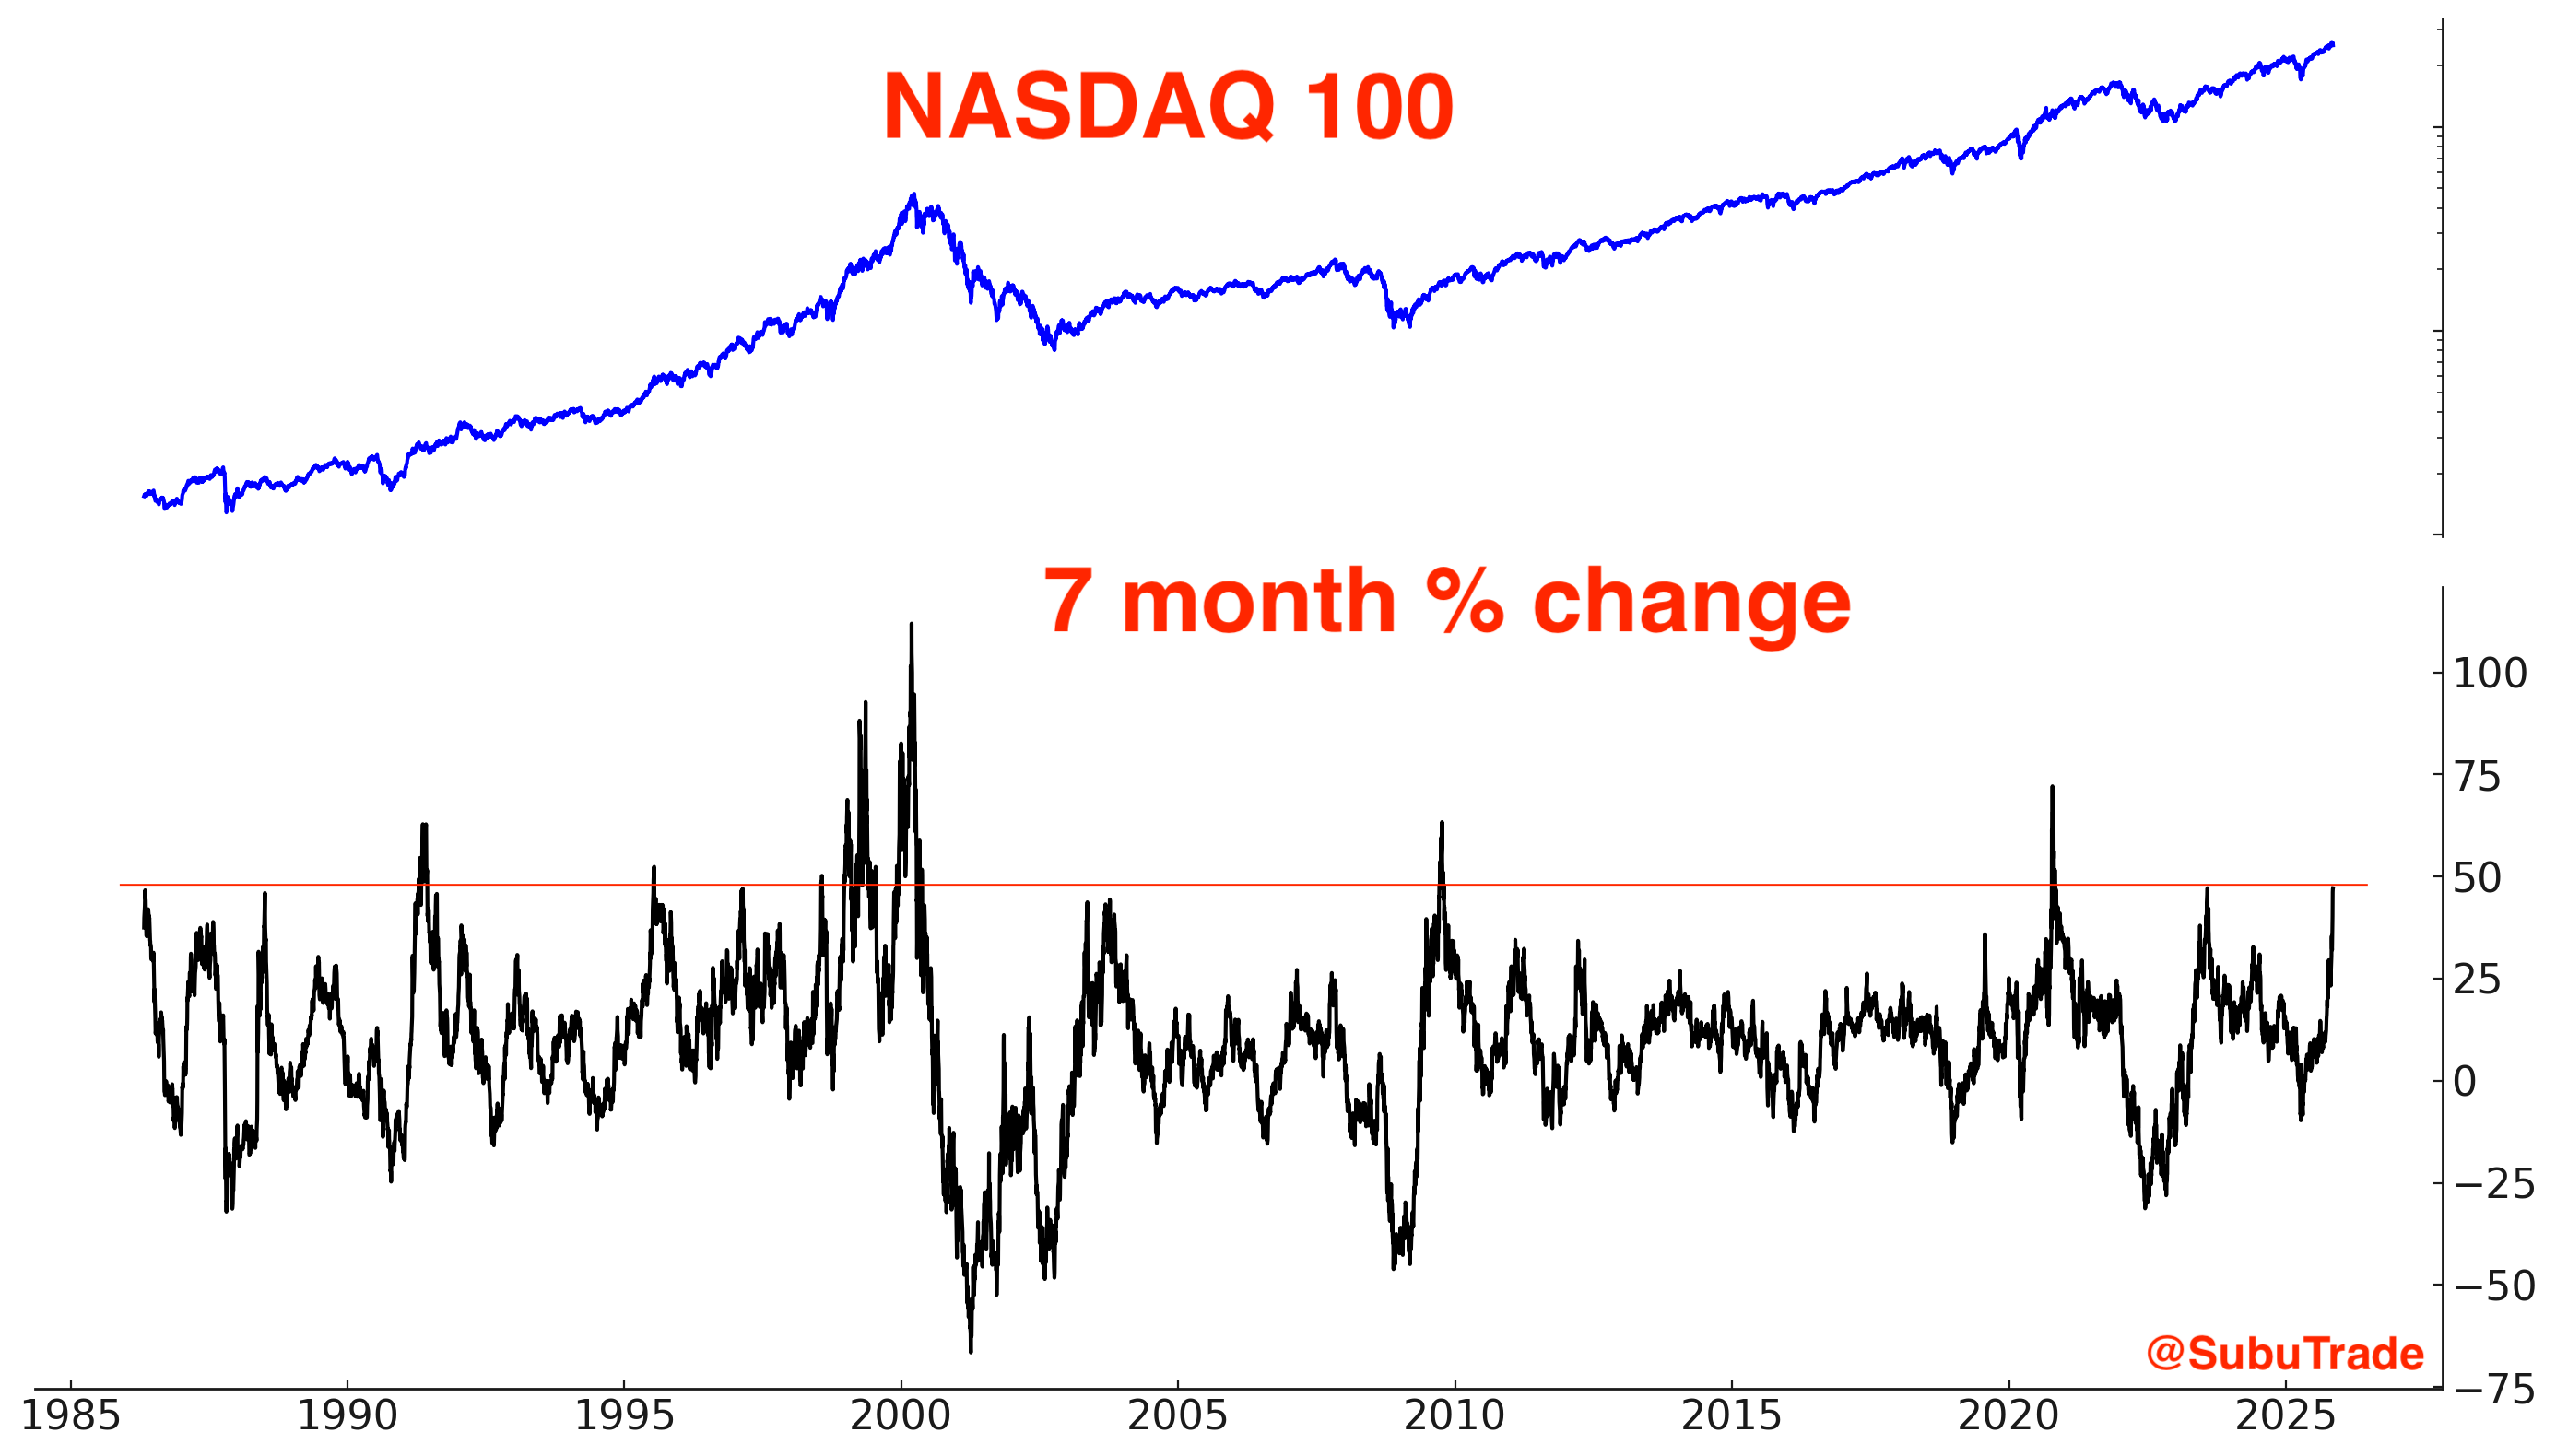
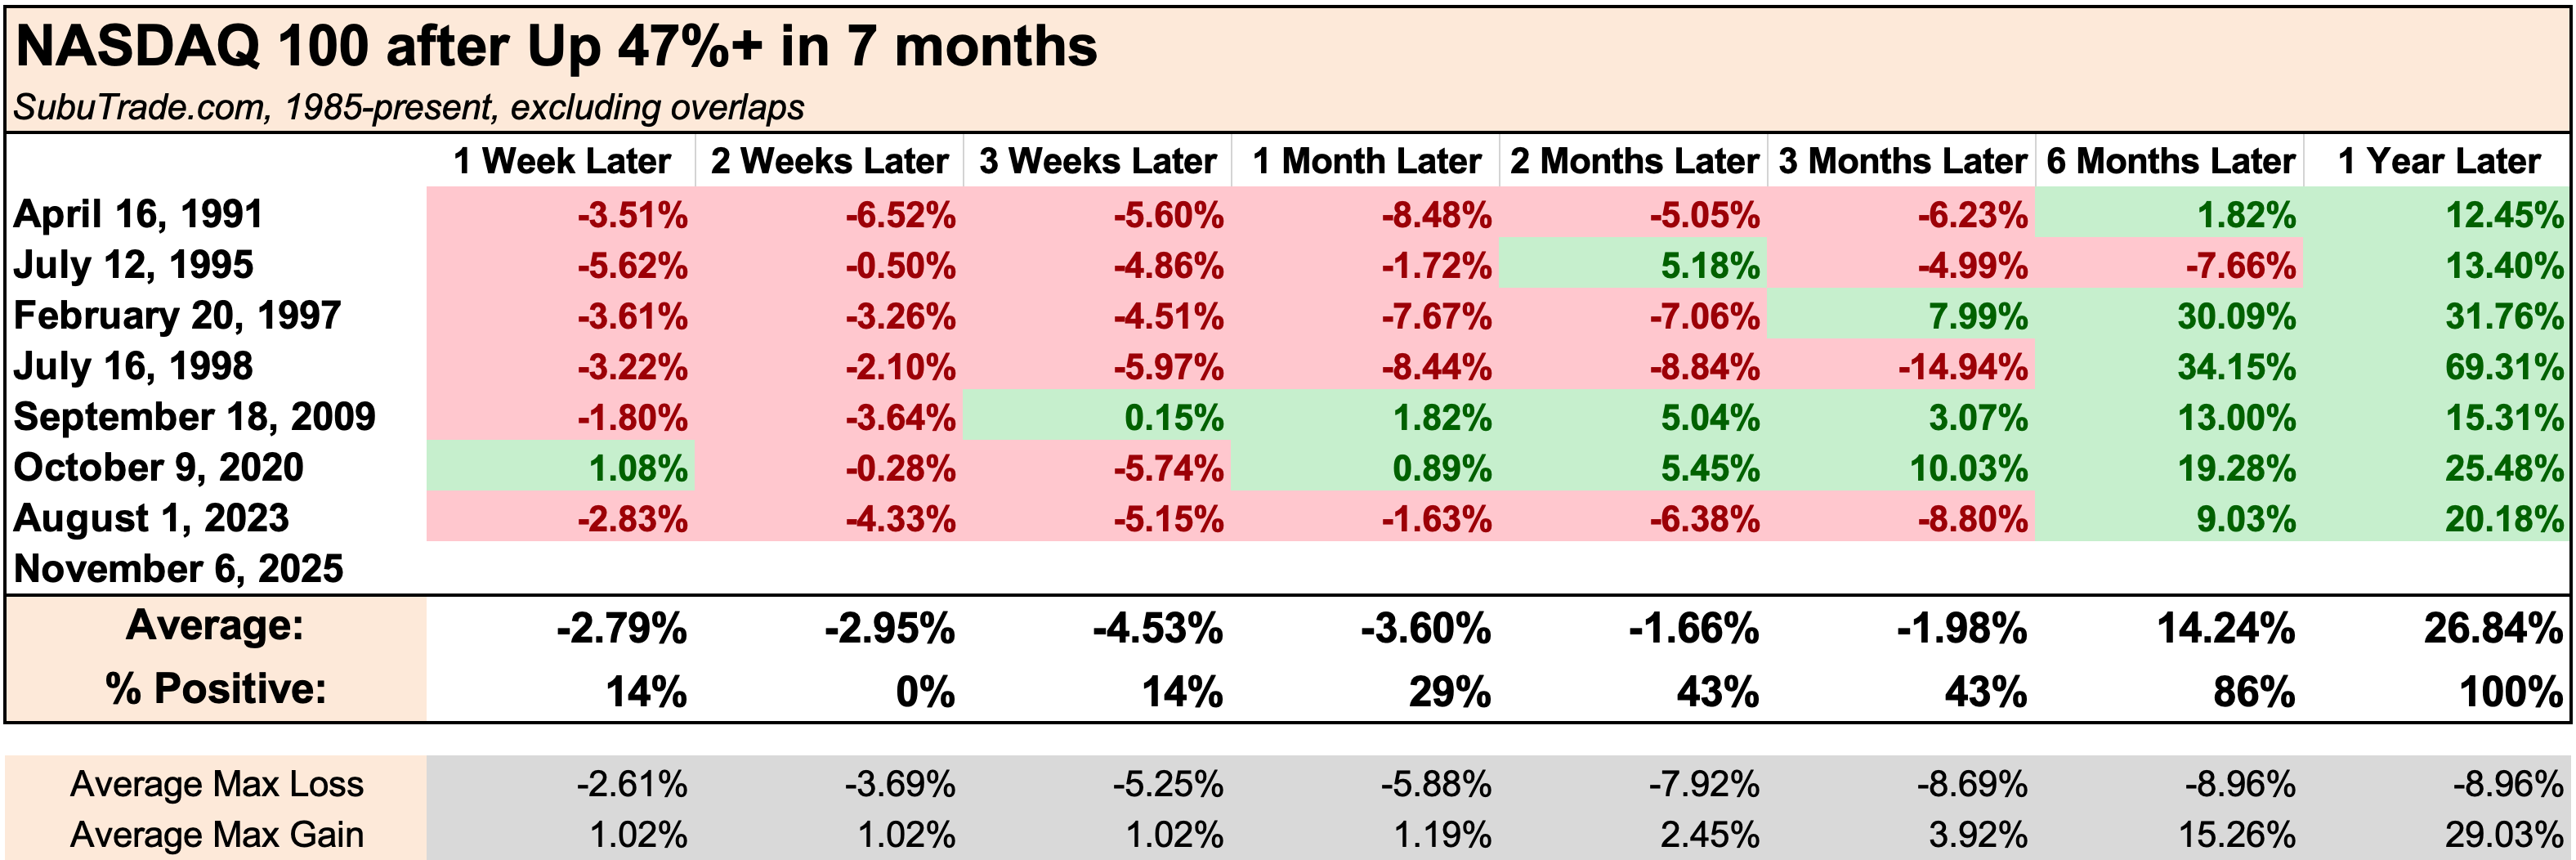
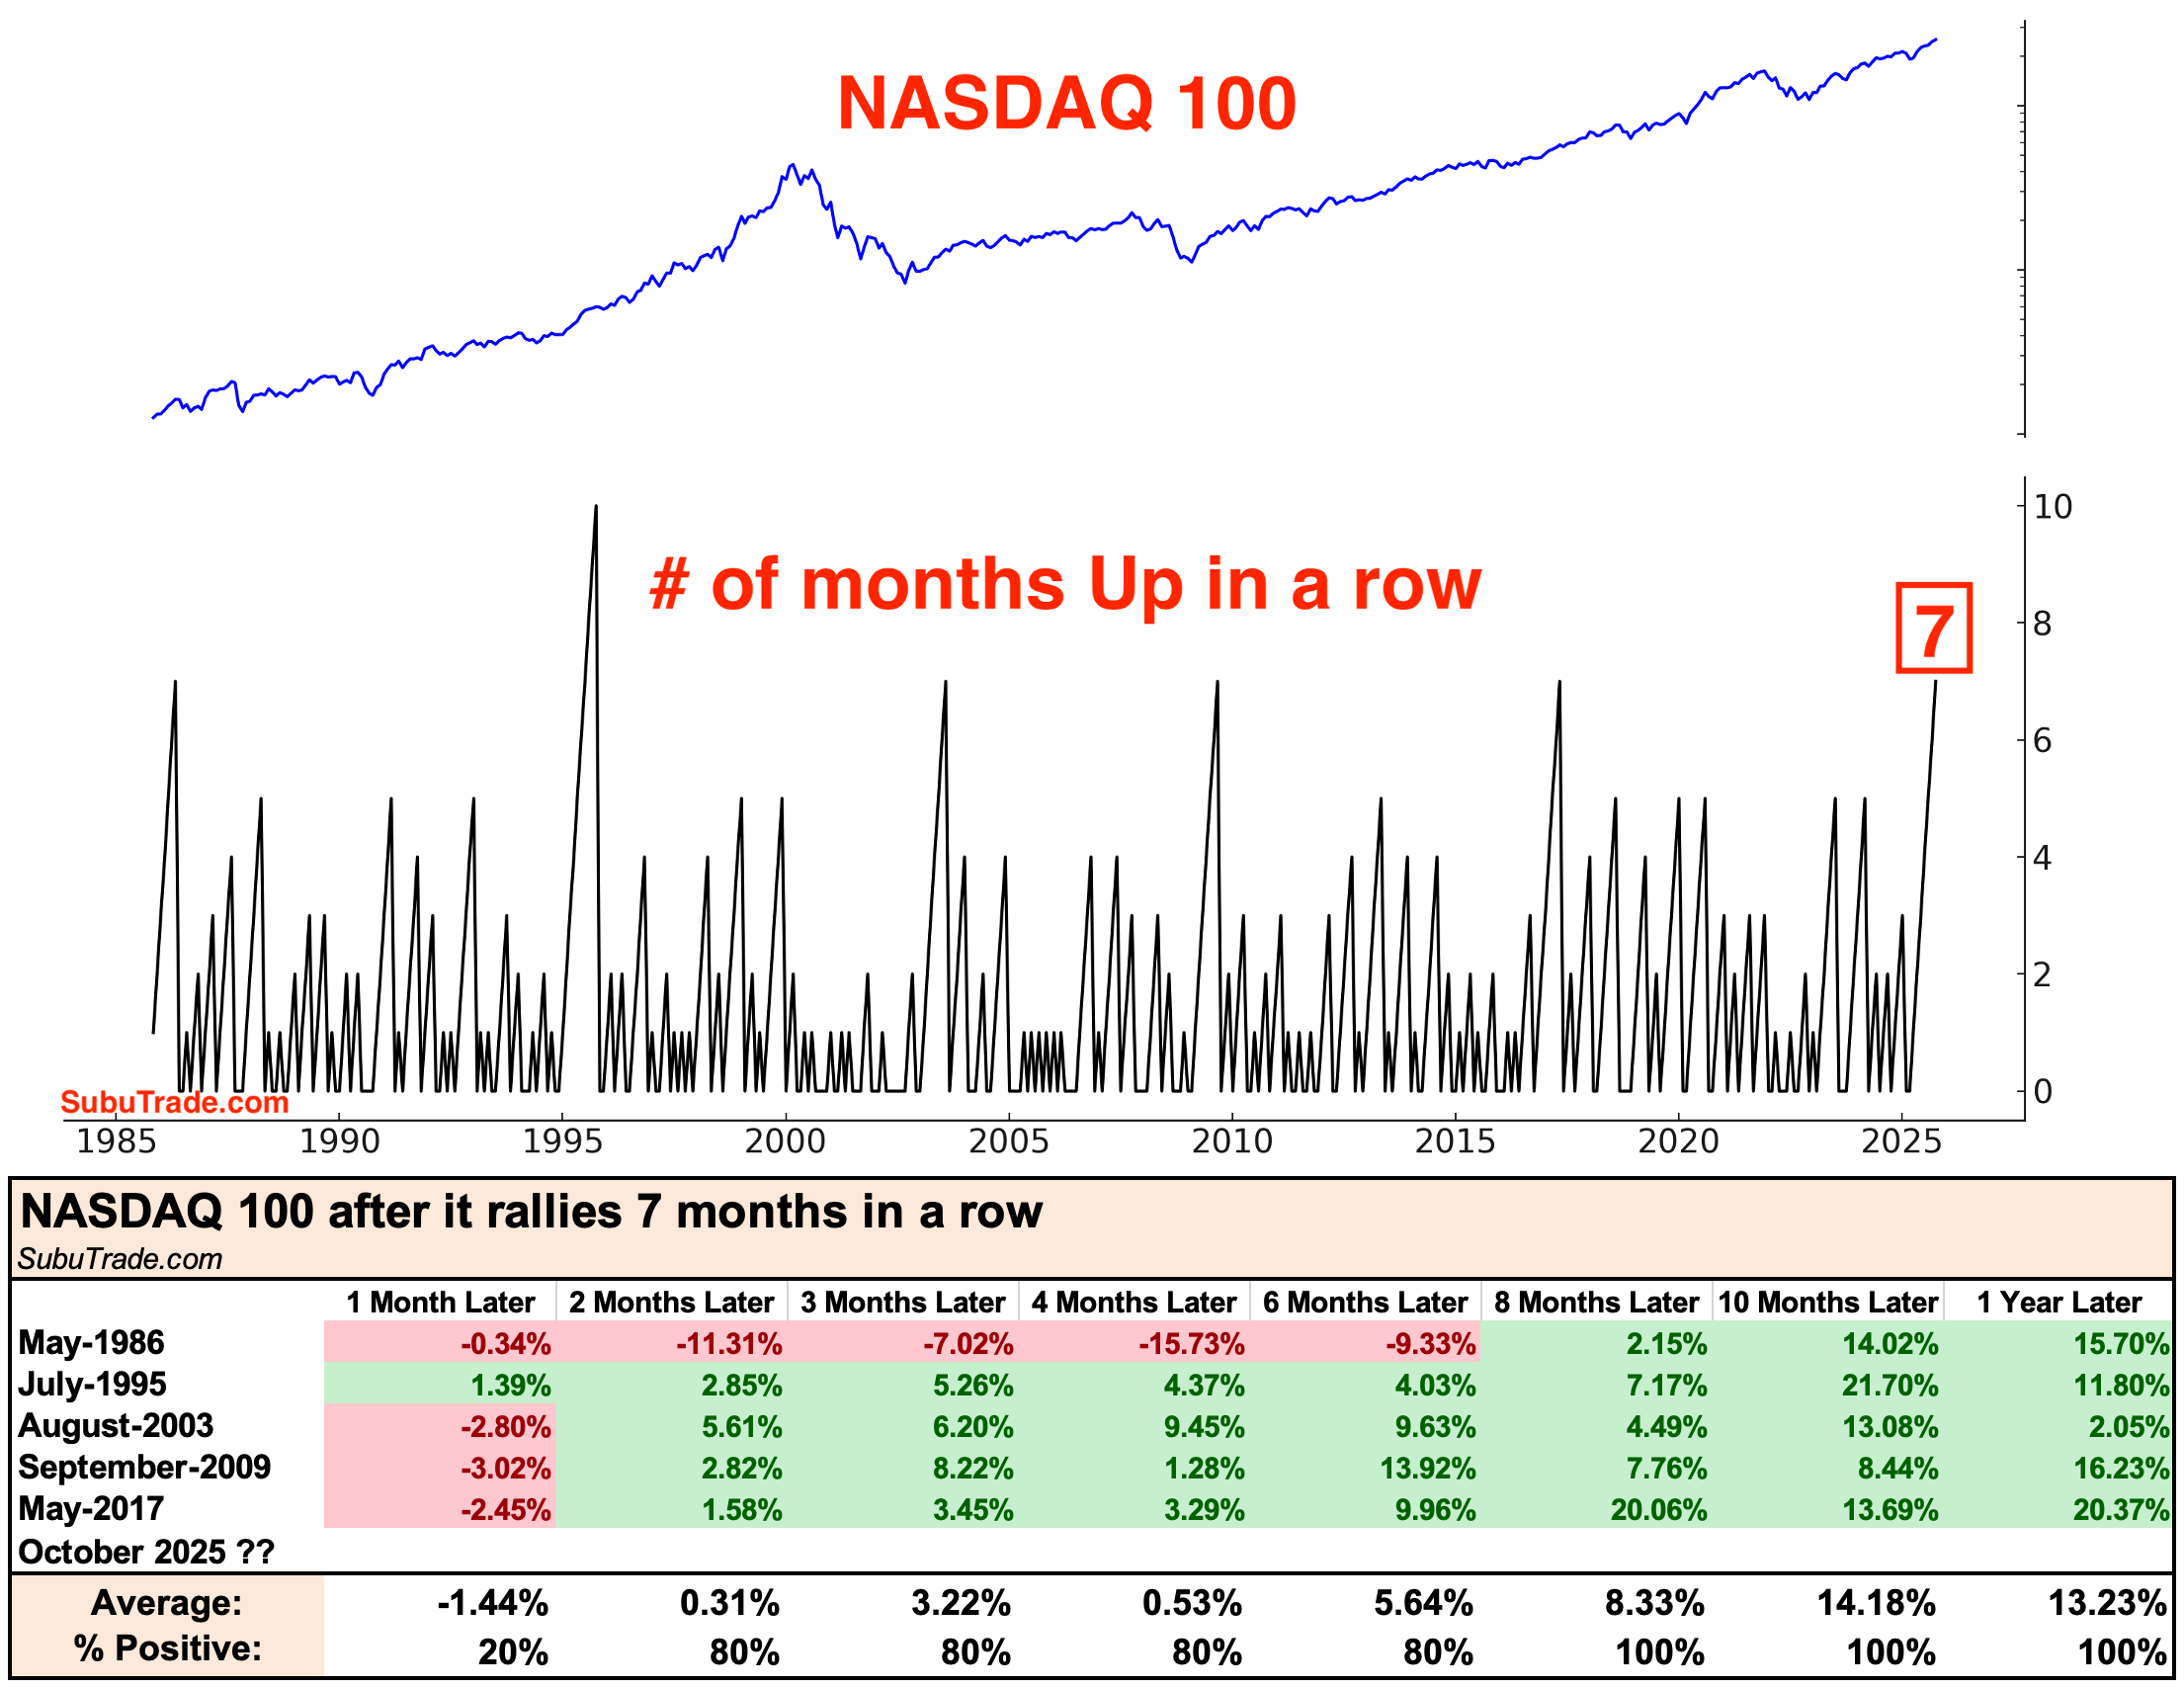
This tech-led rally has seen the NASDAQ gain +47% in the past 7 months. Such strong momentum is usually followed by short term losses, followed by more gains later:
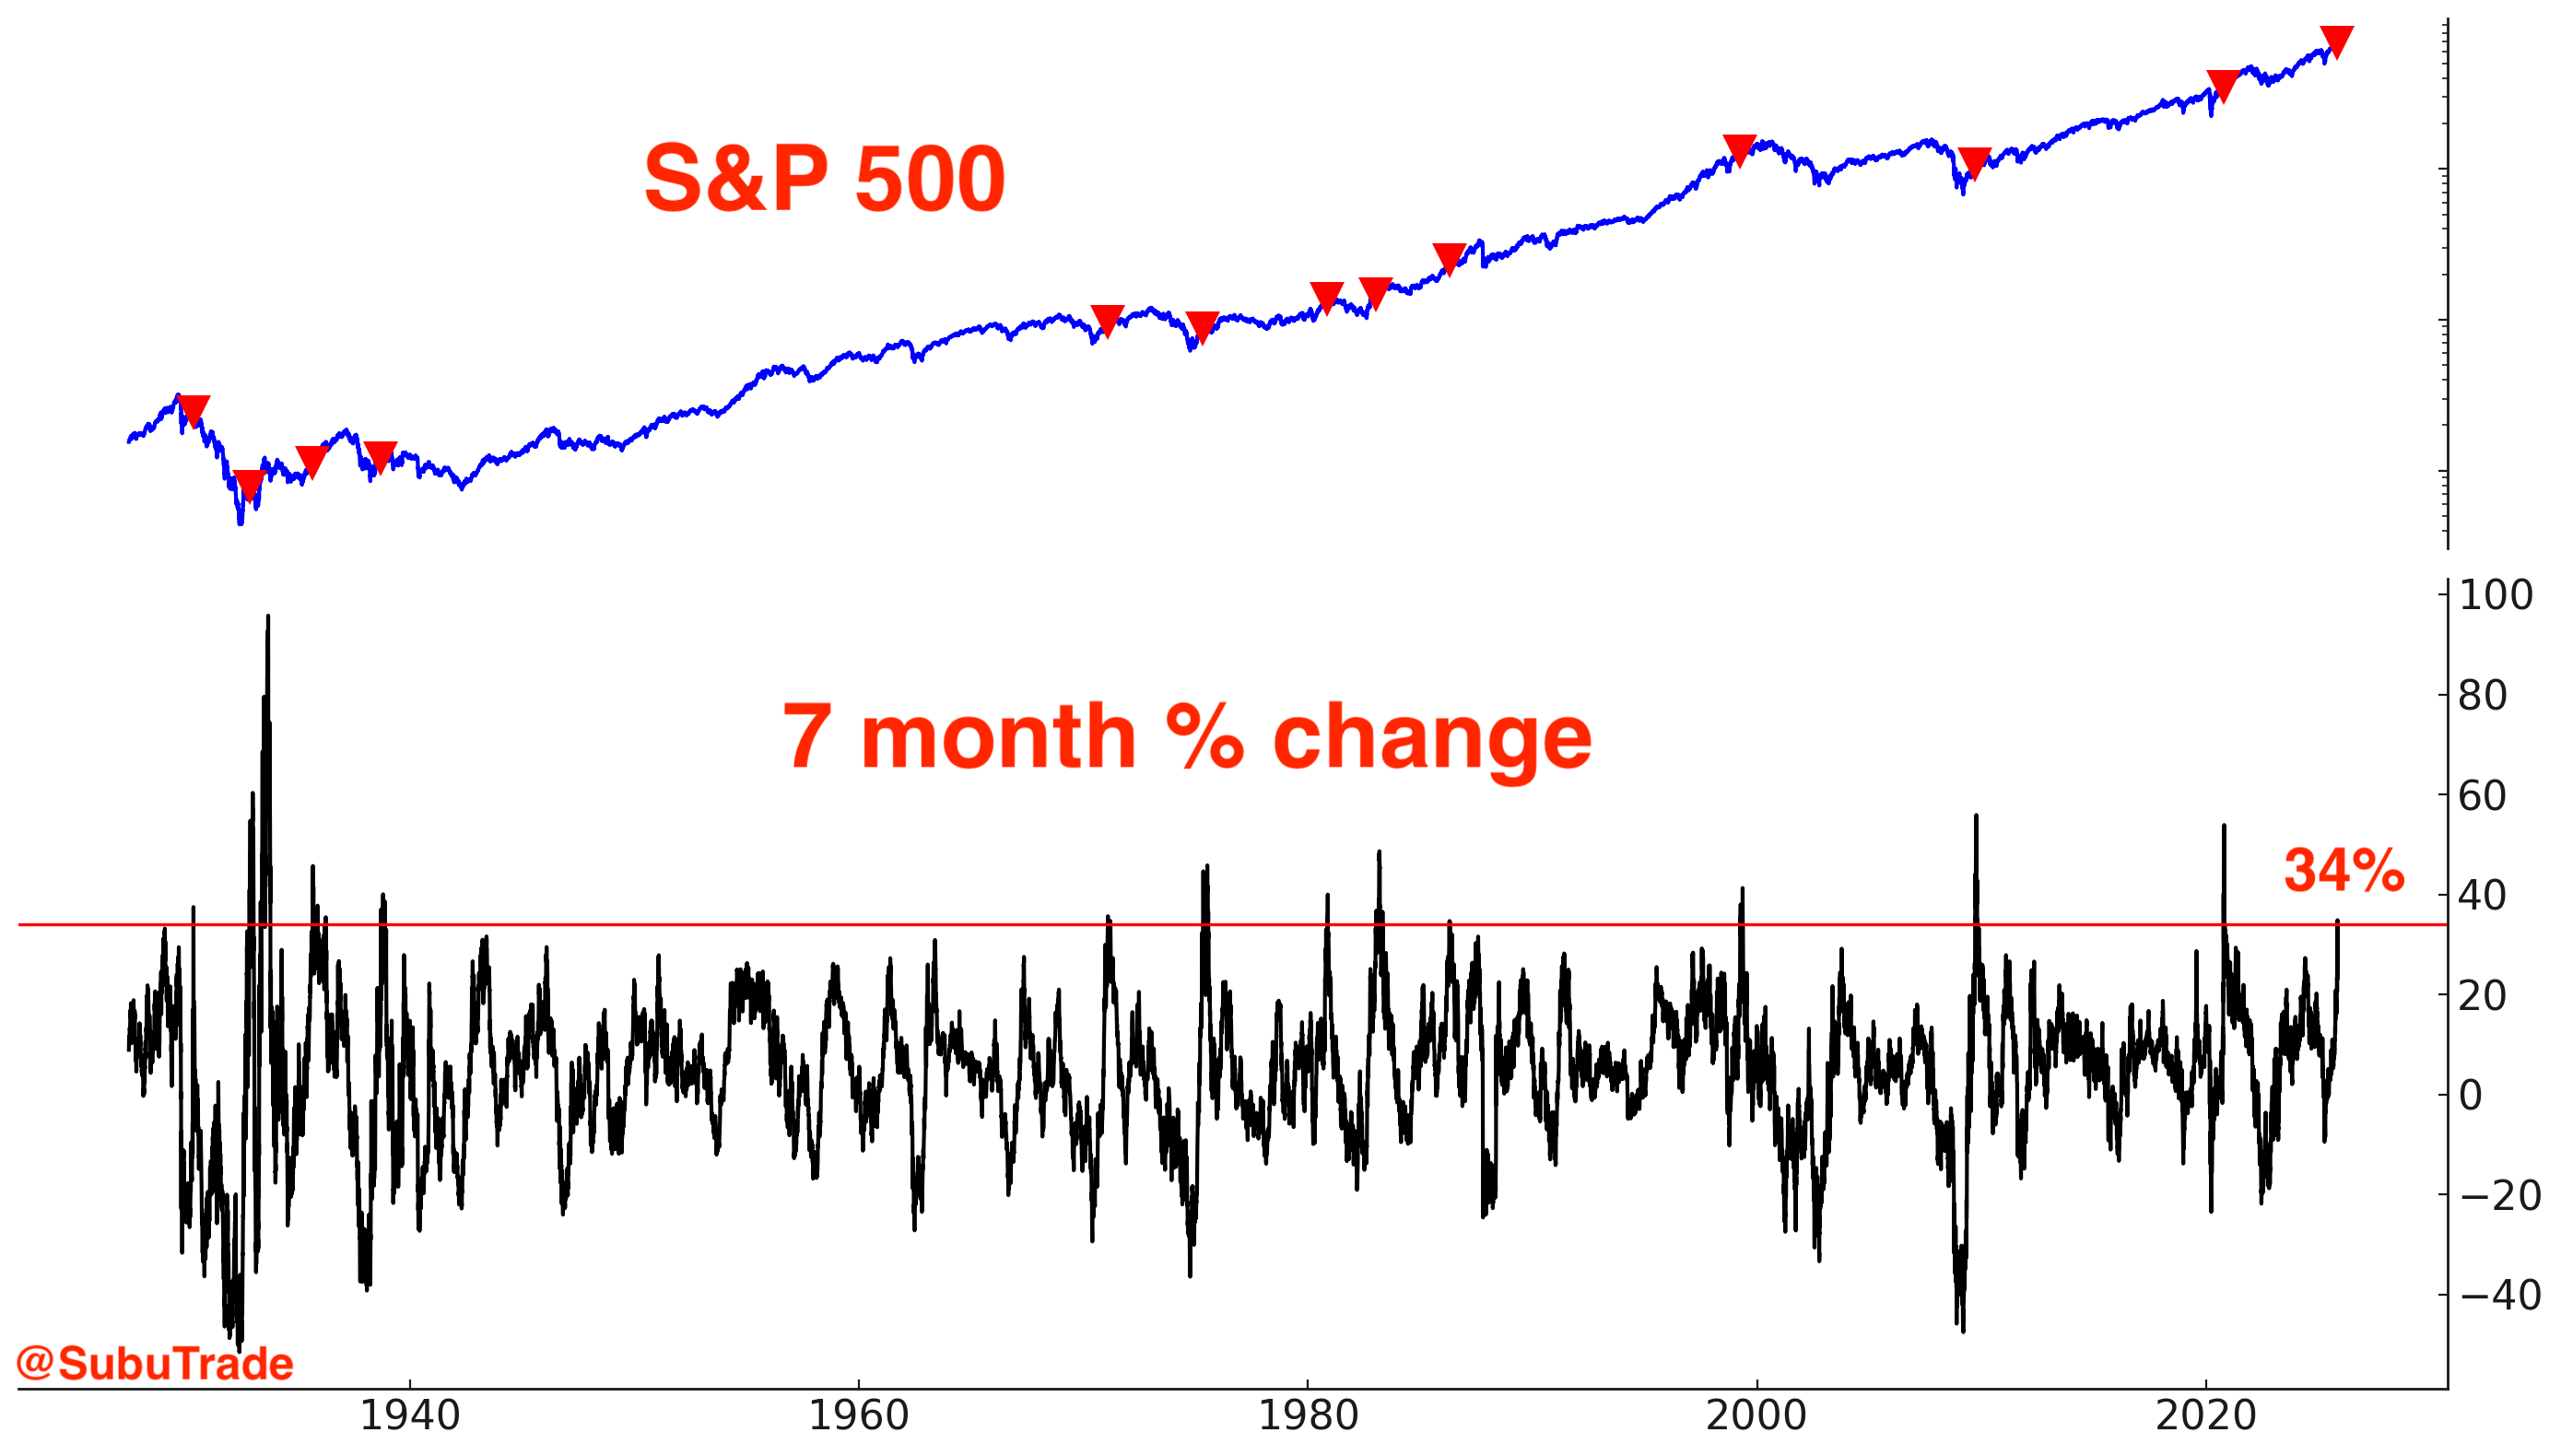
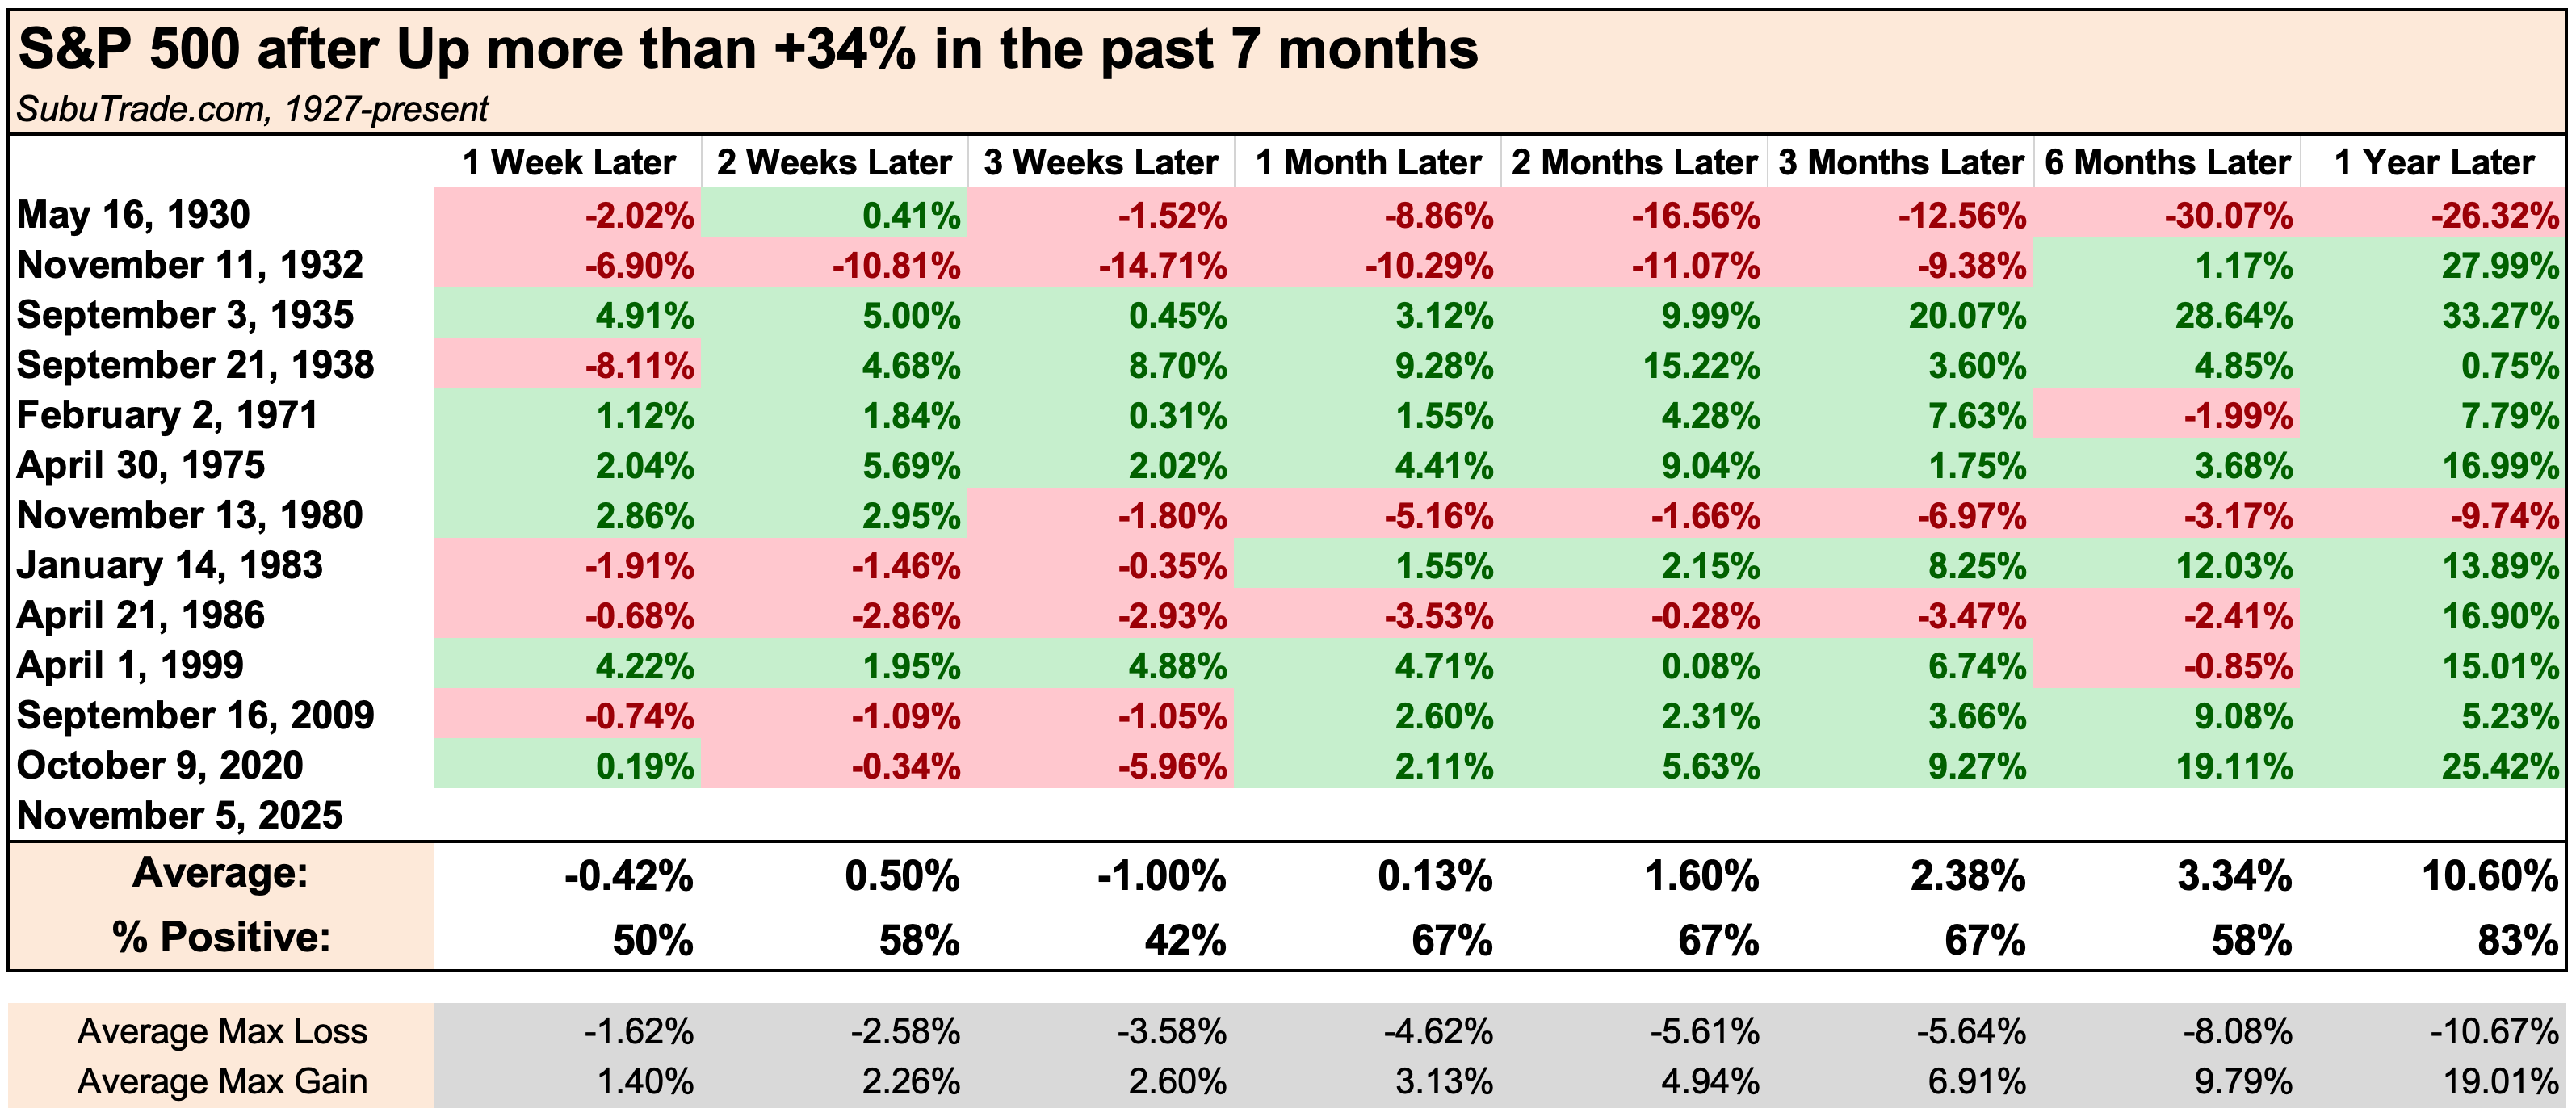
With a relatively narrow rally (the equal-weighted S&P has been flat since July), the S&P’s 7 month % change is at a less powerful +34%:
Using monthly CLOSE $ data, the NASDAQ 100 is up 7 months in a row. Again, powerful momentum usually leads to Short-Term weakness & Longer-Term gains.
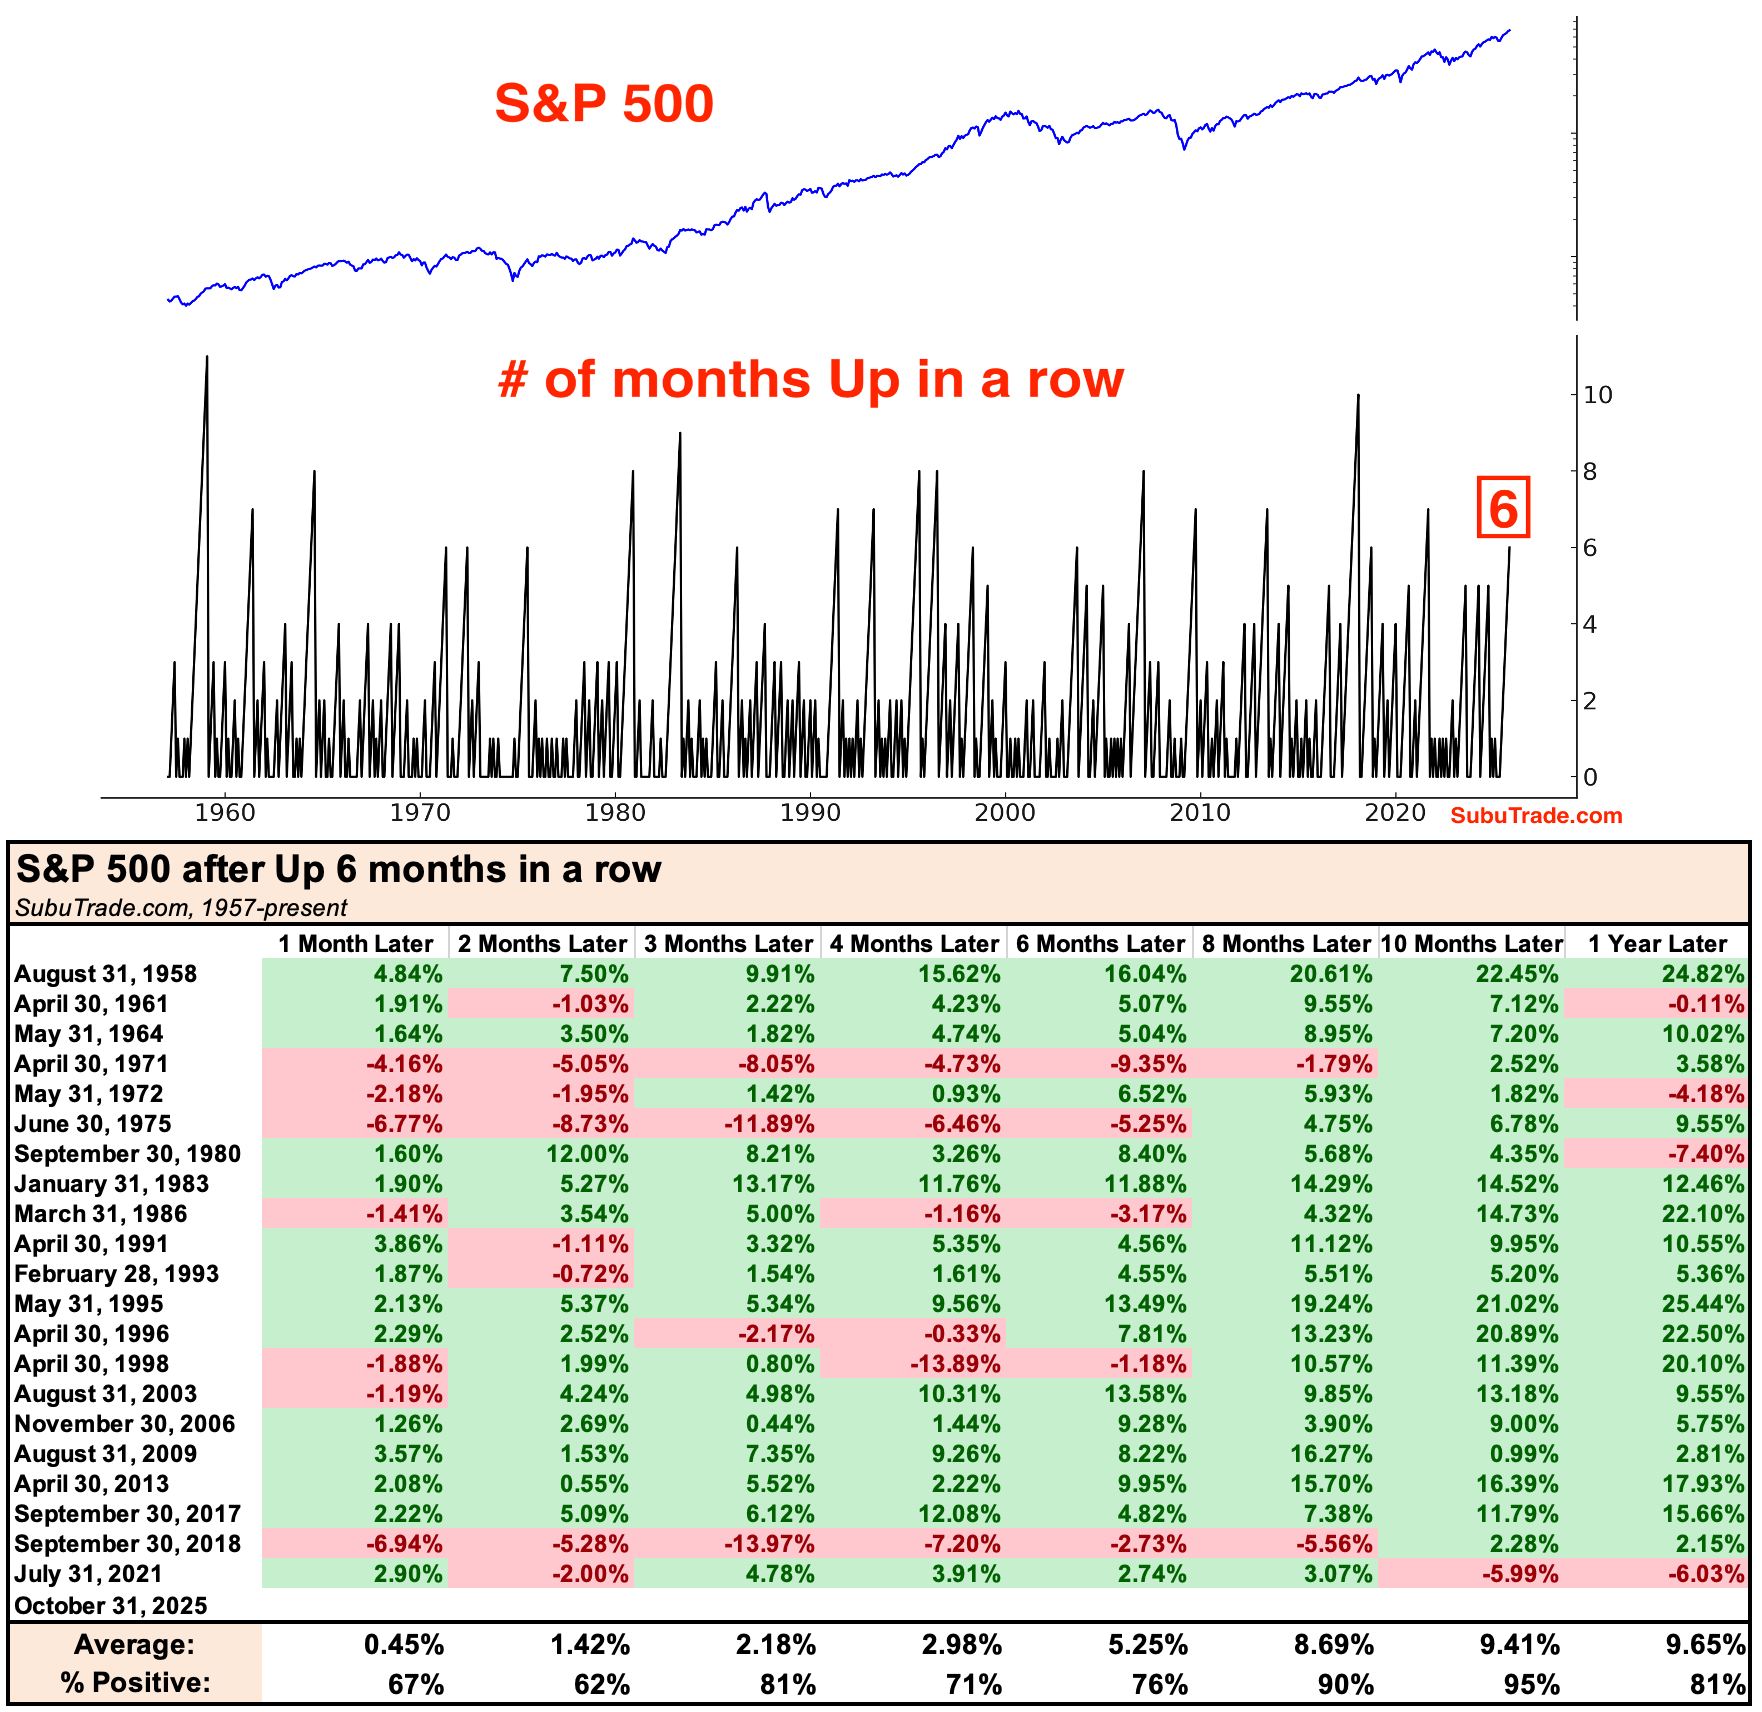
The S&P 500 is up 6 months in a row. The difference between the NASDAQ’s 7 month streak vs. the S&P’s 6 month streak comes down to the fact that:
The NASDAQ closed April slightly higher than March
The S&P closed April slightly lower than March
Working together with Mean Reversion indicators are various breadth warning signs. It’s important to remember that bearish breadth signs can have false signals. But after analyzing HUNDREDS of indicators, there are objectively very few indicators that can give you a statistically significant bearish signal on a LARGE sample size.
While this may be shocking to some traders, if you find an indicator that tells you “the S&P has a 60%+ probability of falling over the next 2 months” with a sample size of n=40, you are in extremely rarefied territory. There are very few indicators with that capability over a large sample size! This is because the stock market has a slow bullish bias. The longer you wait, the more likely the stock market is to rally.
The Hindenburg Omen is one such indicator. Hindenburg Omens trigger when breadth is split: a relatively large % of stocks are at 52 week highs while a relatively large % of stocks are at 52 week lows.
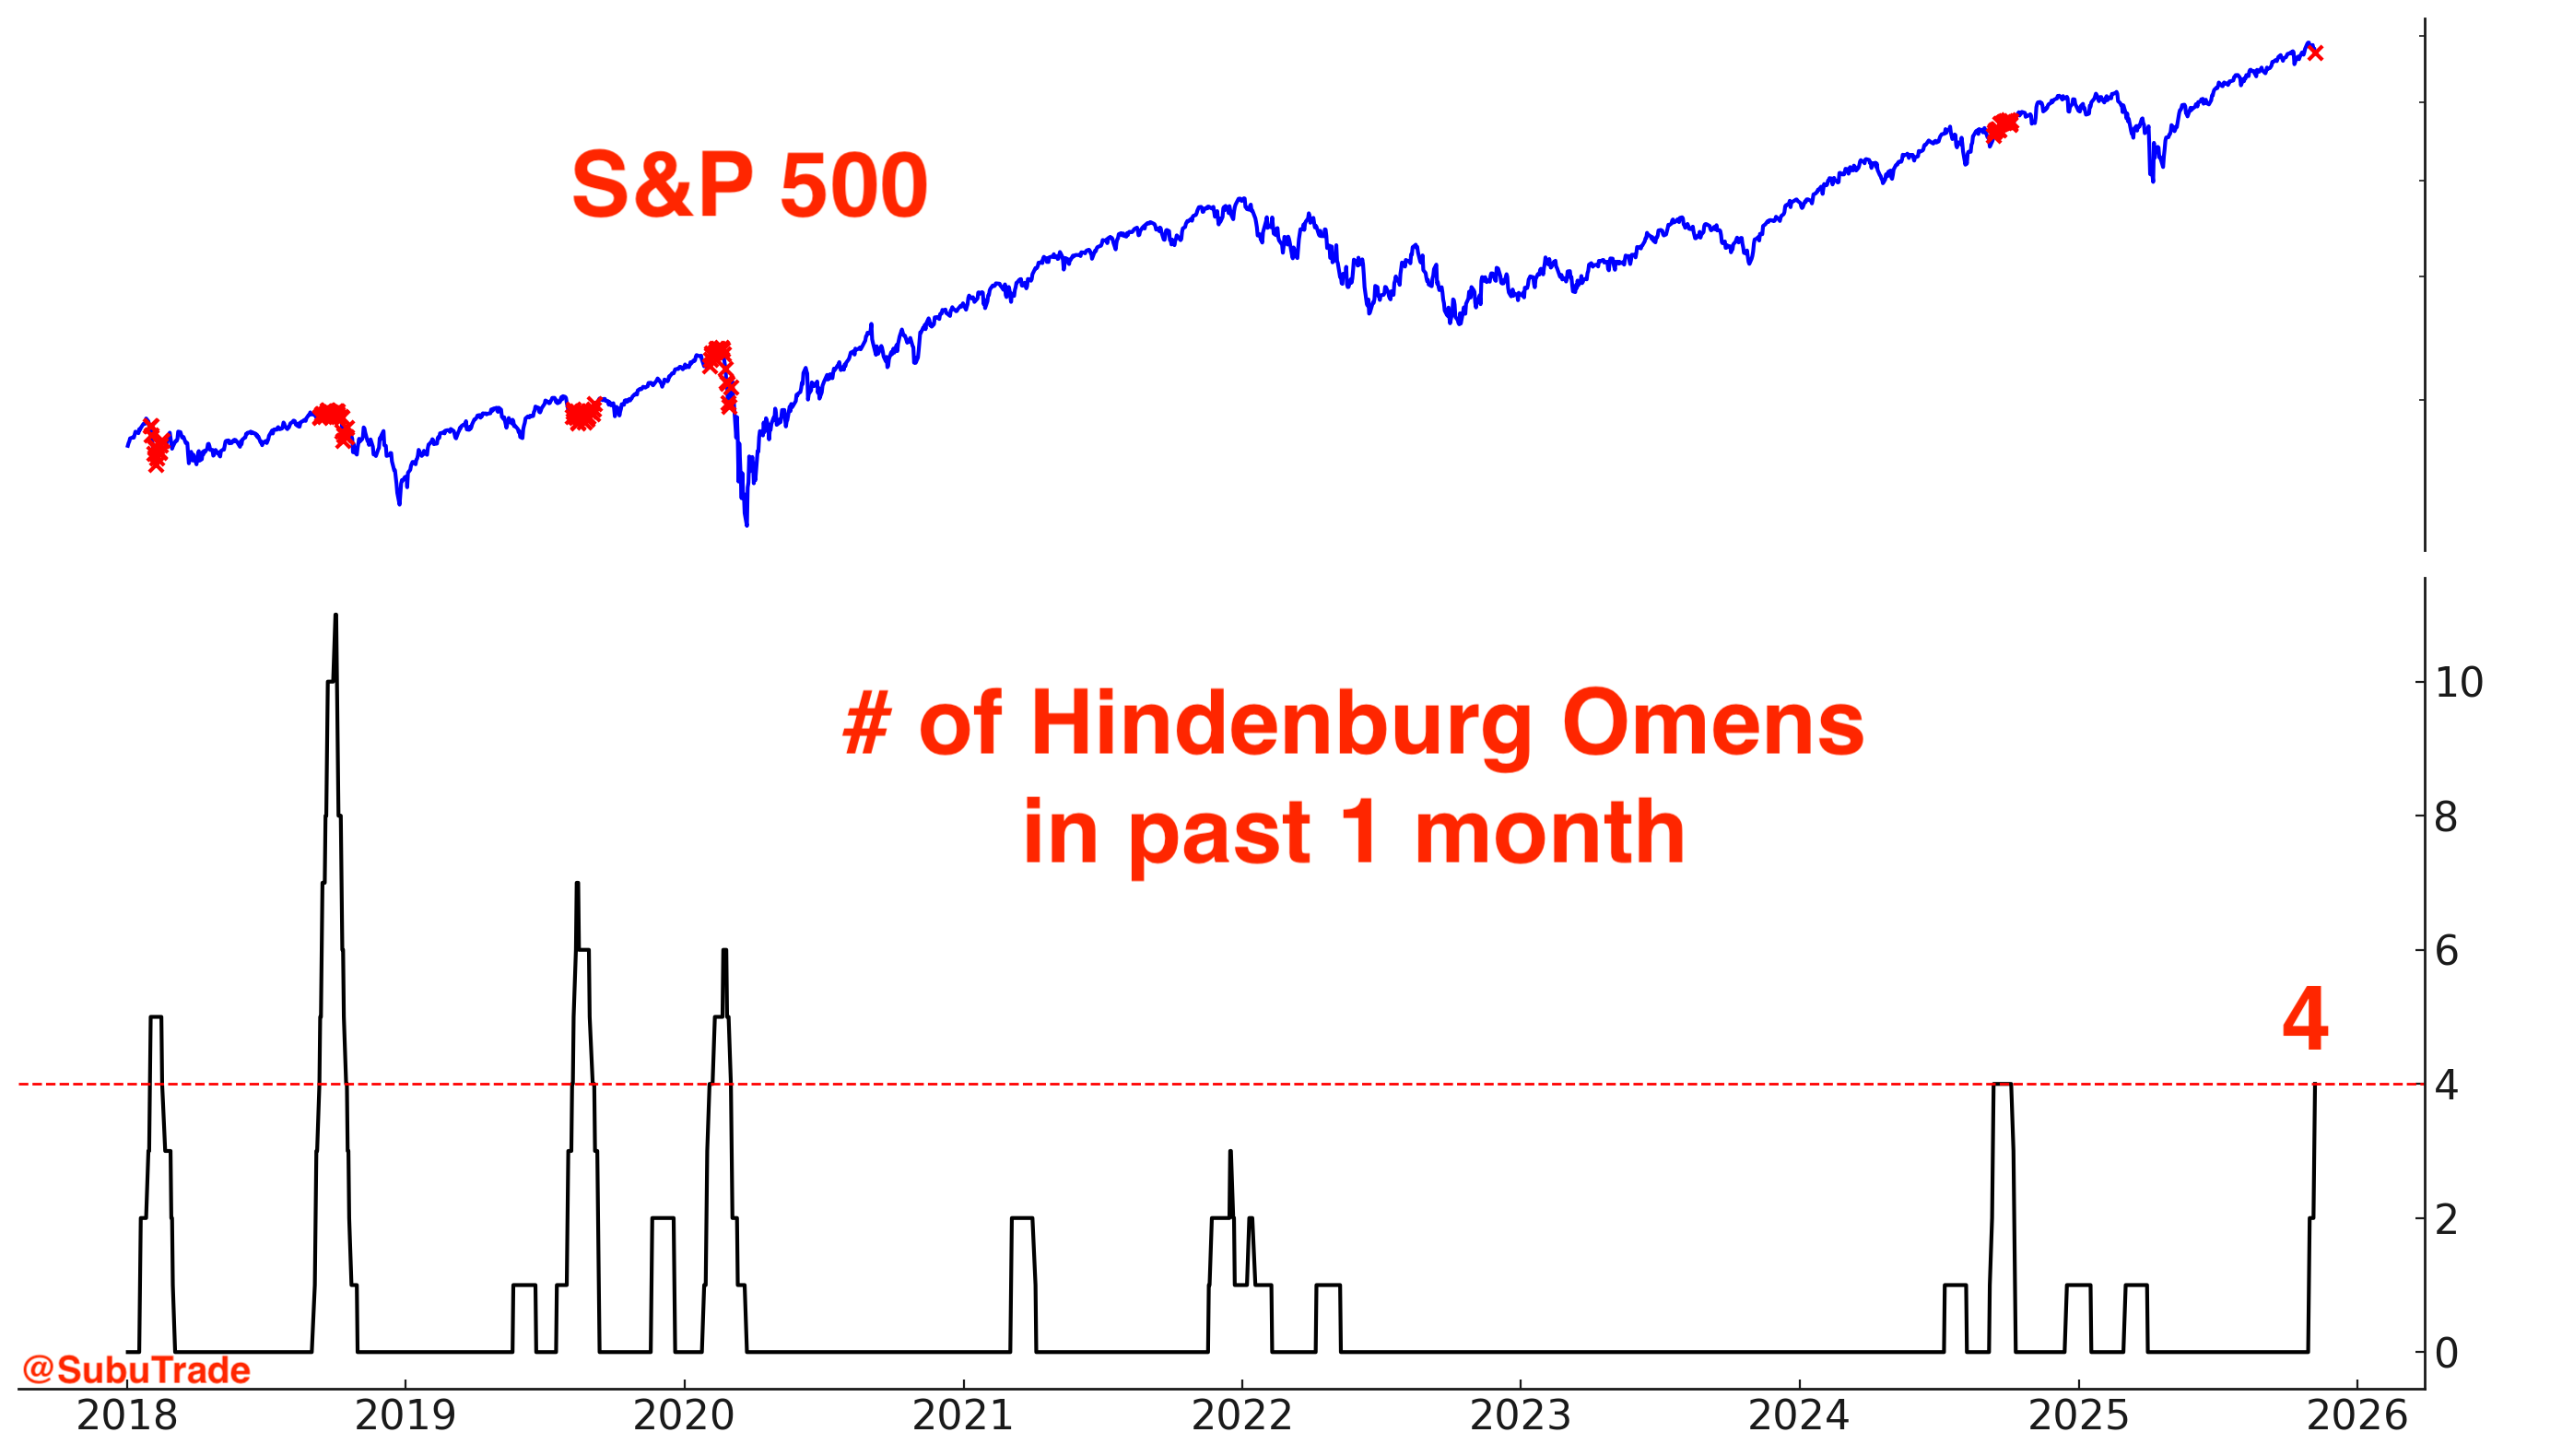
This past month has seen 4 Hindenburg Omens trigger already. This isn’t a perfect bearish signal. Sometimes Hindenburg Omens trigger too early. But this should at the very least raise some alarms in your mind.
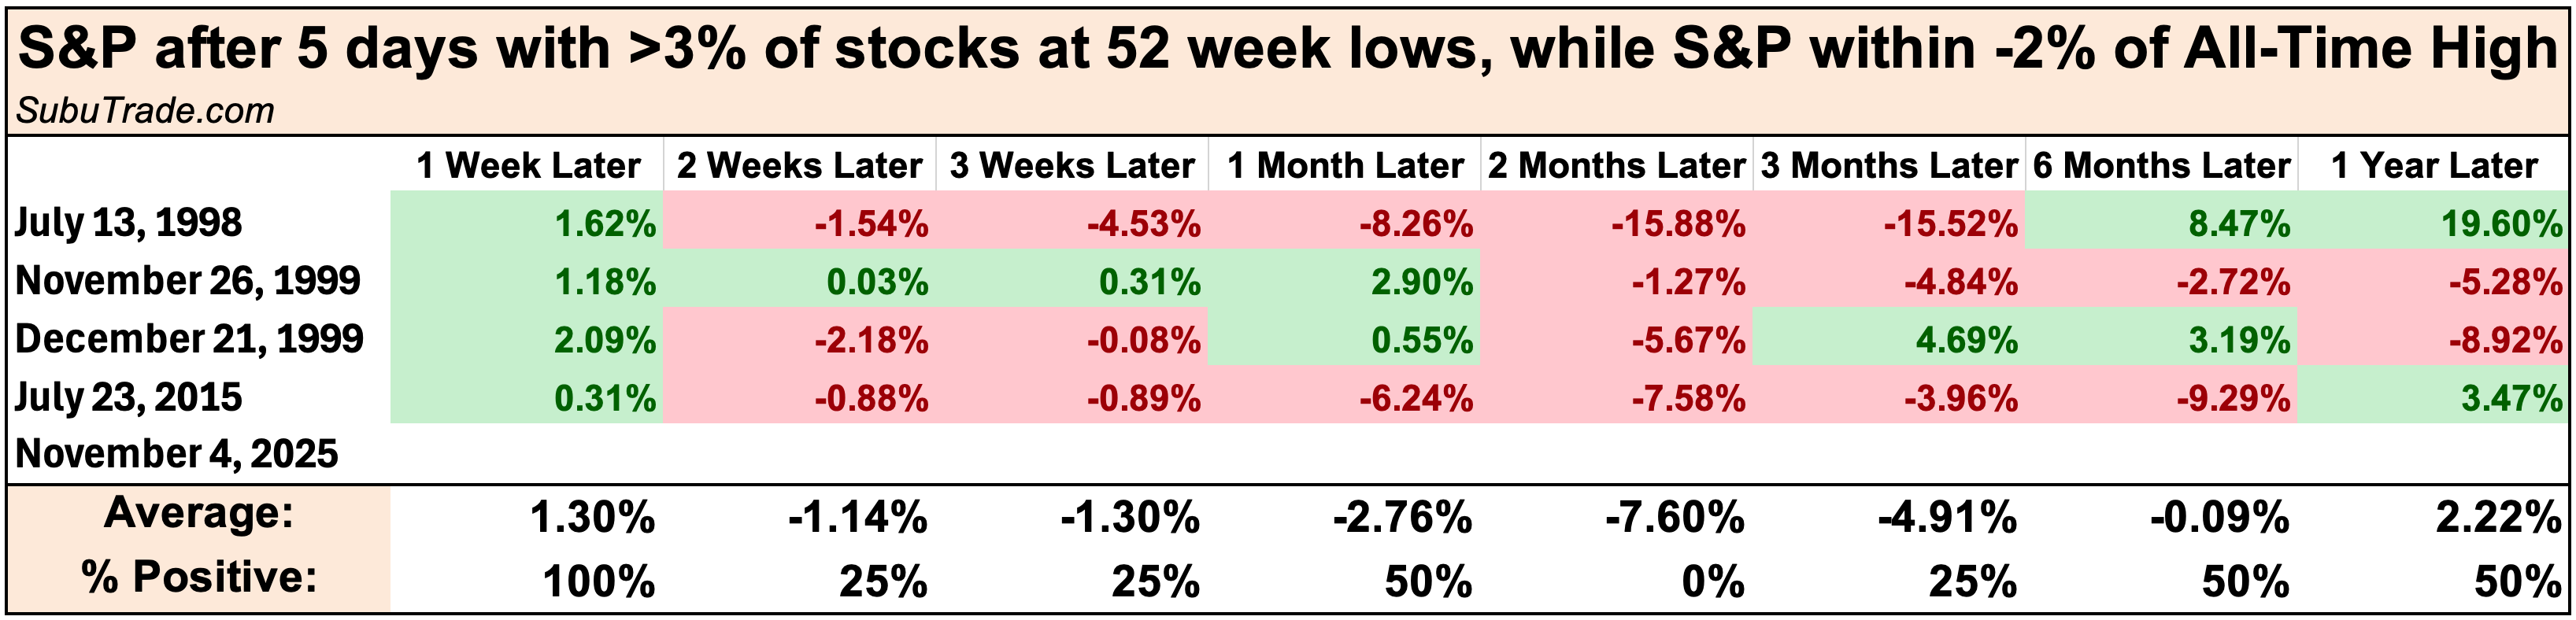
As already stated, the Hindenburg Omen is being triggered because there are a larger-than-expected % of stocks at 52 week lows.
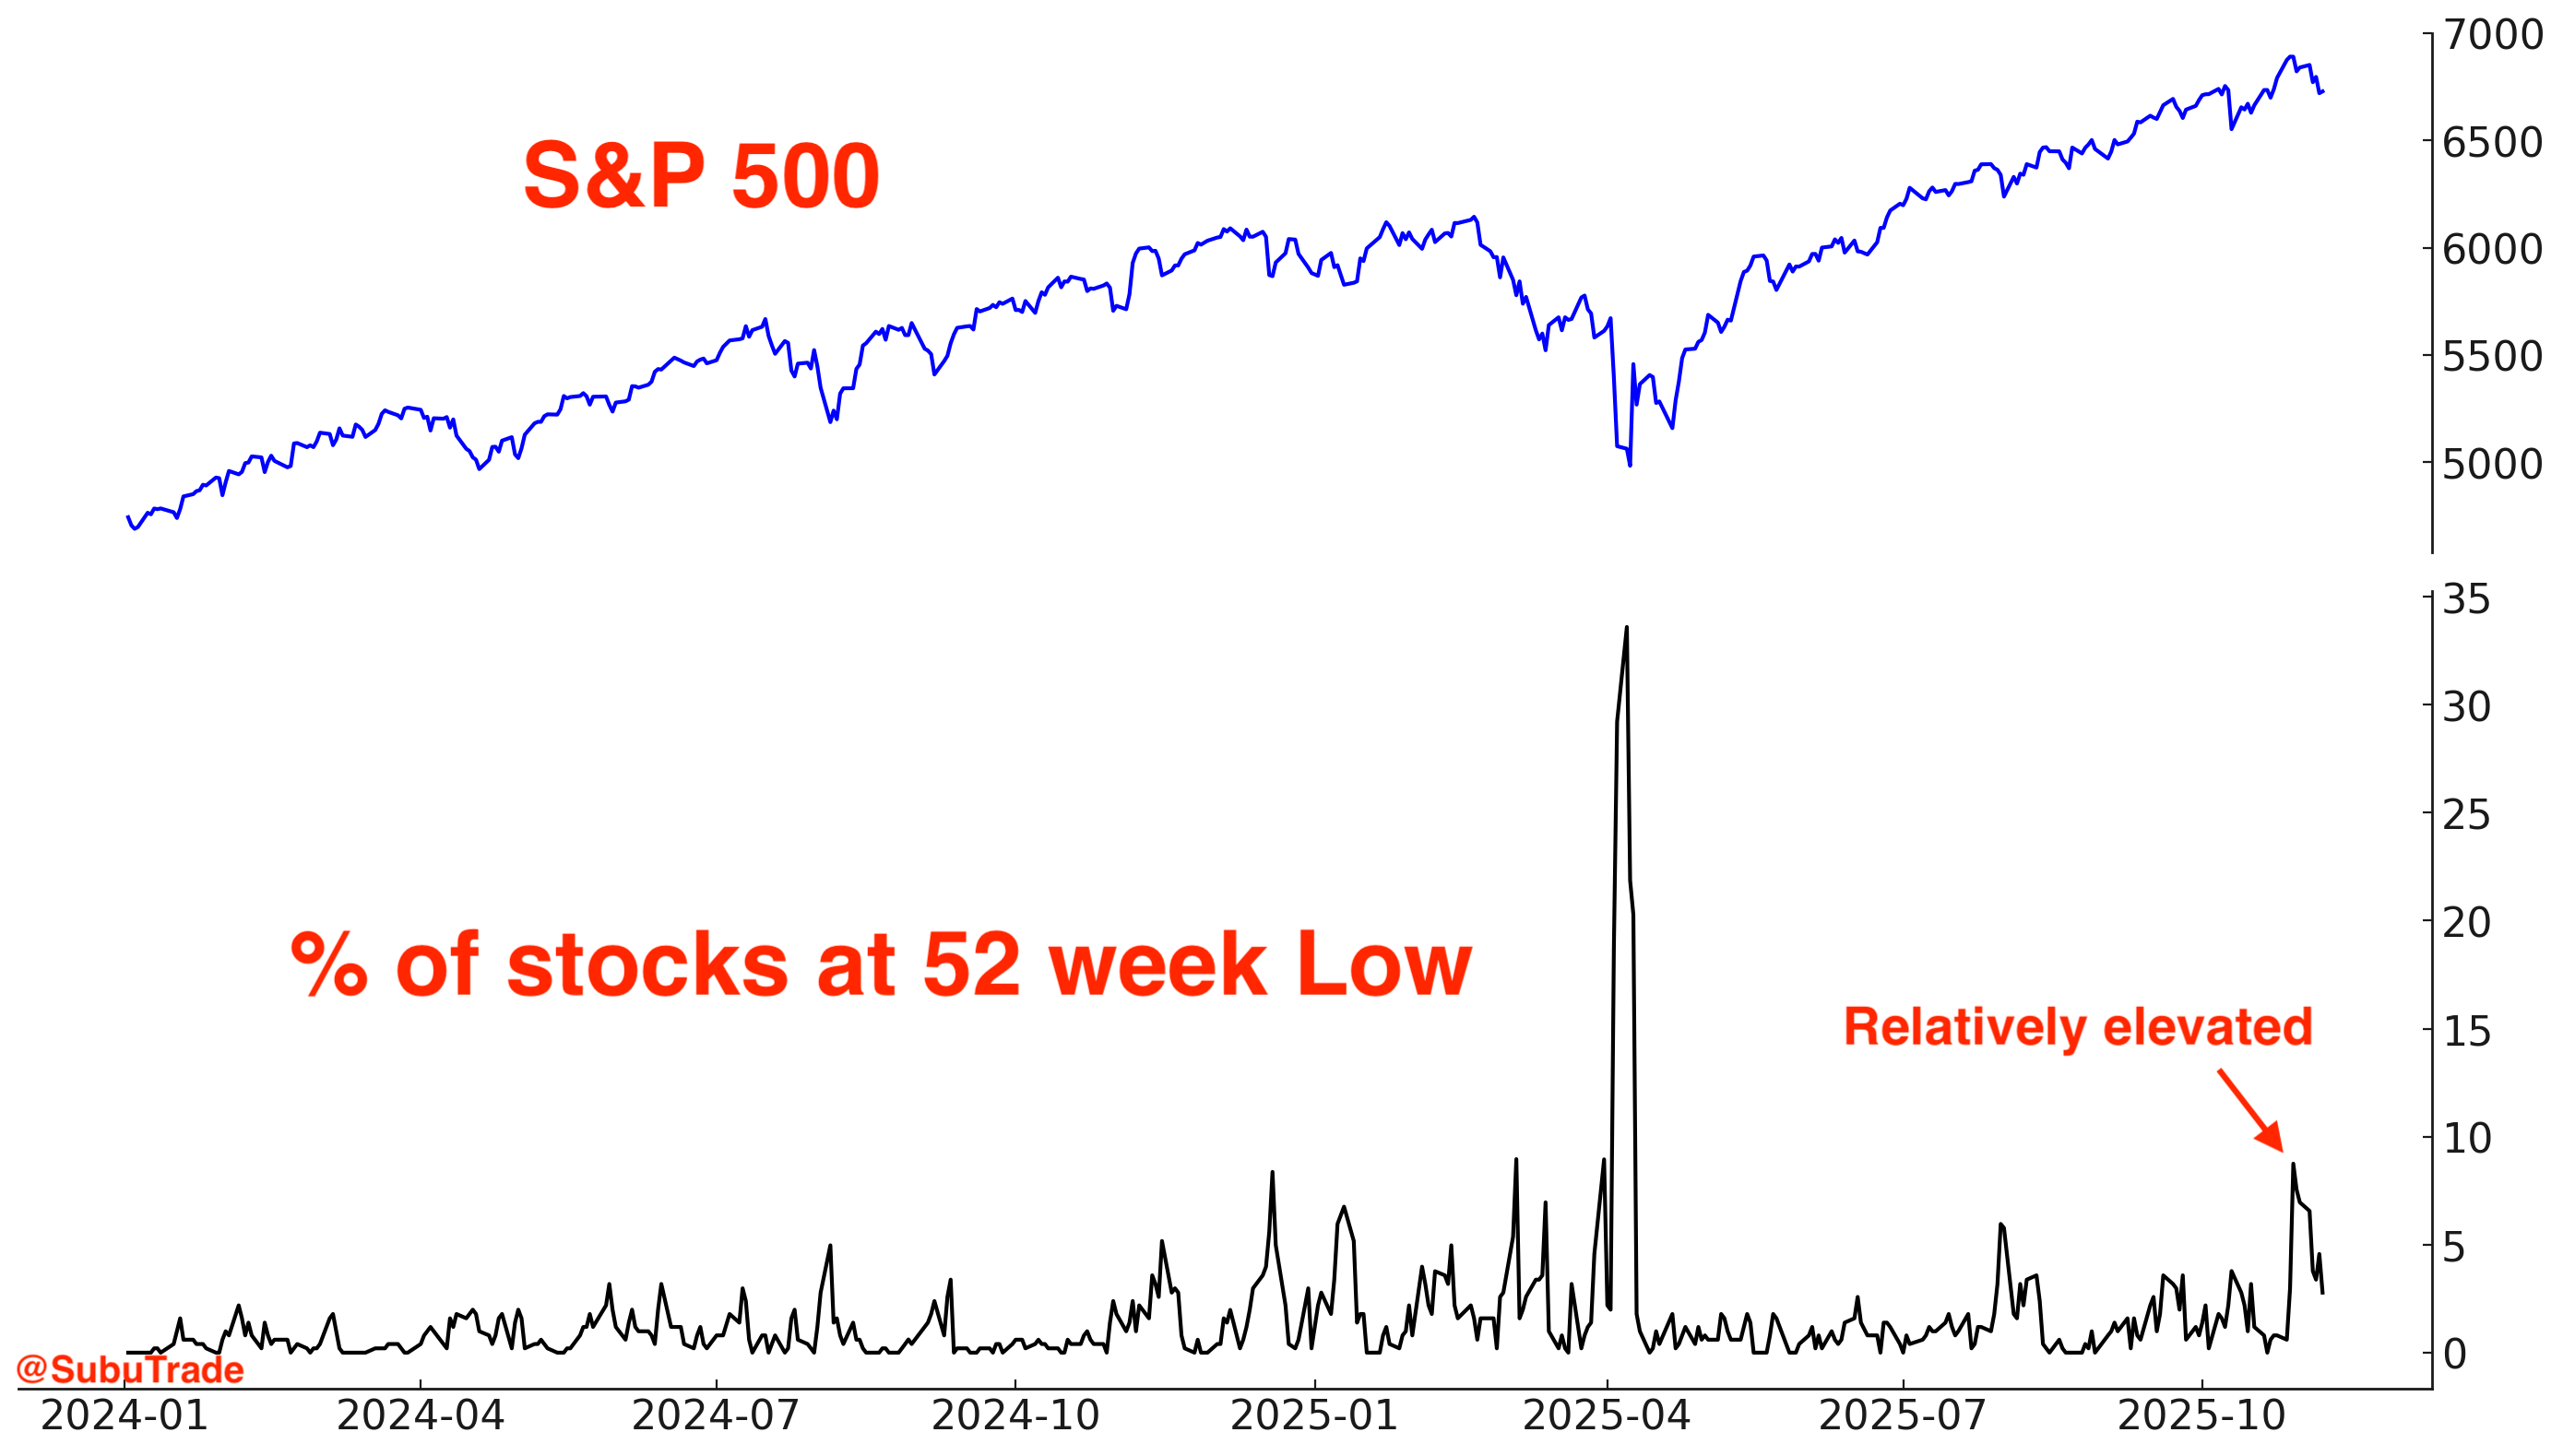
This is not common when the index is so close to all-time highs. This has only occurred before….
the August 1998 stock market crash
the 2000 dot-com bubble’s top
the August 2015 stock market crash
Today
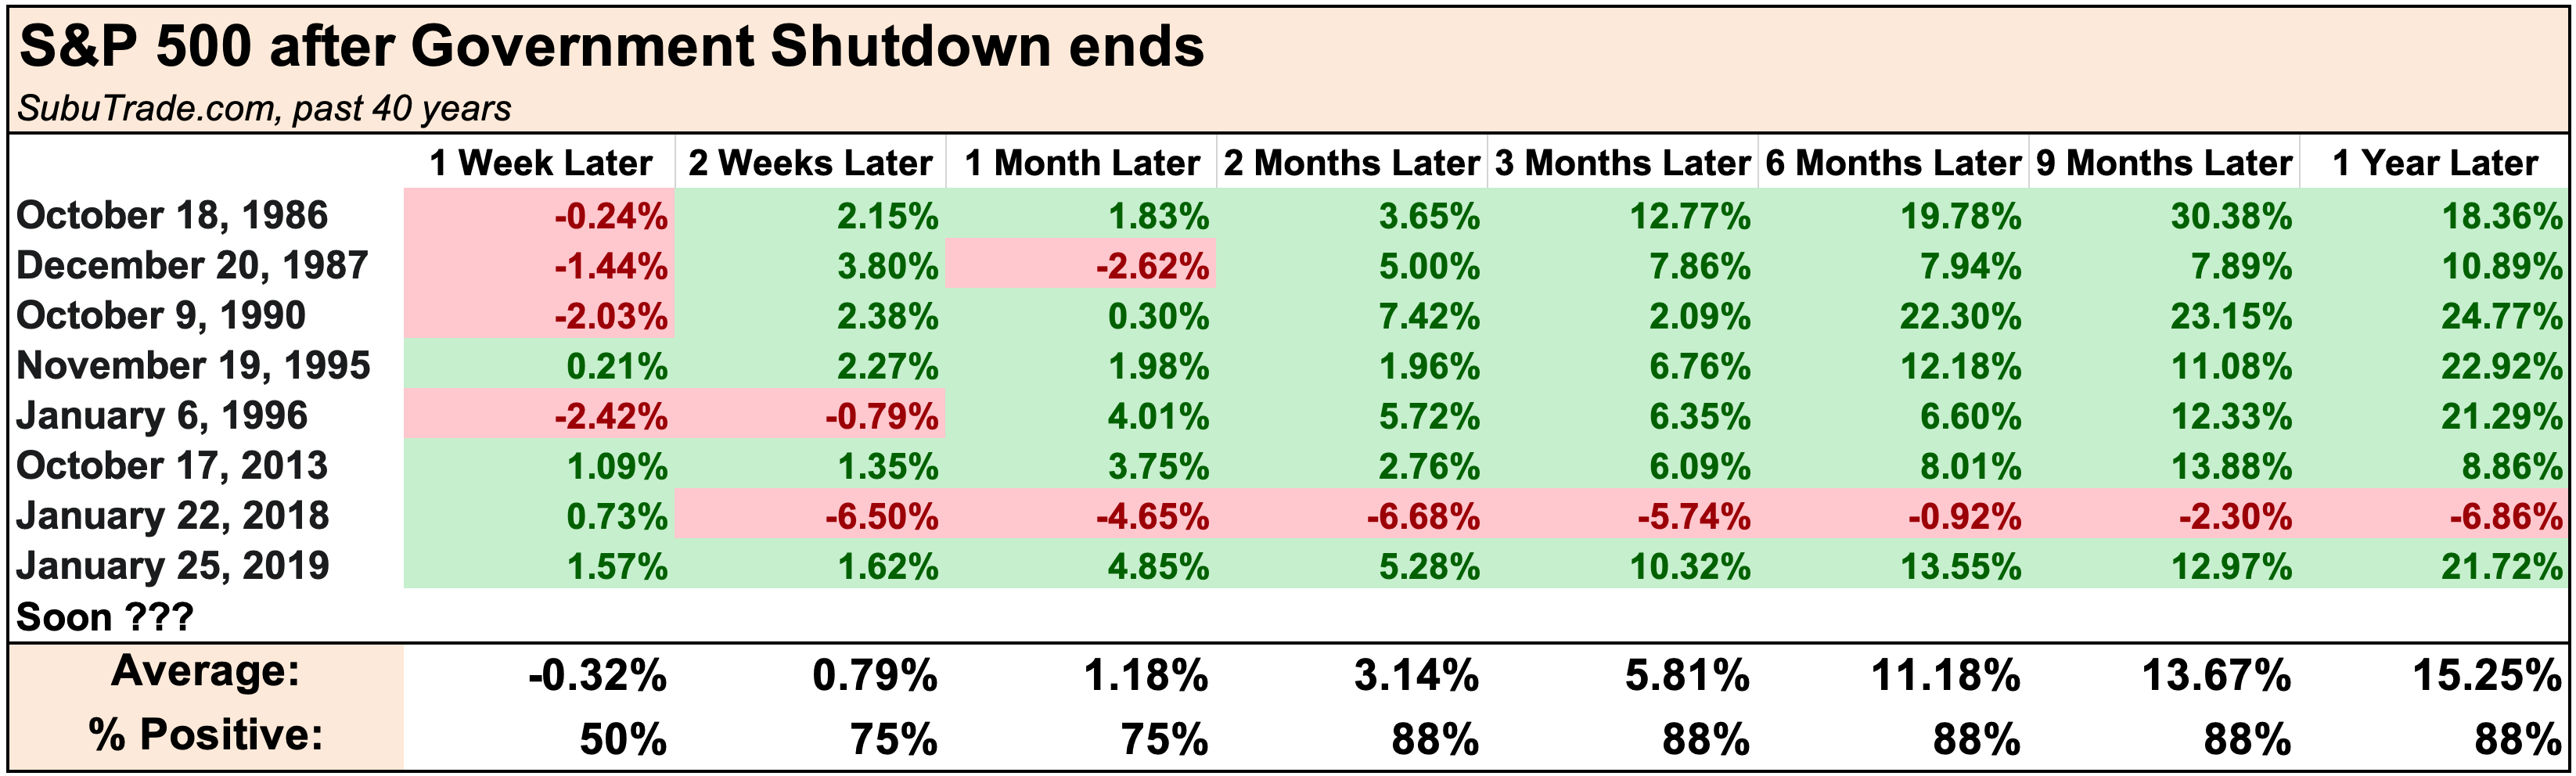
On an interesting side note, the government shutdown may be ending soon. Stocks have a tendency to rally after government shutdowns end. Treat this with a grain of salt:

U.S. Stocks
Options
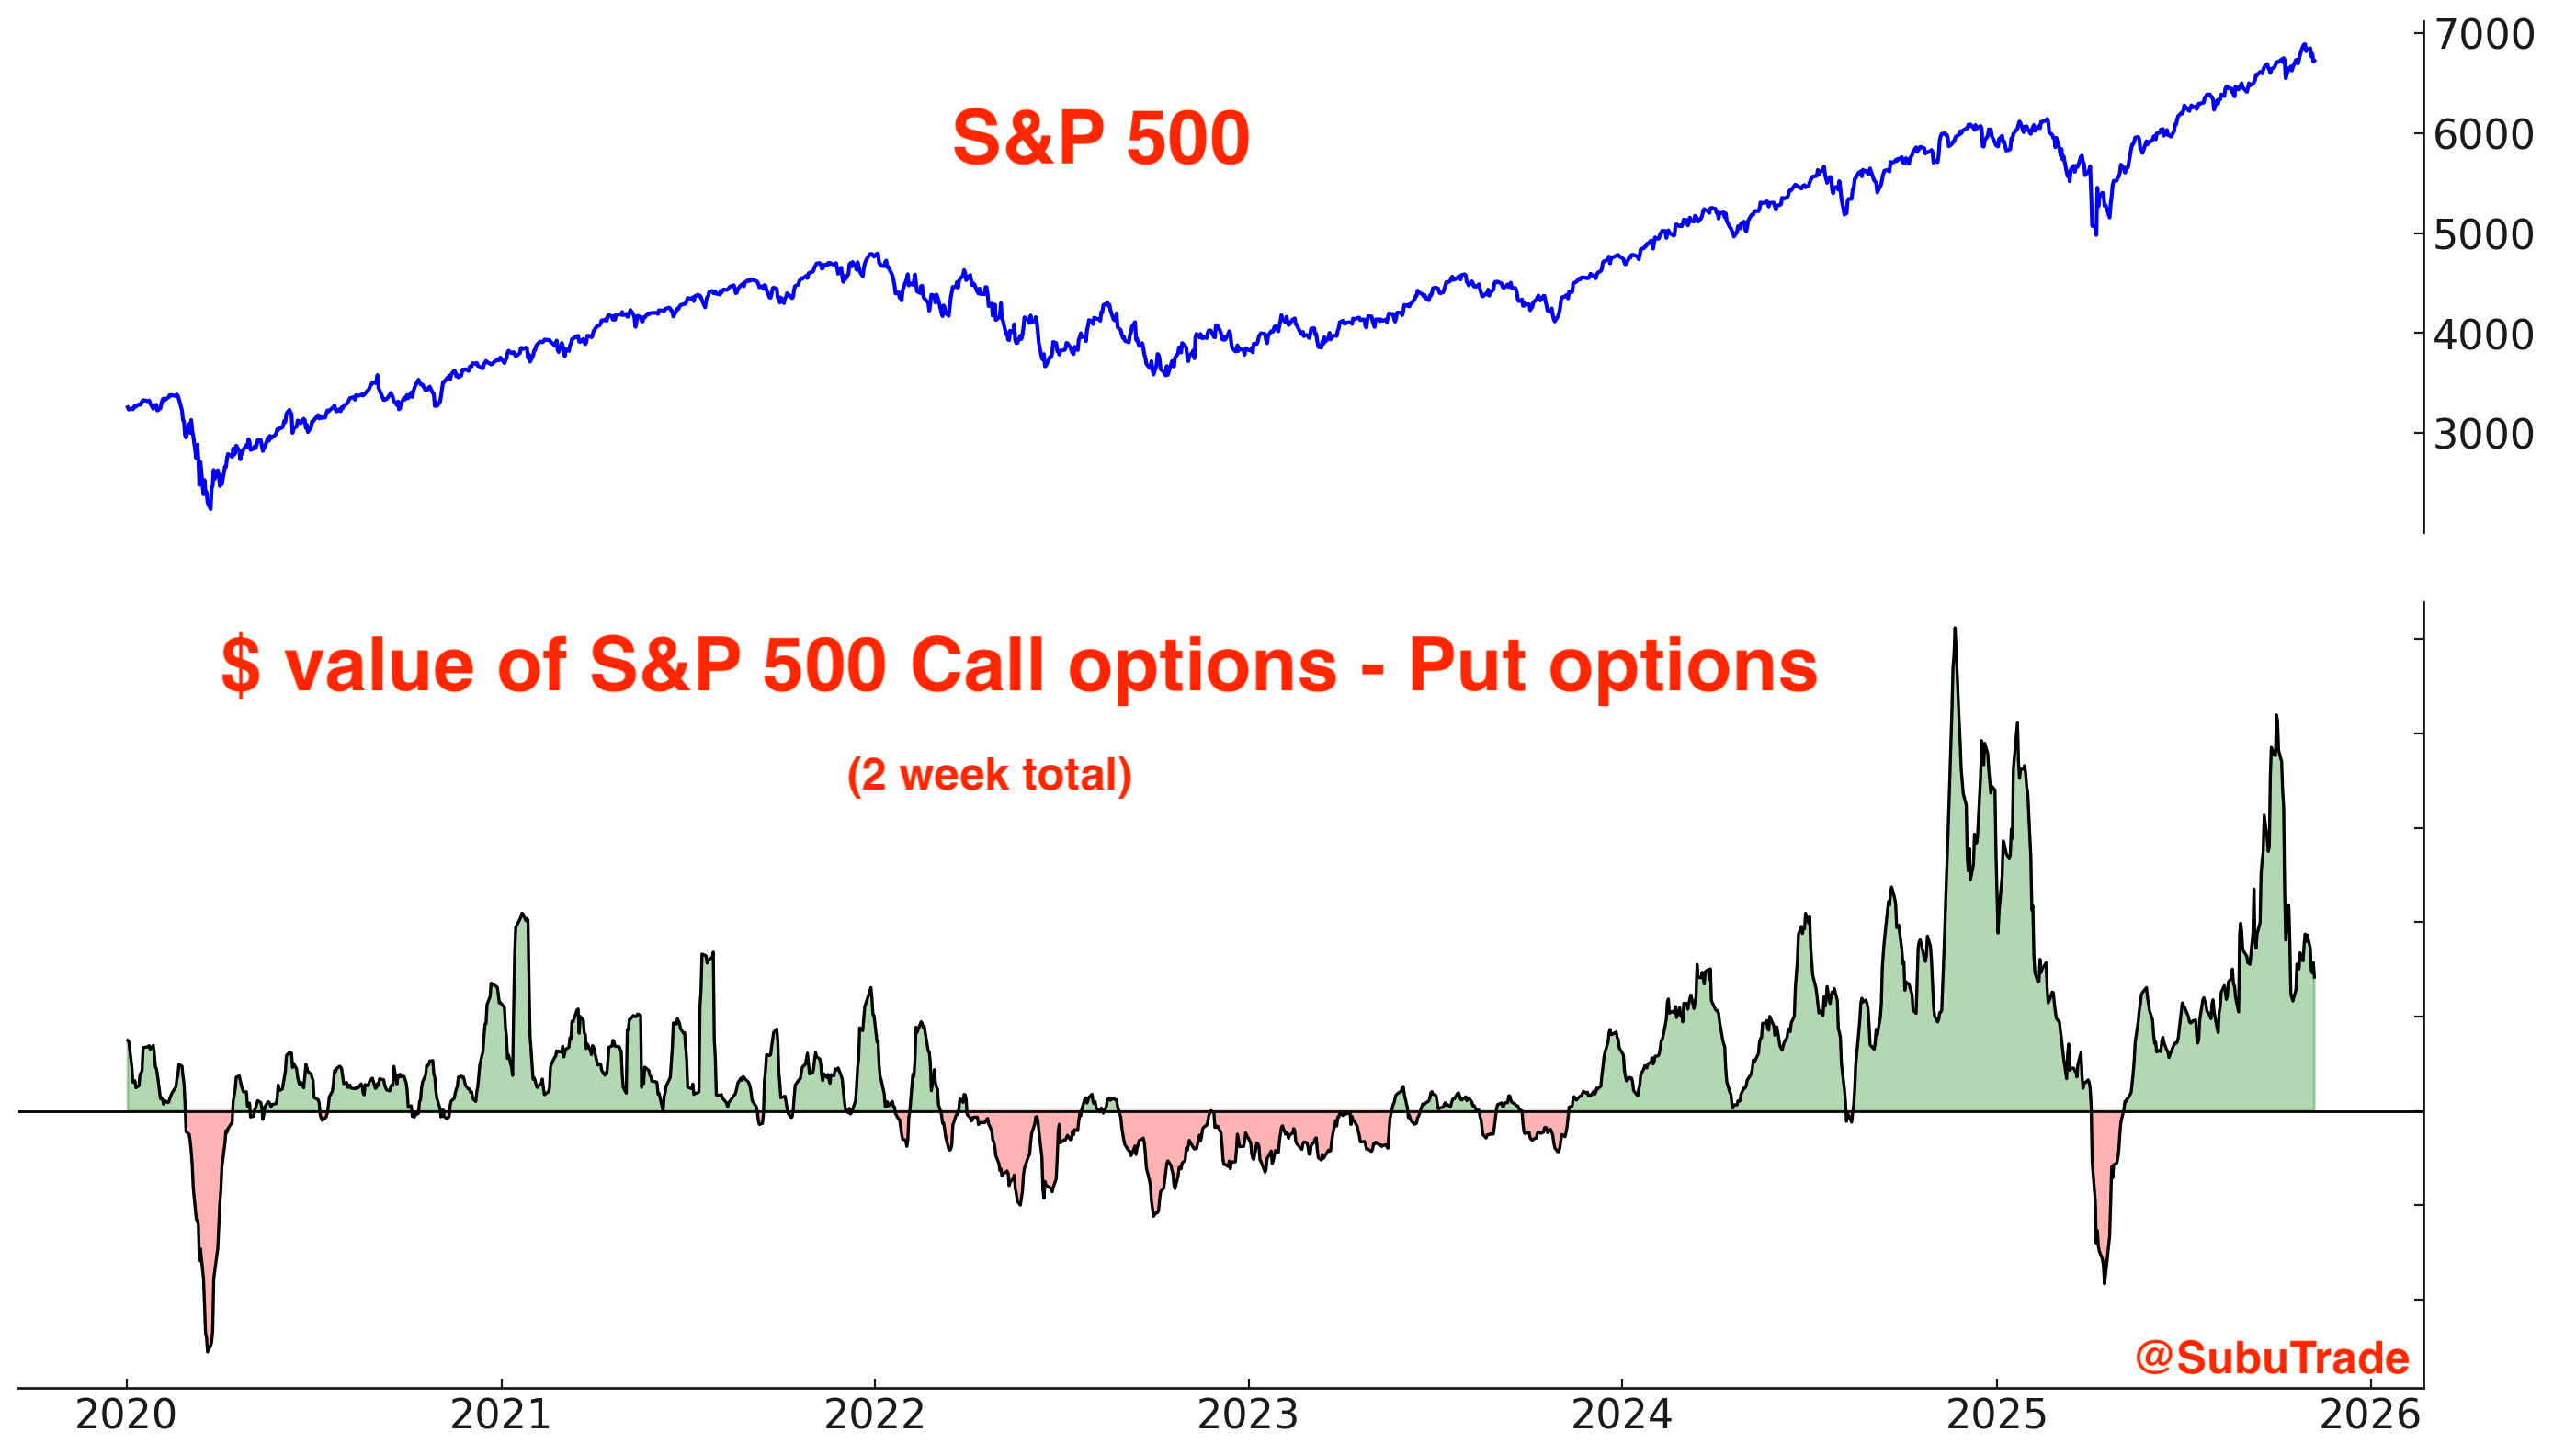
The market’s increased volatility over the past month reduced some speculative froth. The $ value of S&P 500 Call volume - the $ value of S&P 500 Put volume, which spiked, is now down to more normal levels:
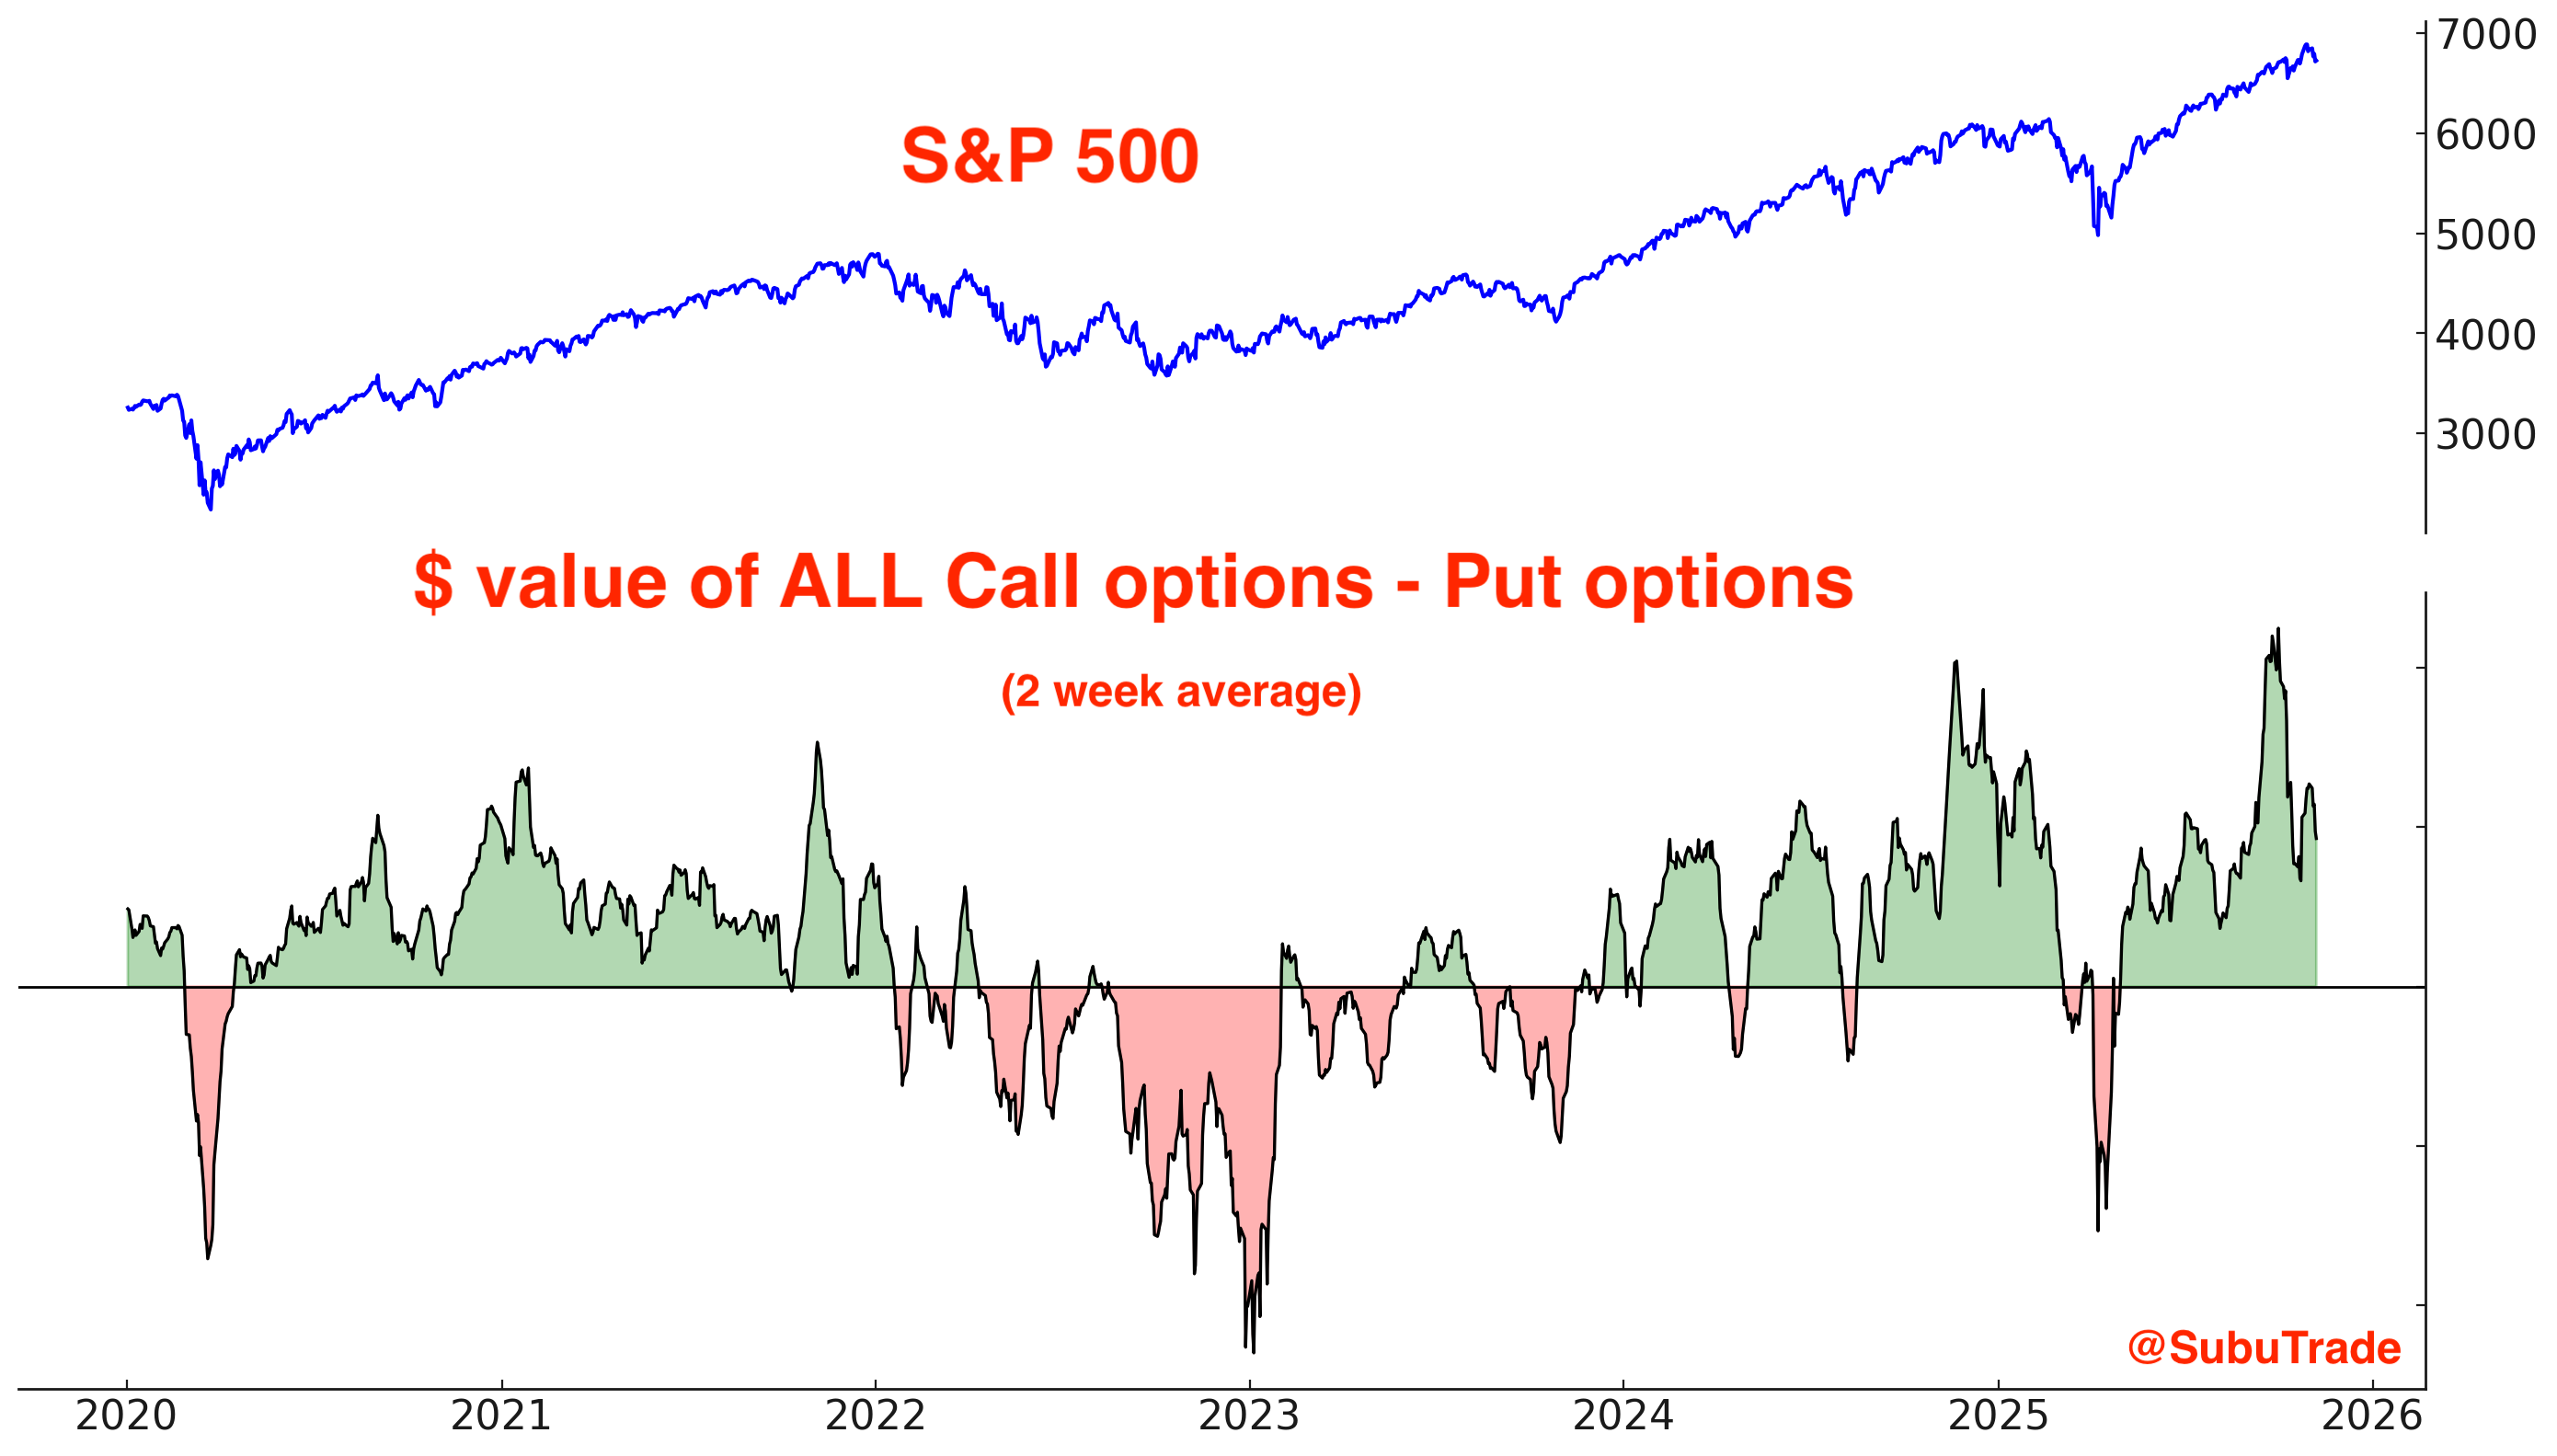
The $ value of ALL call options - put options is also back to more normal levels:
Sentiment
Sentiment is mixed.
The CNN Fear & Greed Index is in “extreme fear” territory. This indicator is widely circulated on Twitter/X:
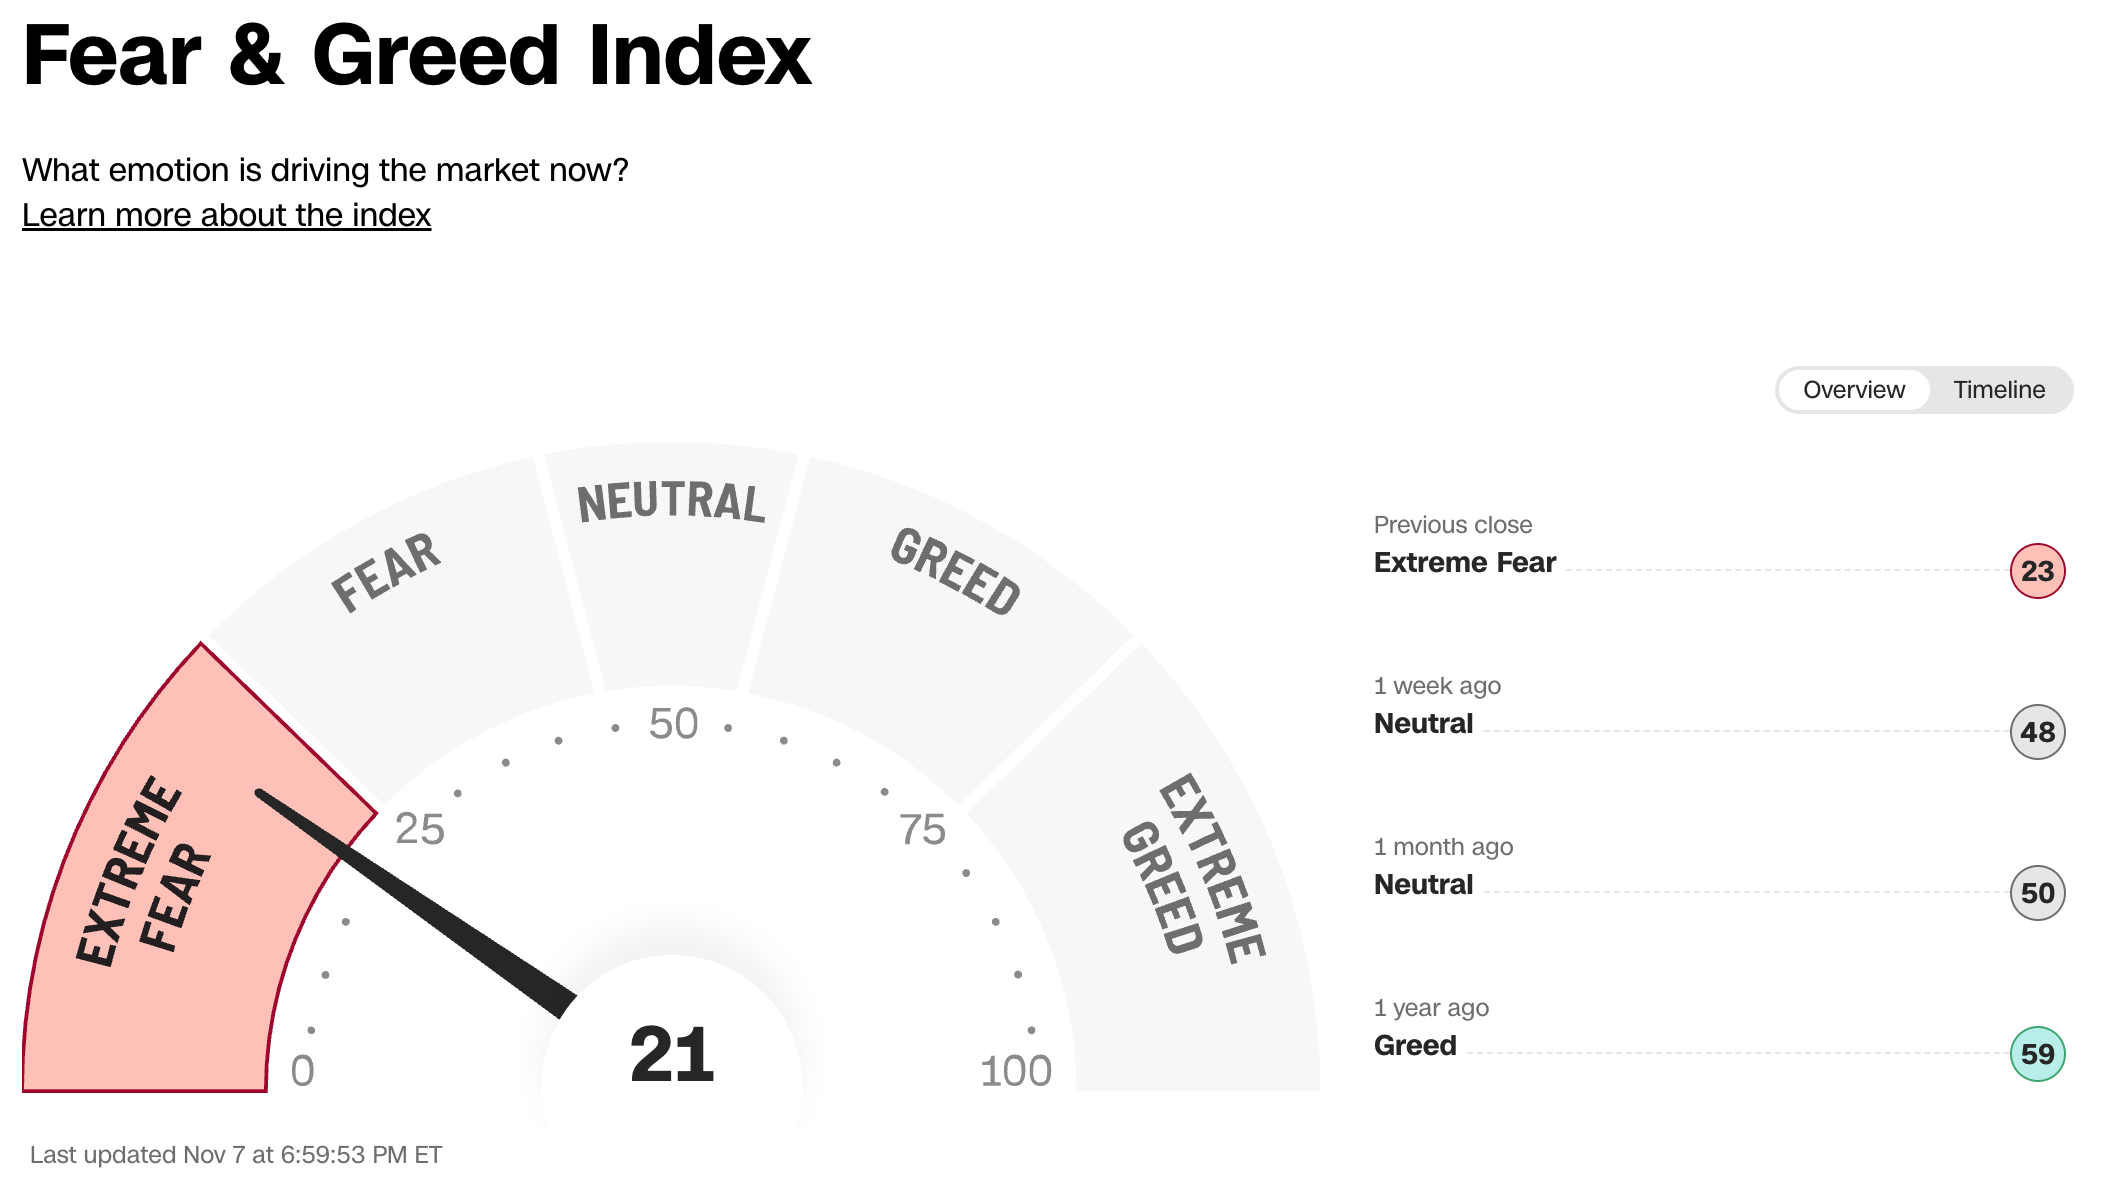
But popularity ≠ usefulness.

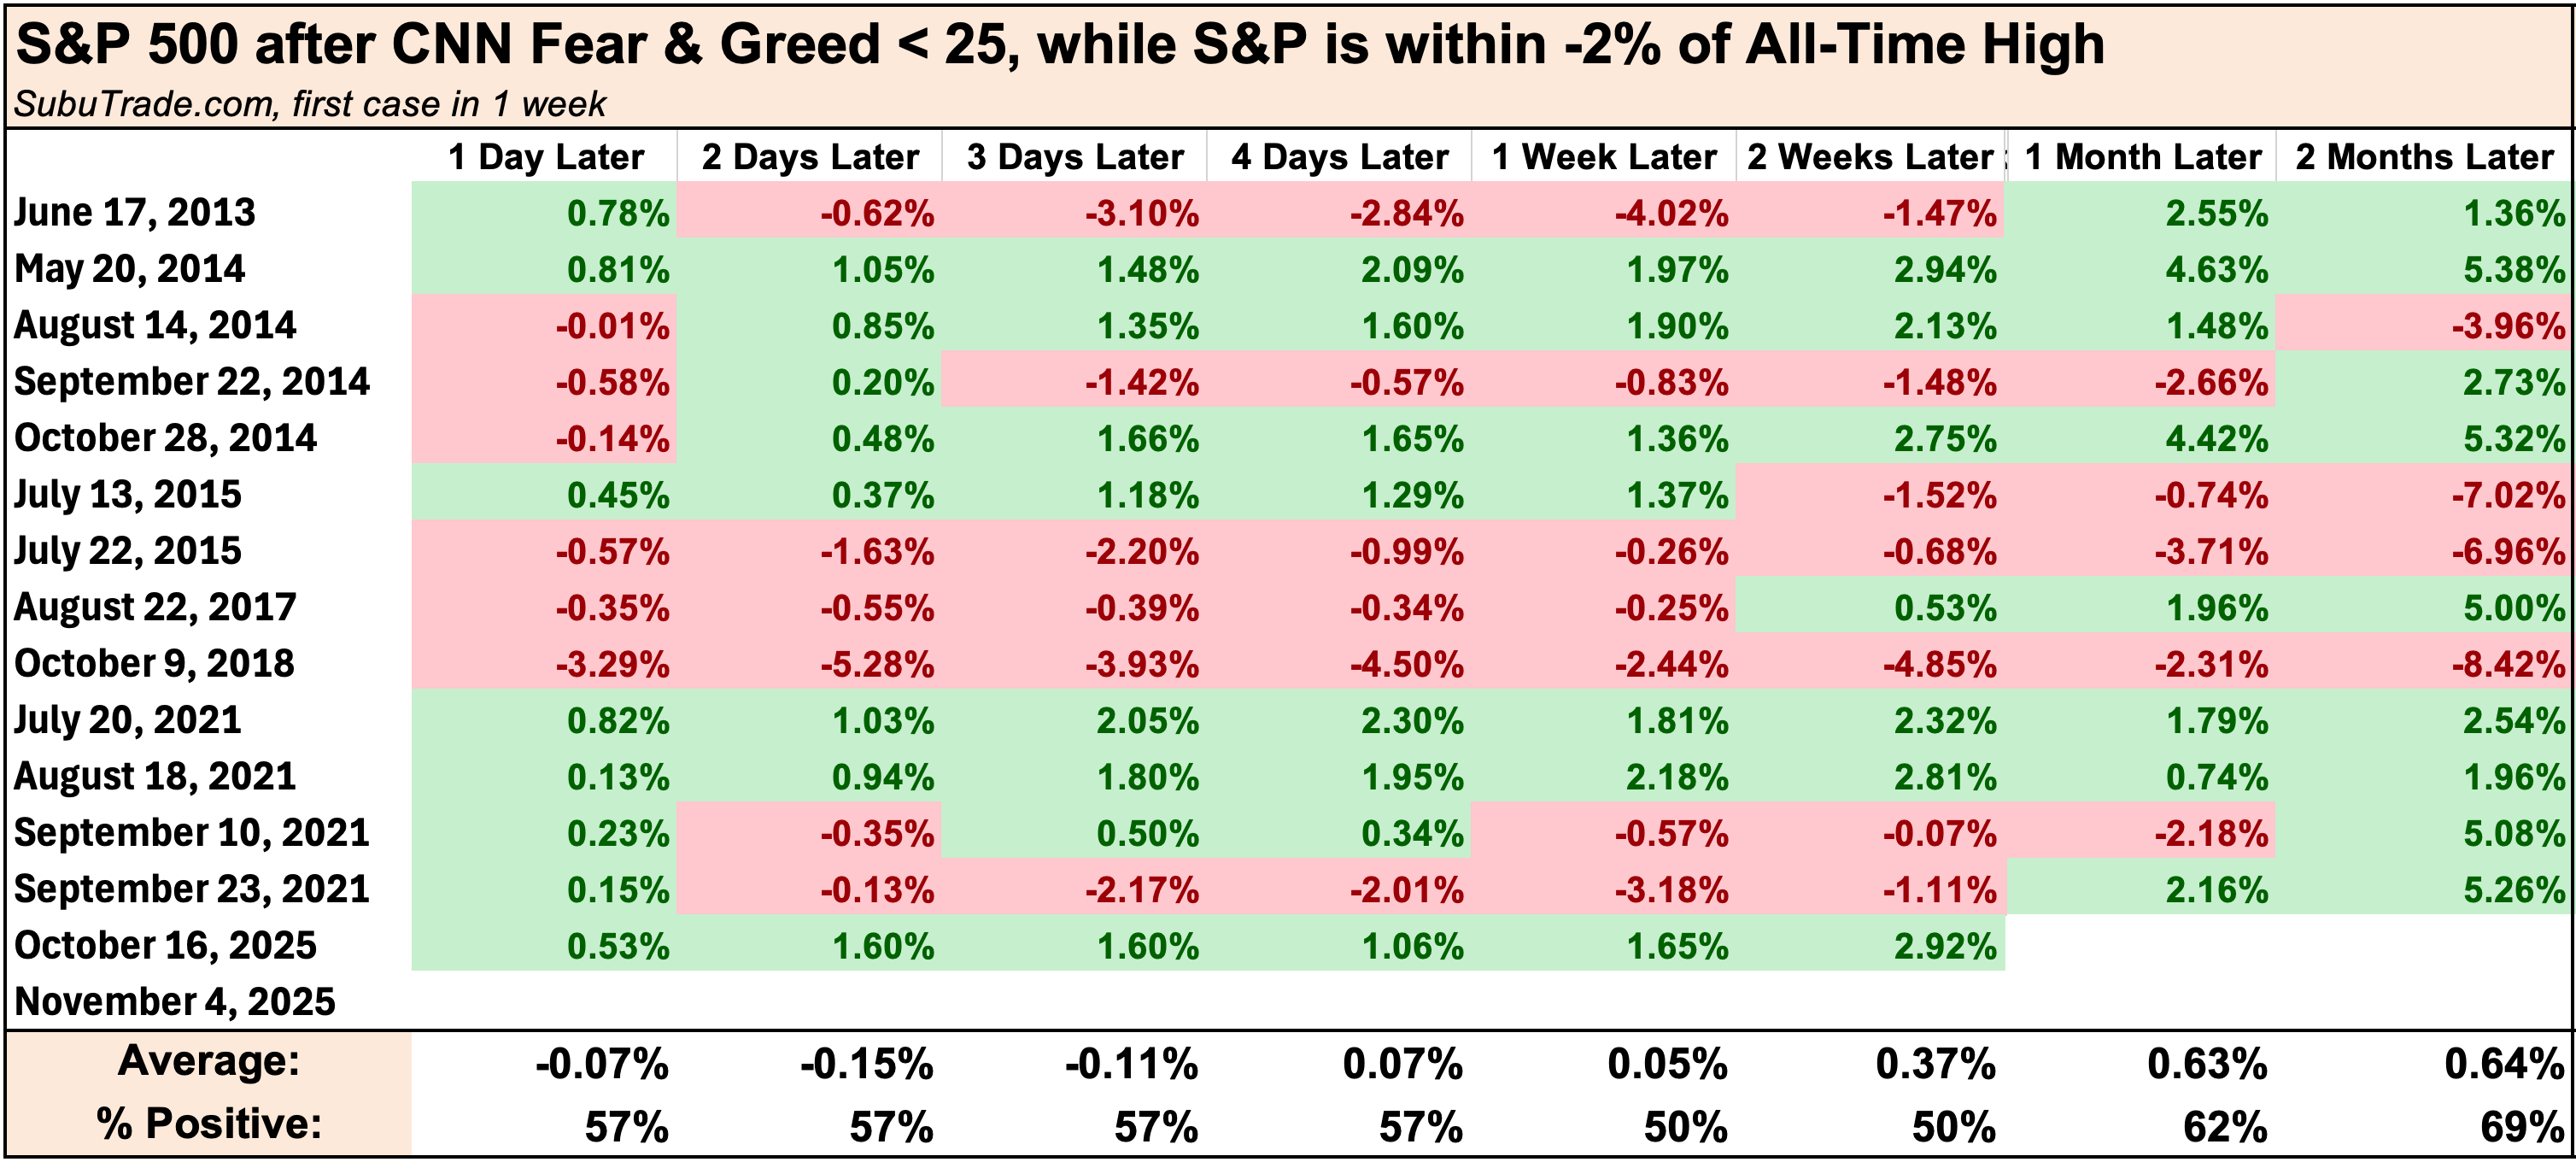
Objectively, CNN Fear & Greed’s ability to accurately call the bottom is not much better than a coin toss (50/50). This doesn’t mean that markets can’t bottom here. It means that if markets do bottom here, it won’t be because “CNN FEAR & GREED IS NOW SHOWING EXTREME FEAR”
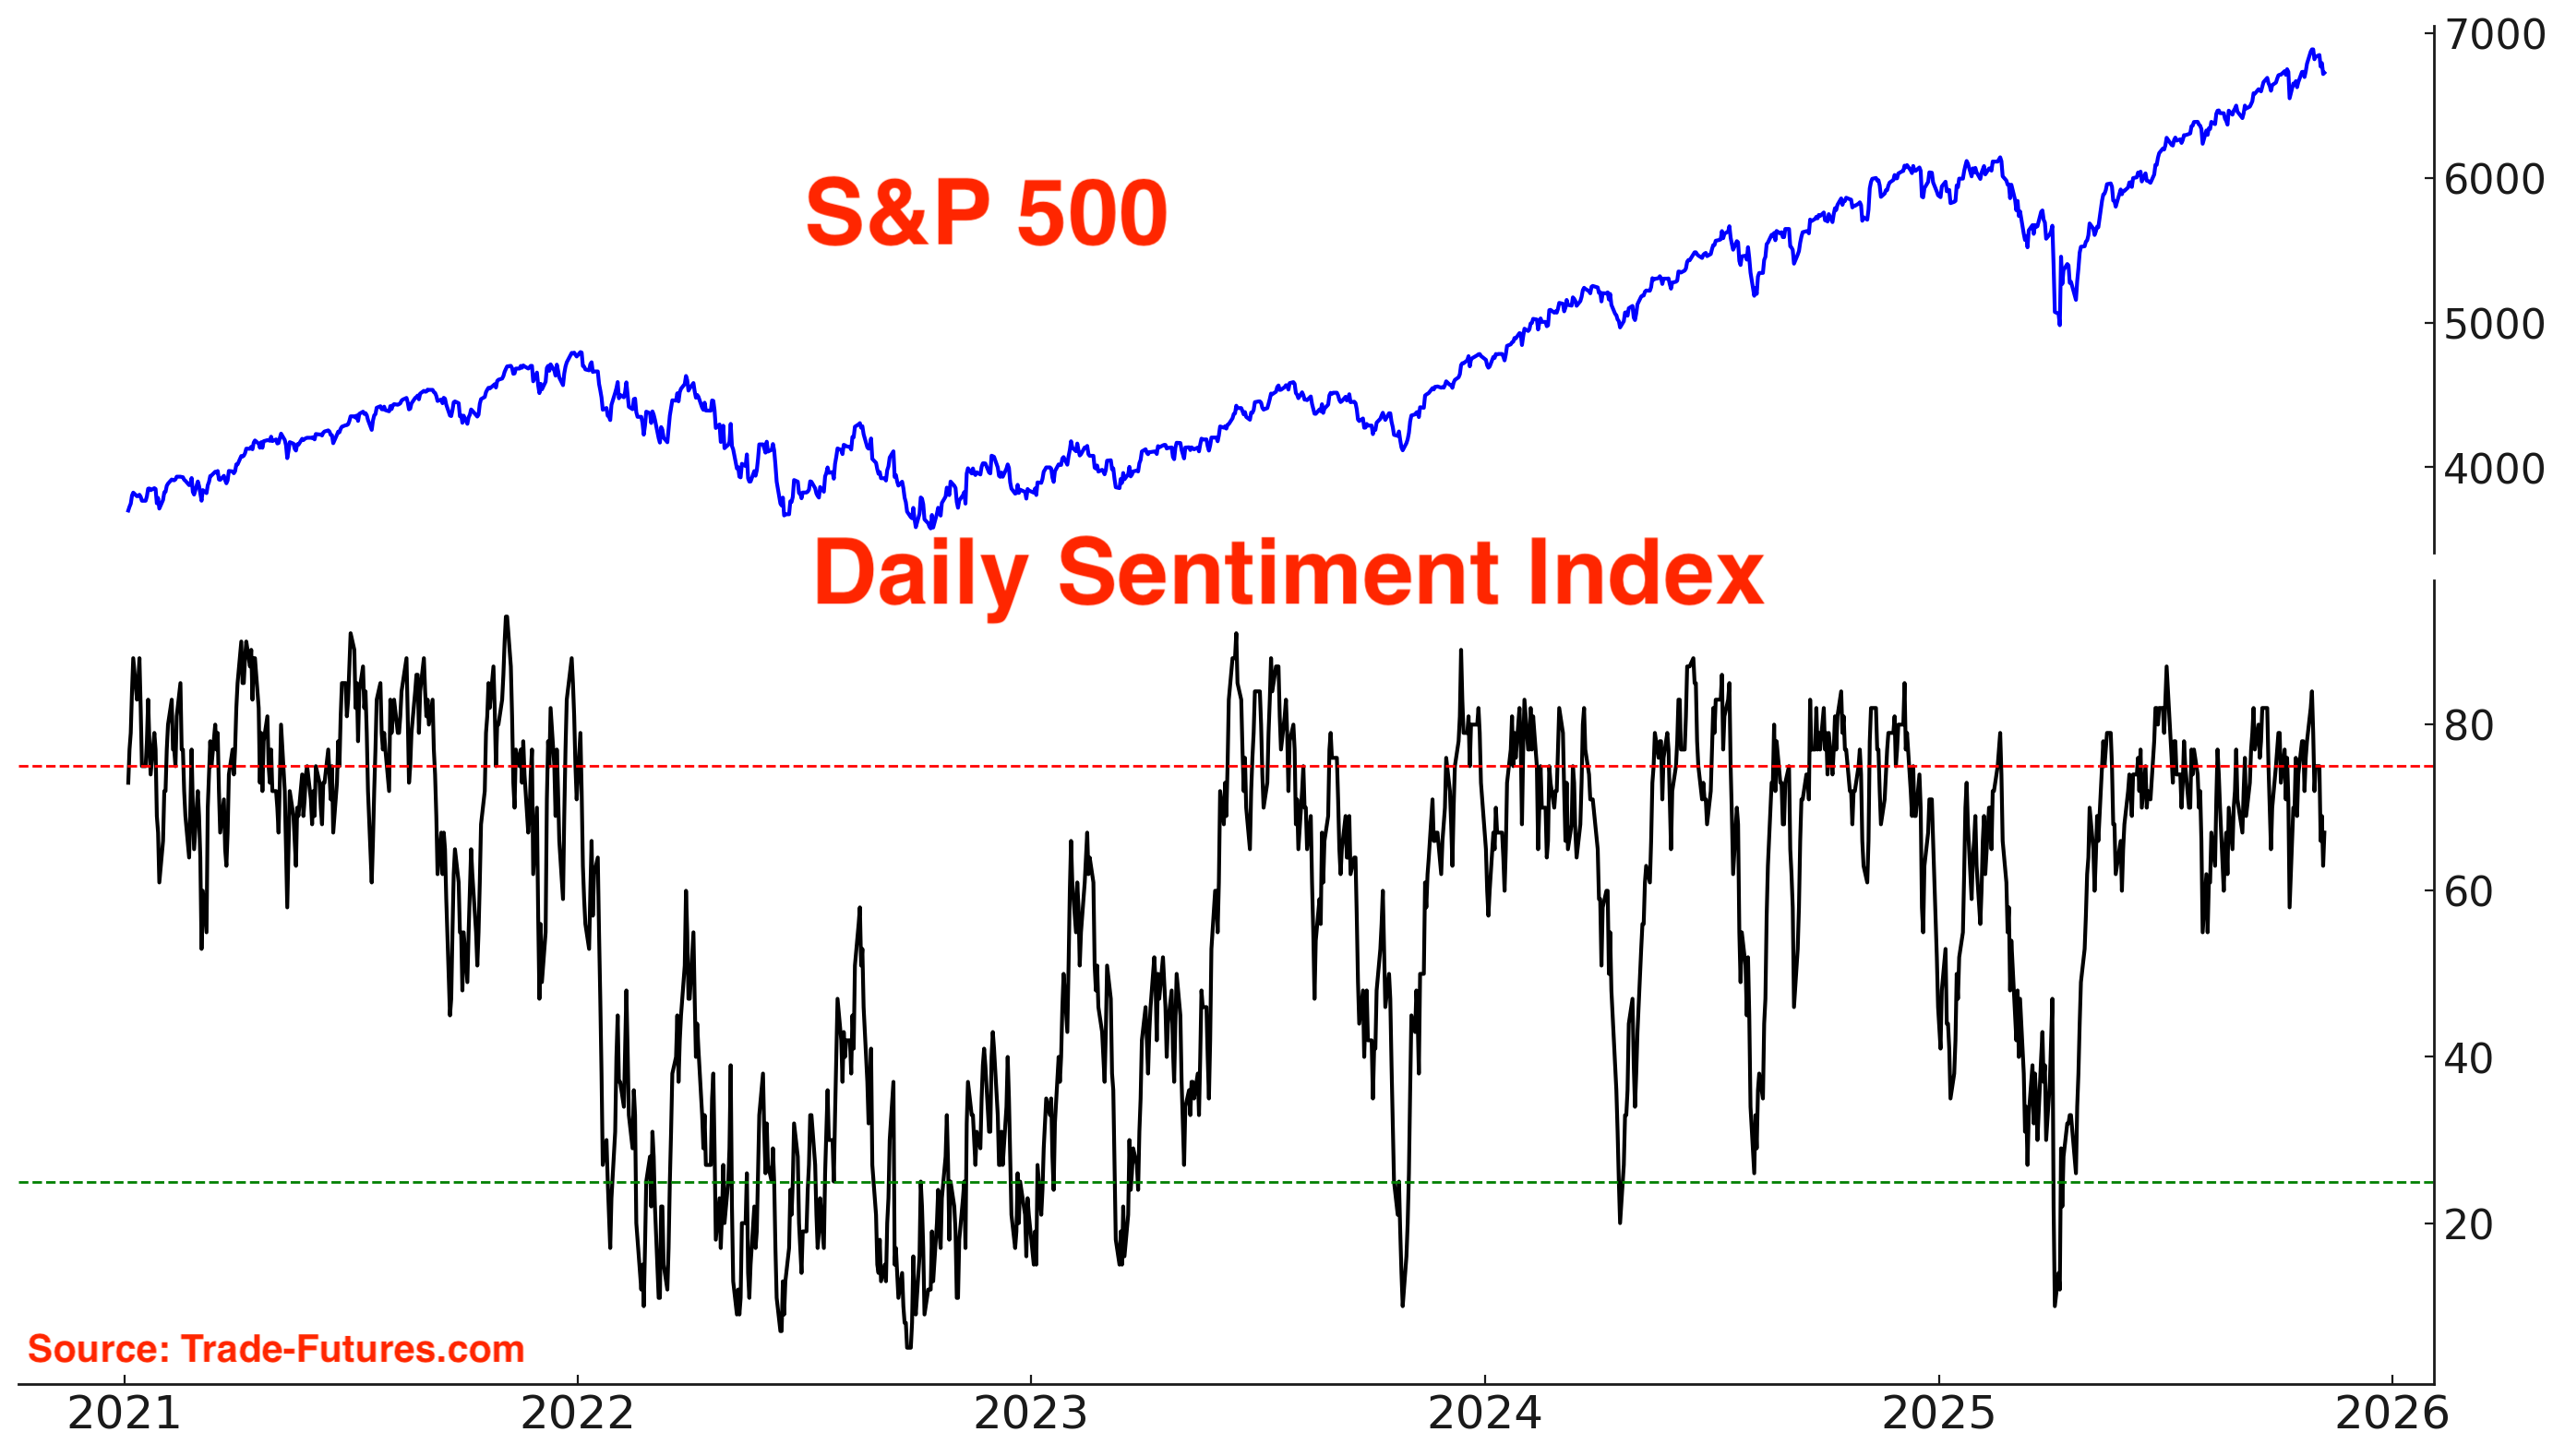
The S&P 500’s Daily Sentiment Index is still elevated:
Sentiment Surveys
Sentiment according to the AAII survey is neutral. The AAII sentiment survey has been consistently less bullish than other sentiment surveys during this entire rally:

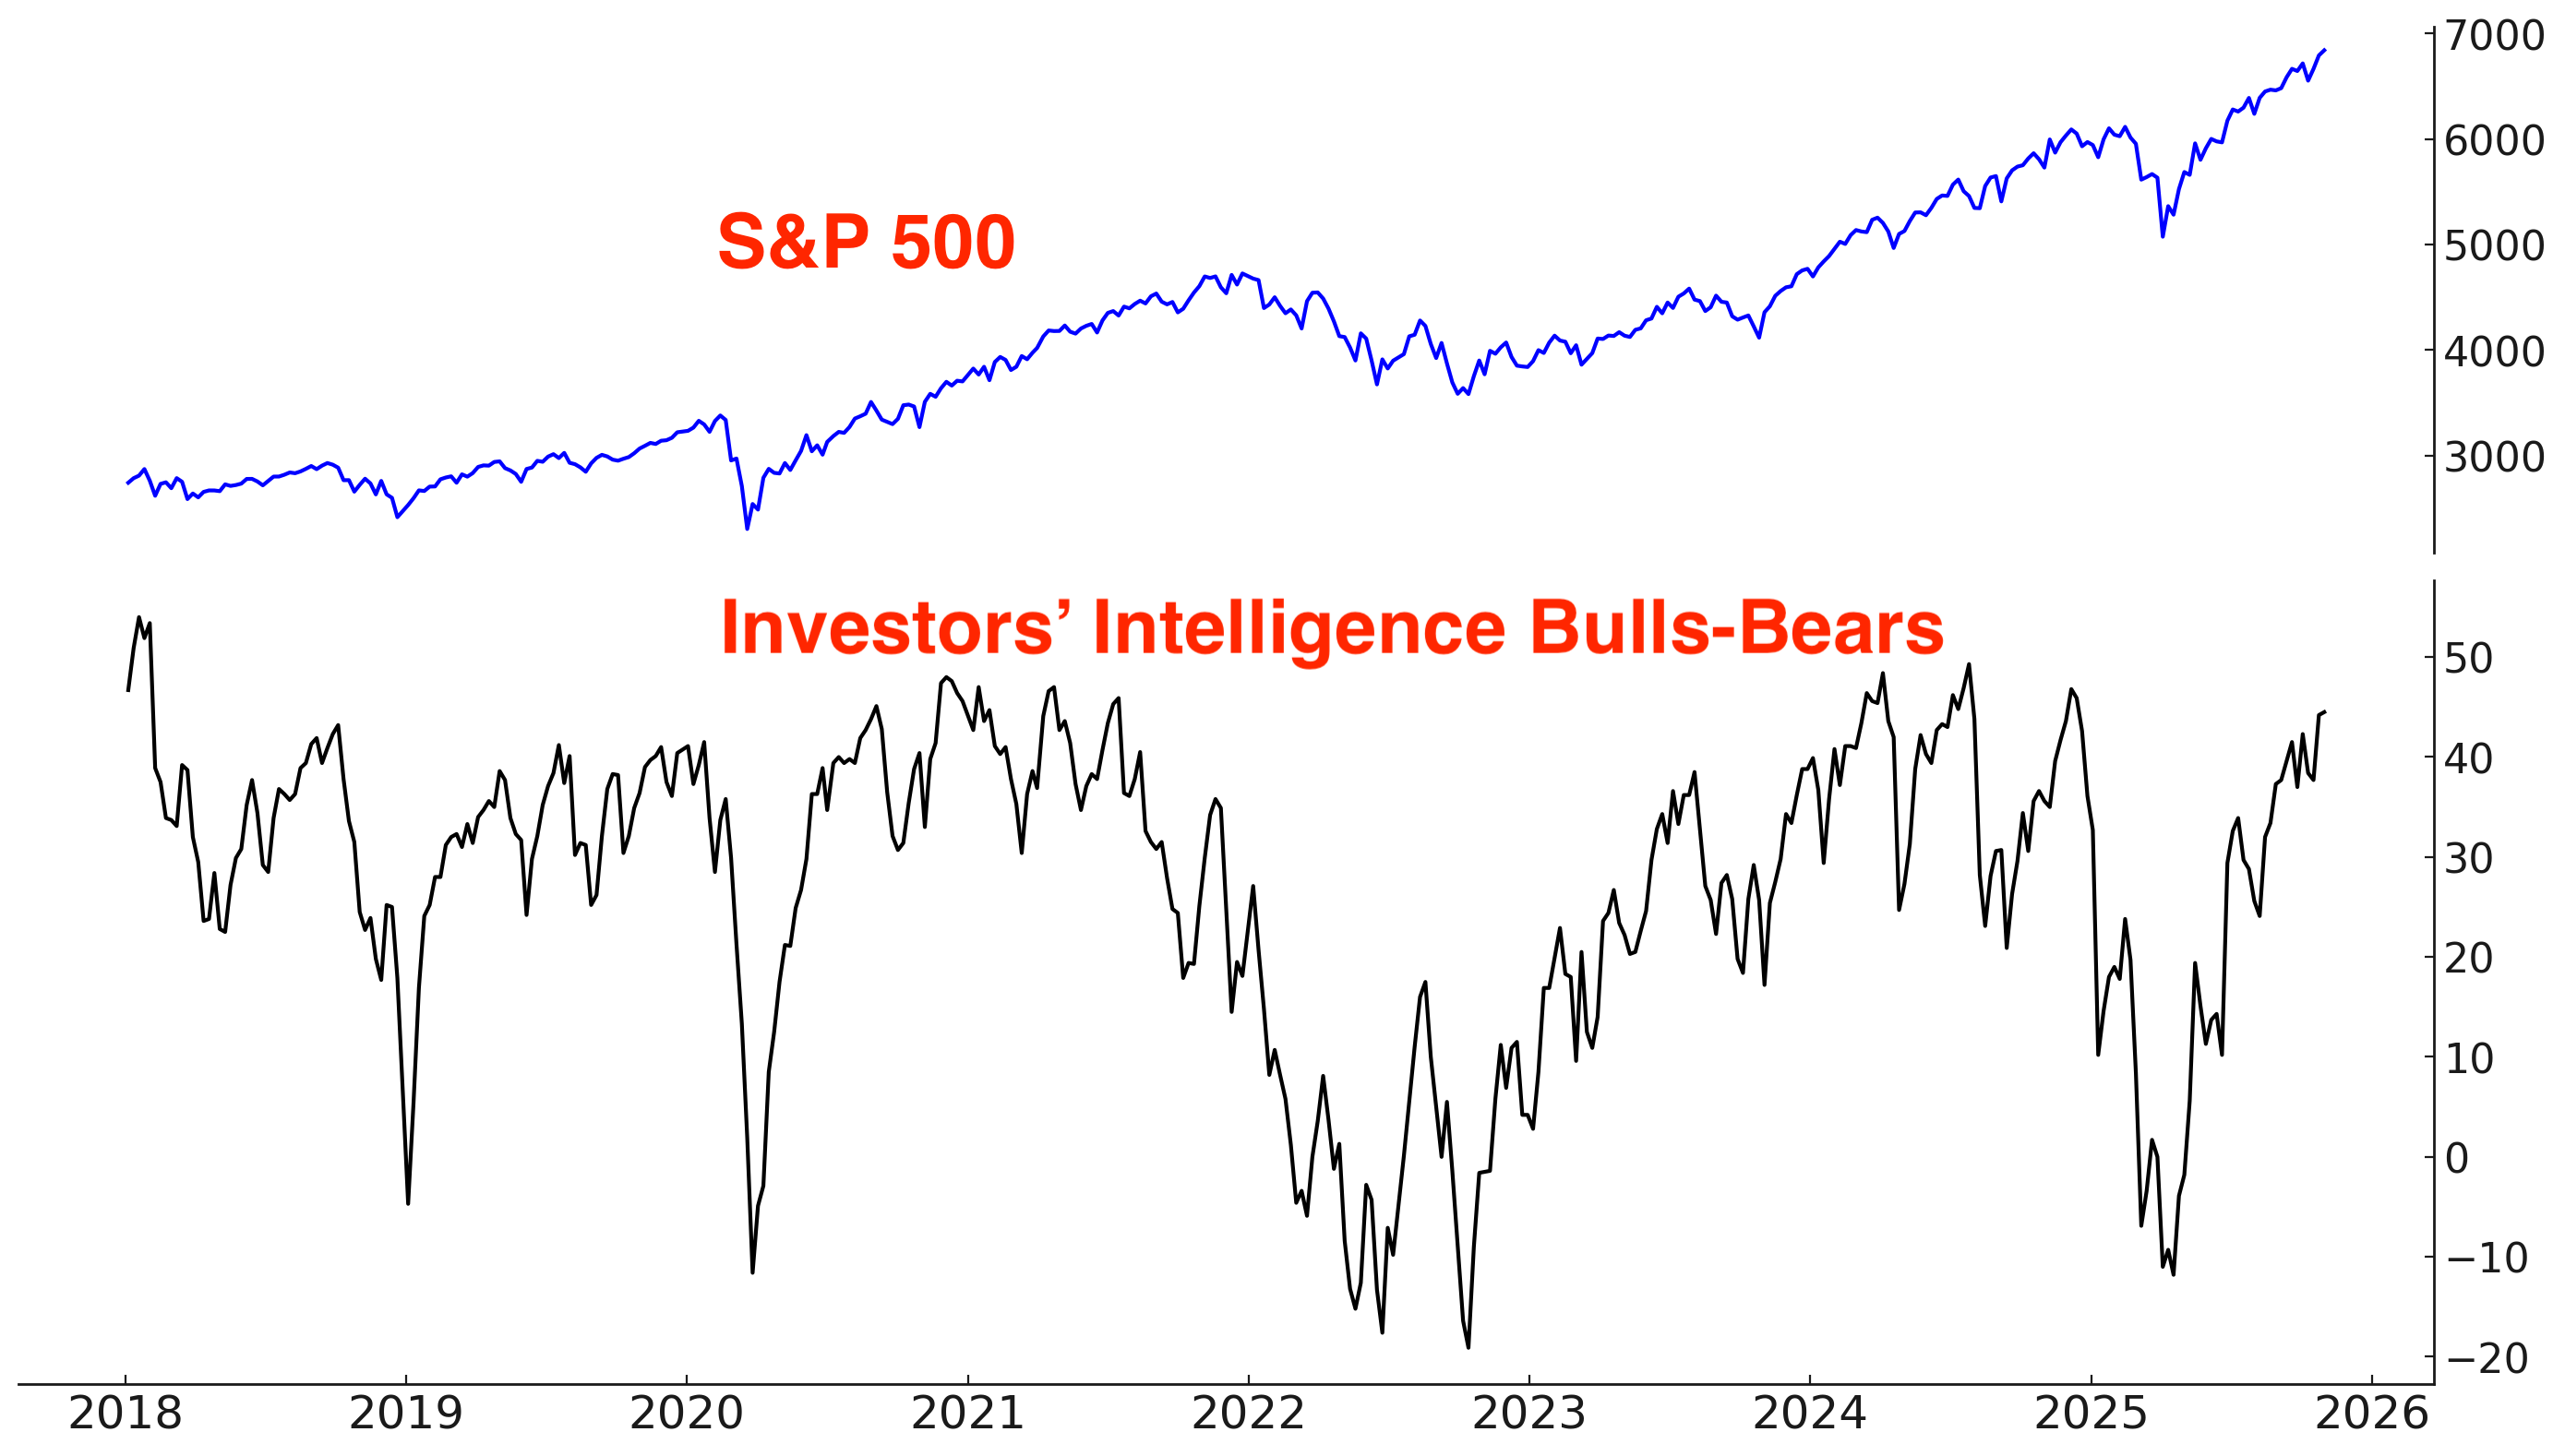
According to the Investors Intelligence report, newsletter writers are bullish:
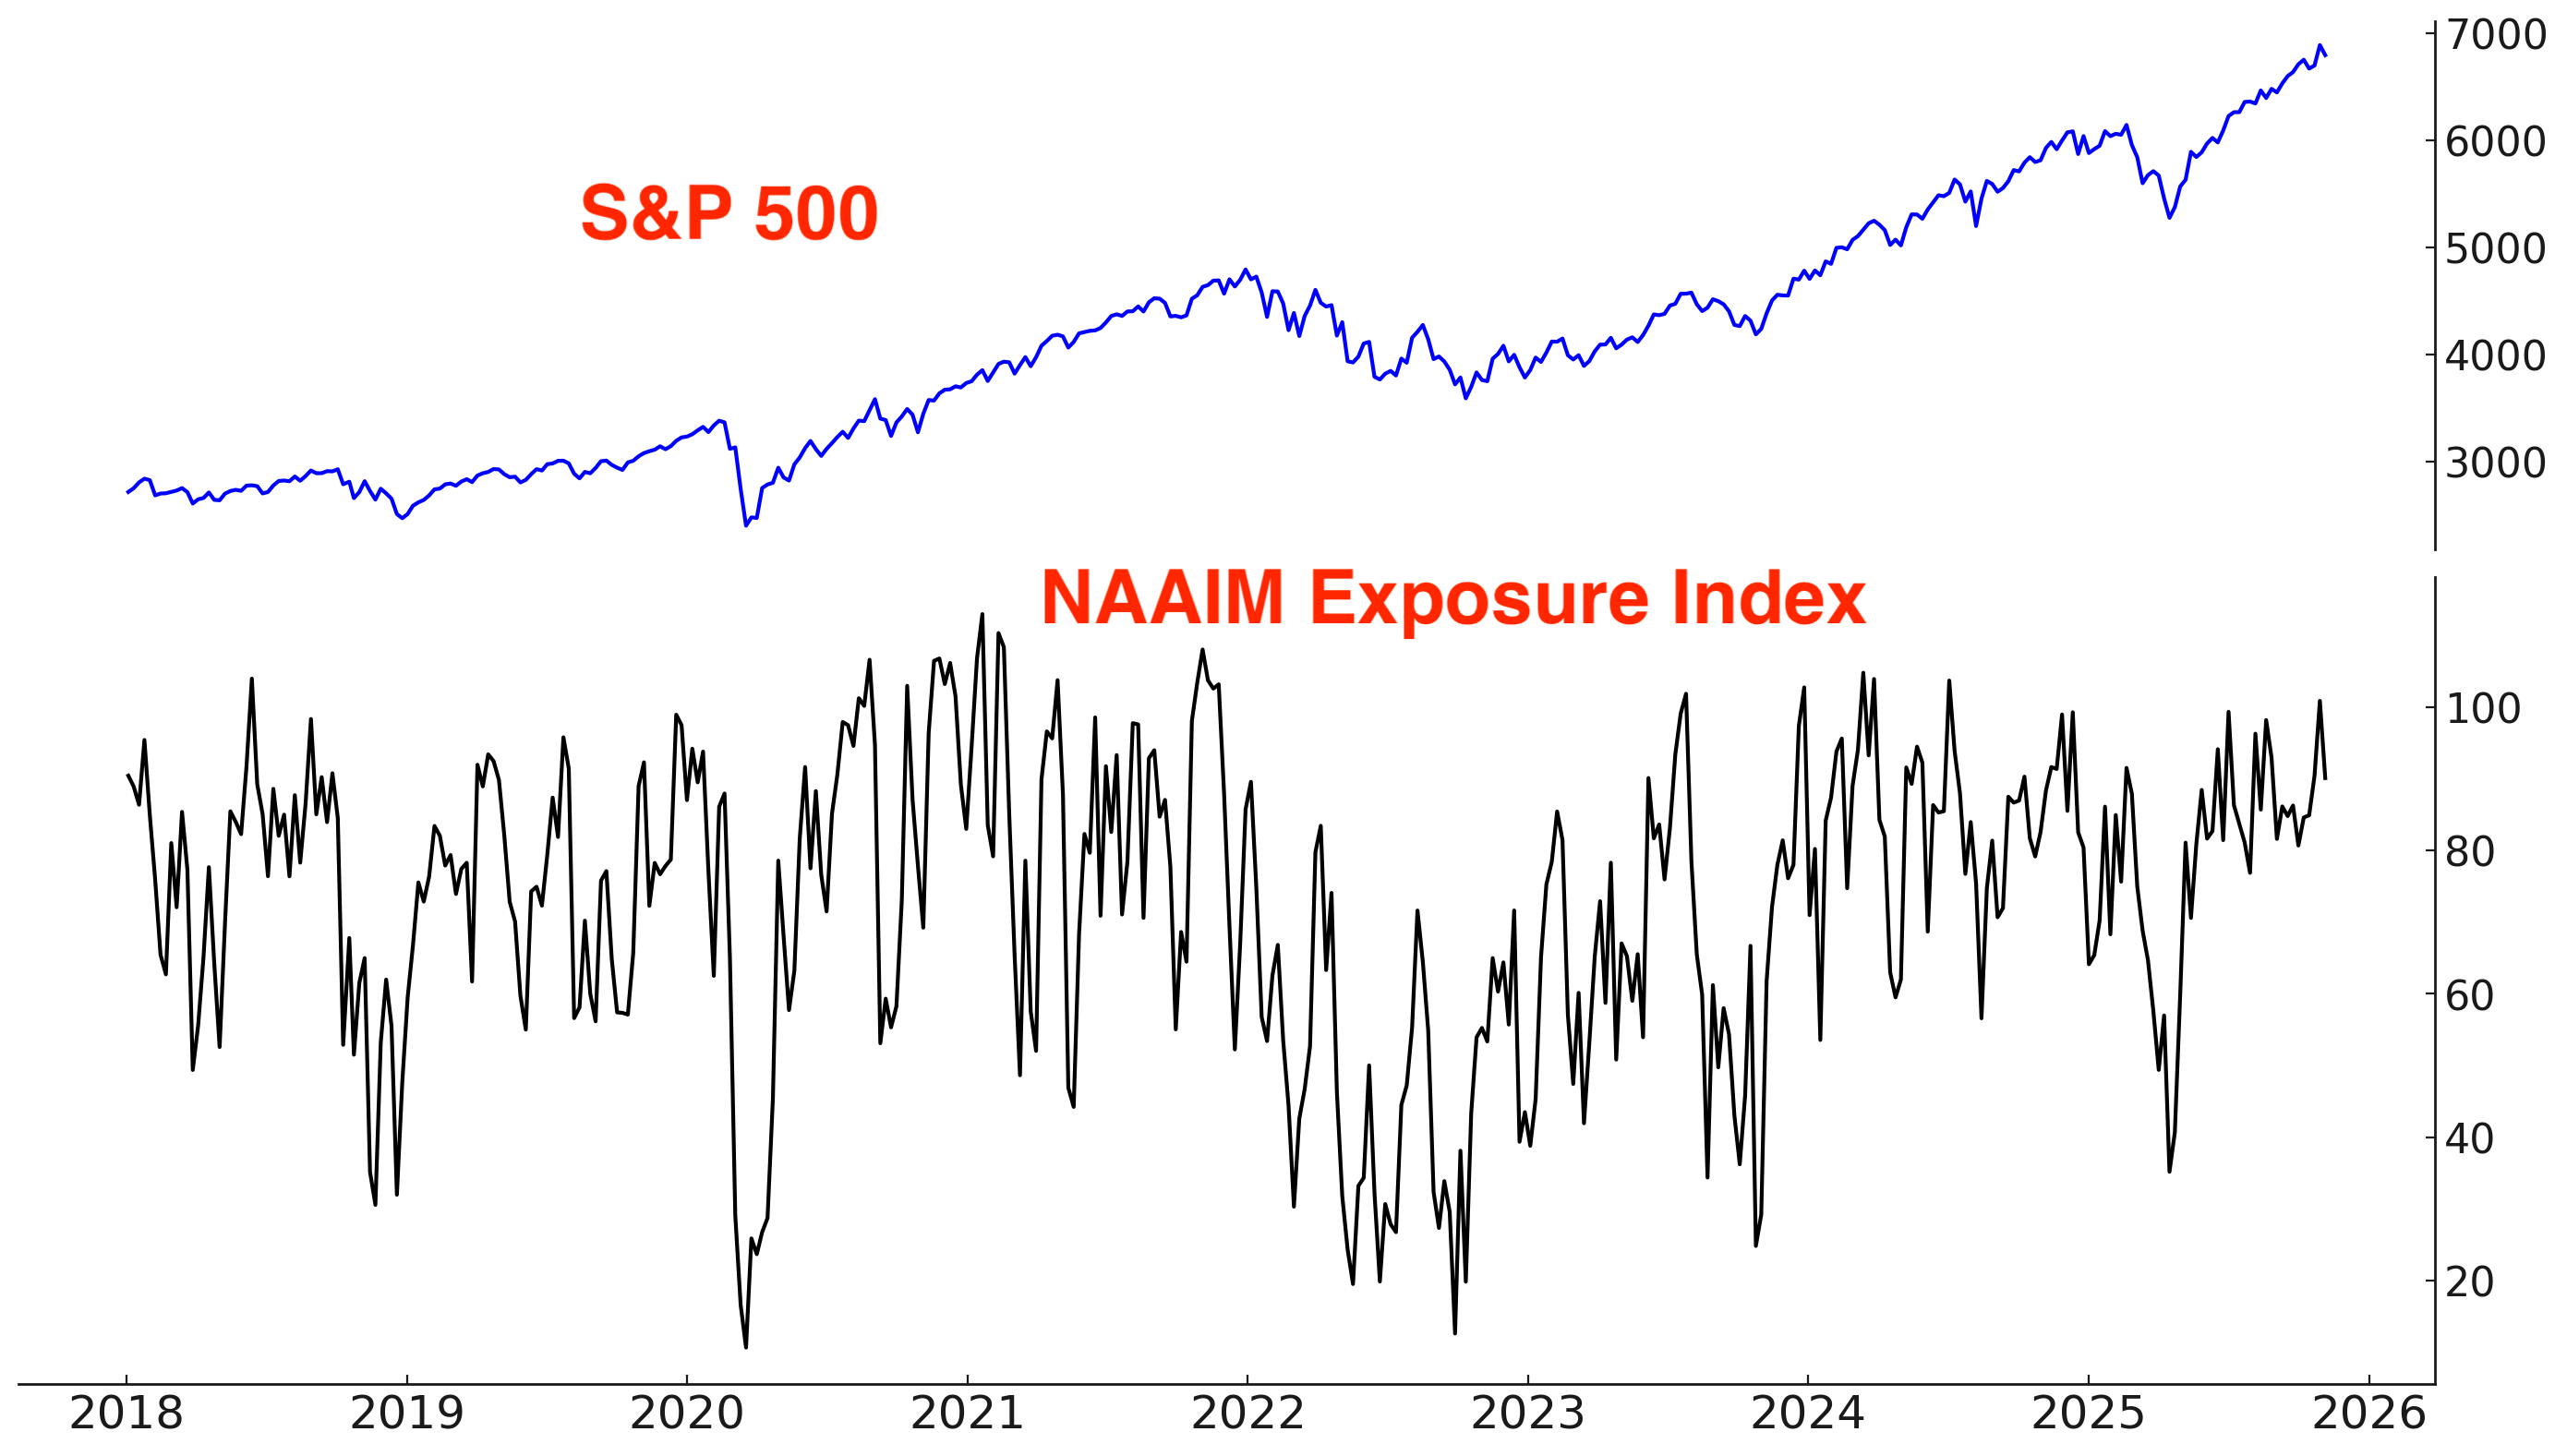
According to the NAAIM Exposure Index, active investment managers are bullish:
Corporate Insiders
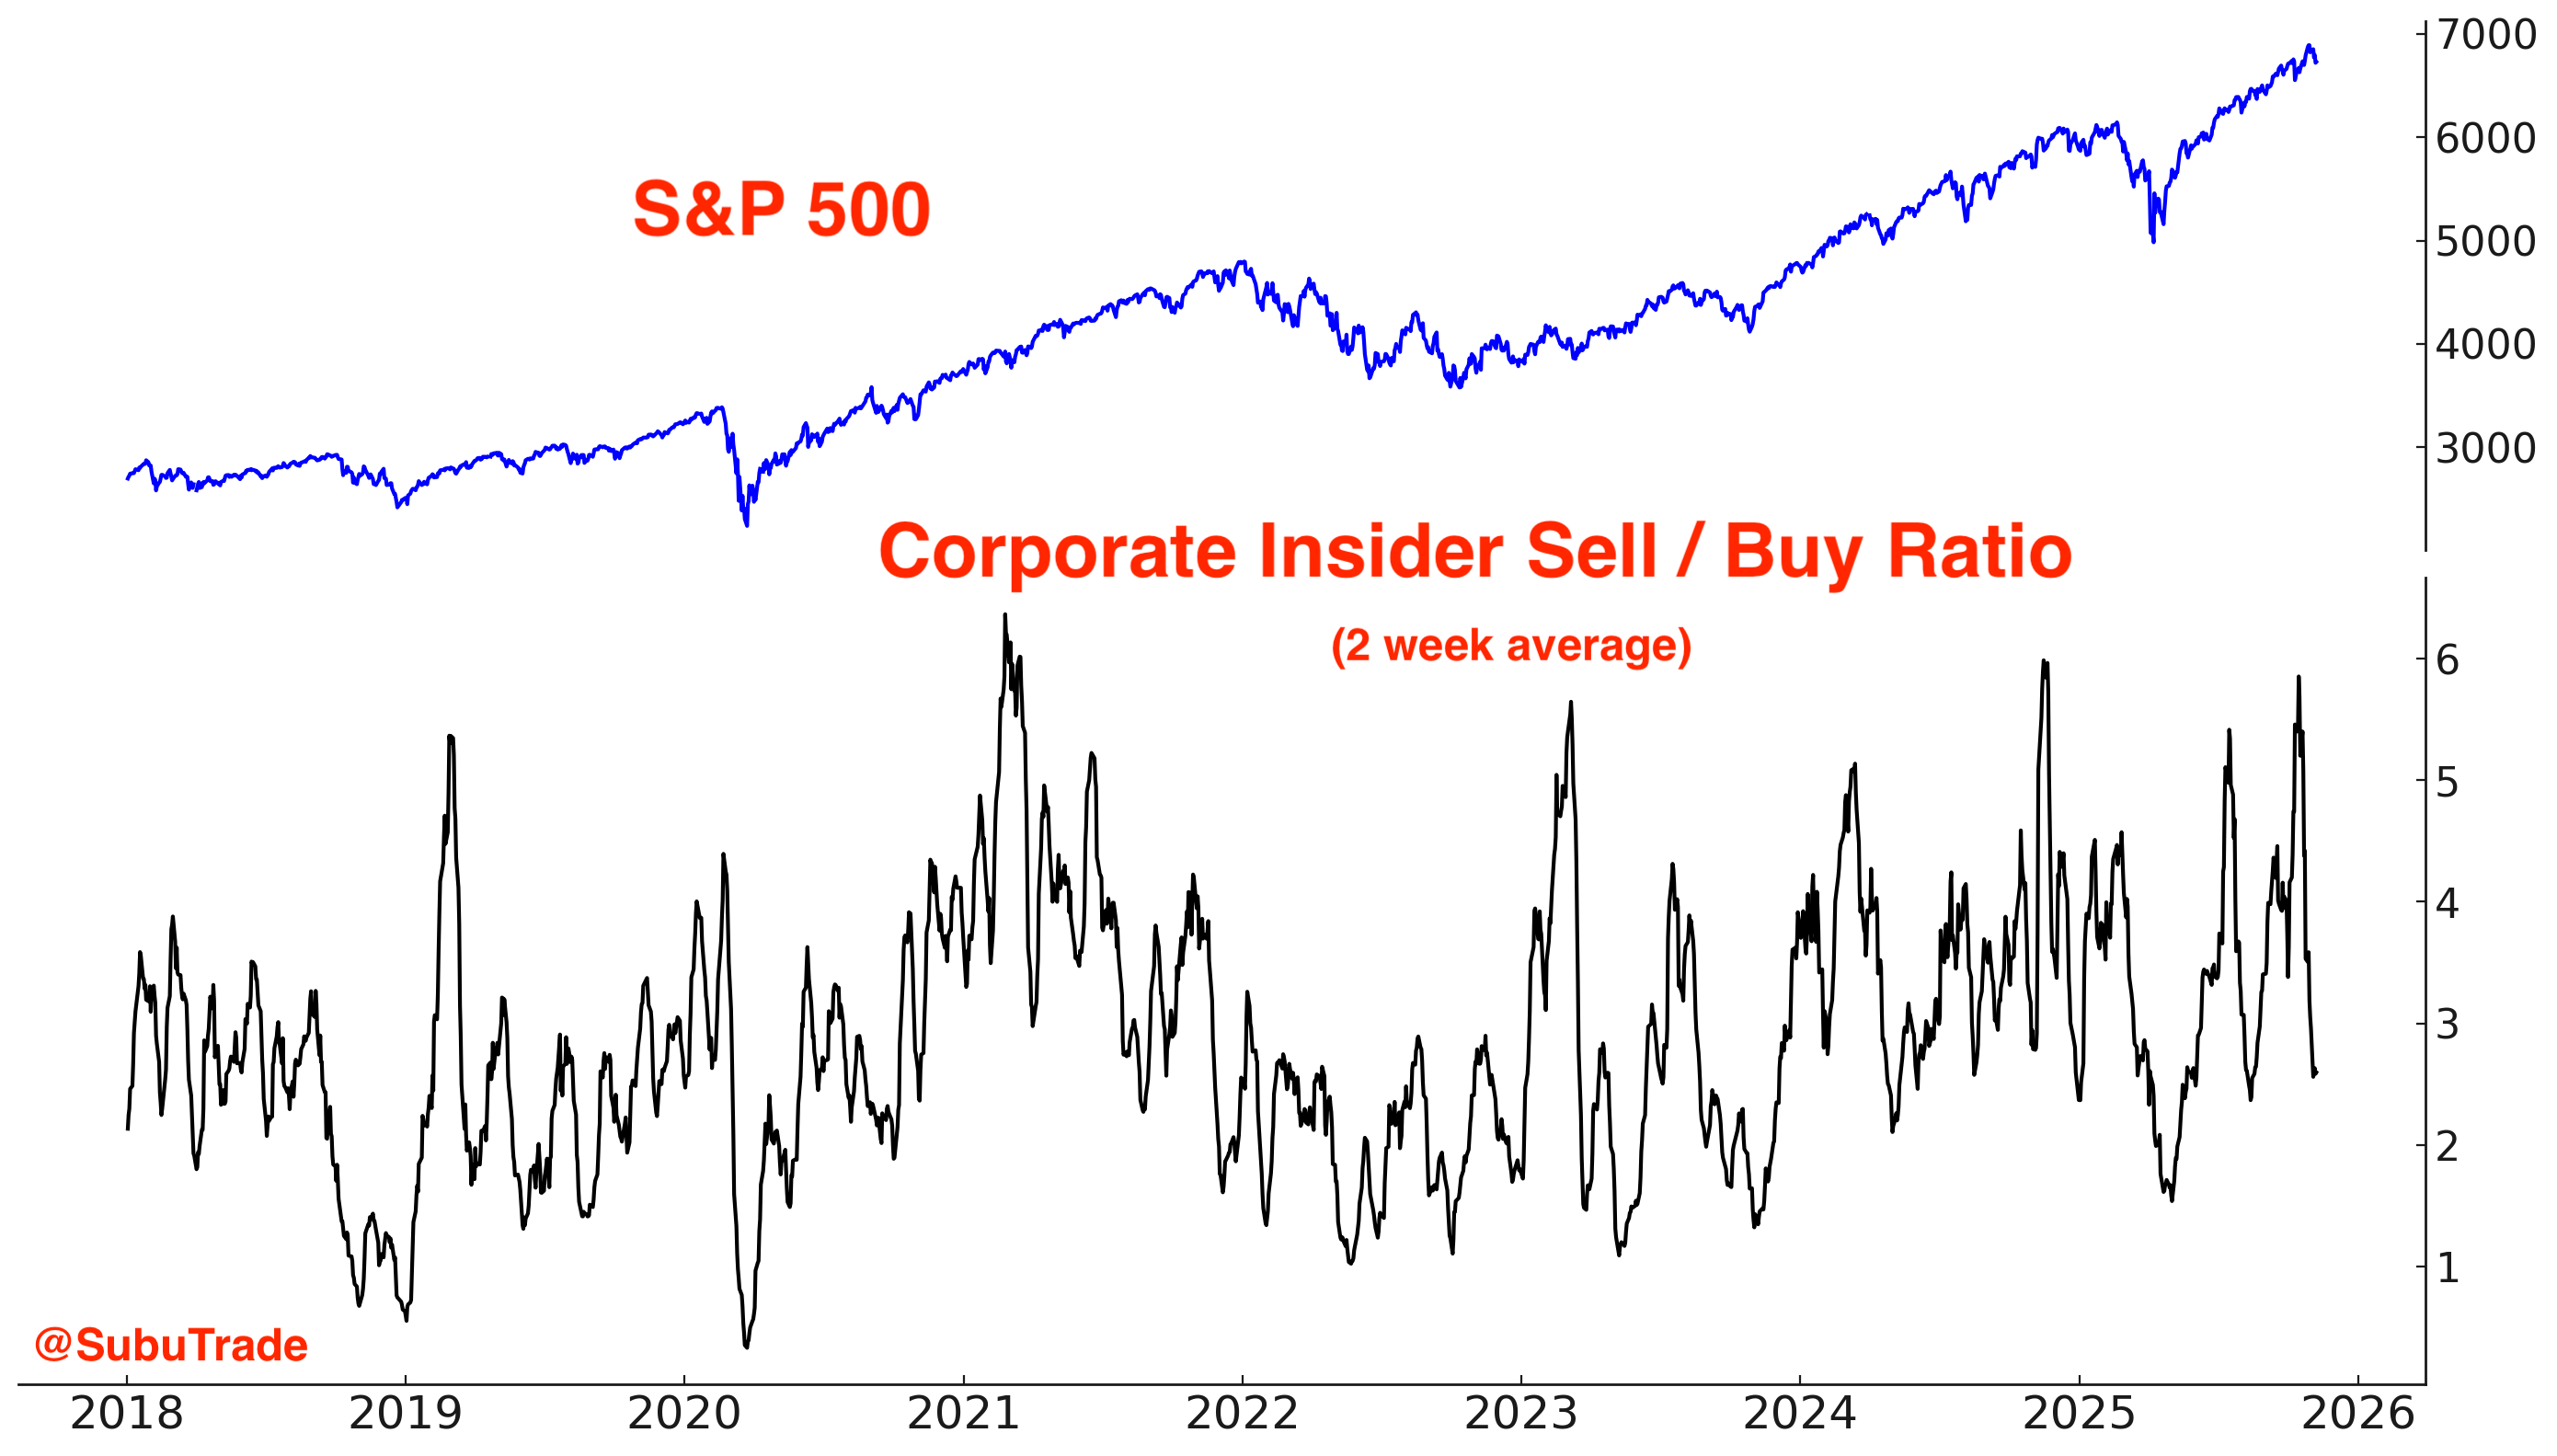
The Corporate Insider Sell/Buy ratio is in neutral territory:
Fund Flows
*Fund flows aren’t automatically contrarian. It depends on what type of trader is buying/selling and why. Some ETFs are traded by mean-reversion traders, while other ETFs are traded by trend followers. Moreover, many ETFs are small relative to the underlying market, so fund flows don’t always reflect broad sentiment towards that market.
The past 2 months have seen a surge of inflows into the 10 largest equity ETFs:

TQQQ (3x NASDAQ leveraged ETF) is traded by mean reversion traders. TQQQ traders are contrarian (buy the dip, sell the rip).
Due to the market’s recent bout of weakness, TQQQ traders are starting to buy the dip (inflows):

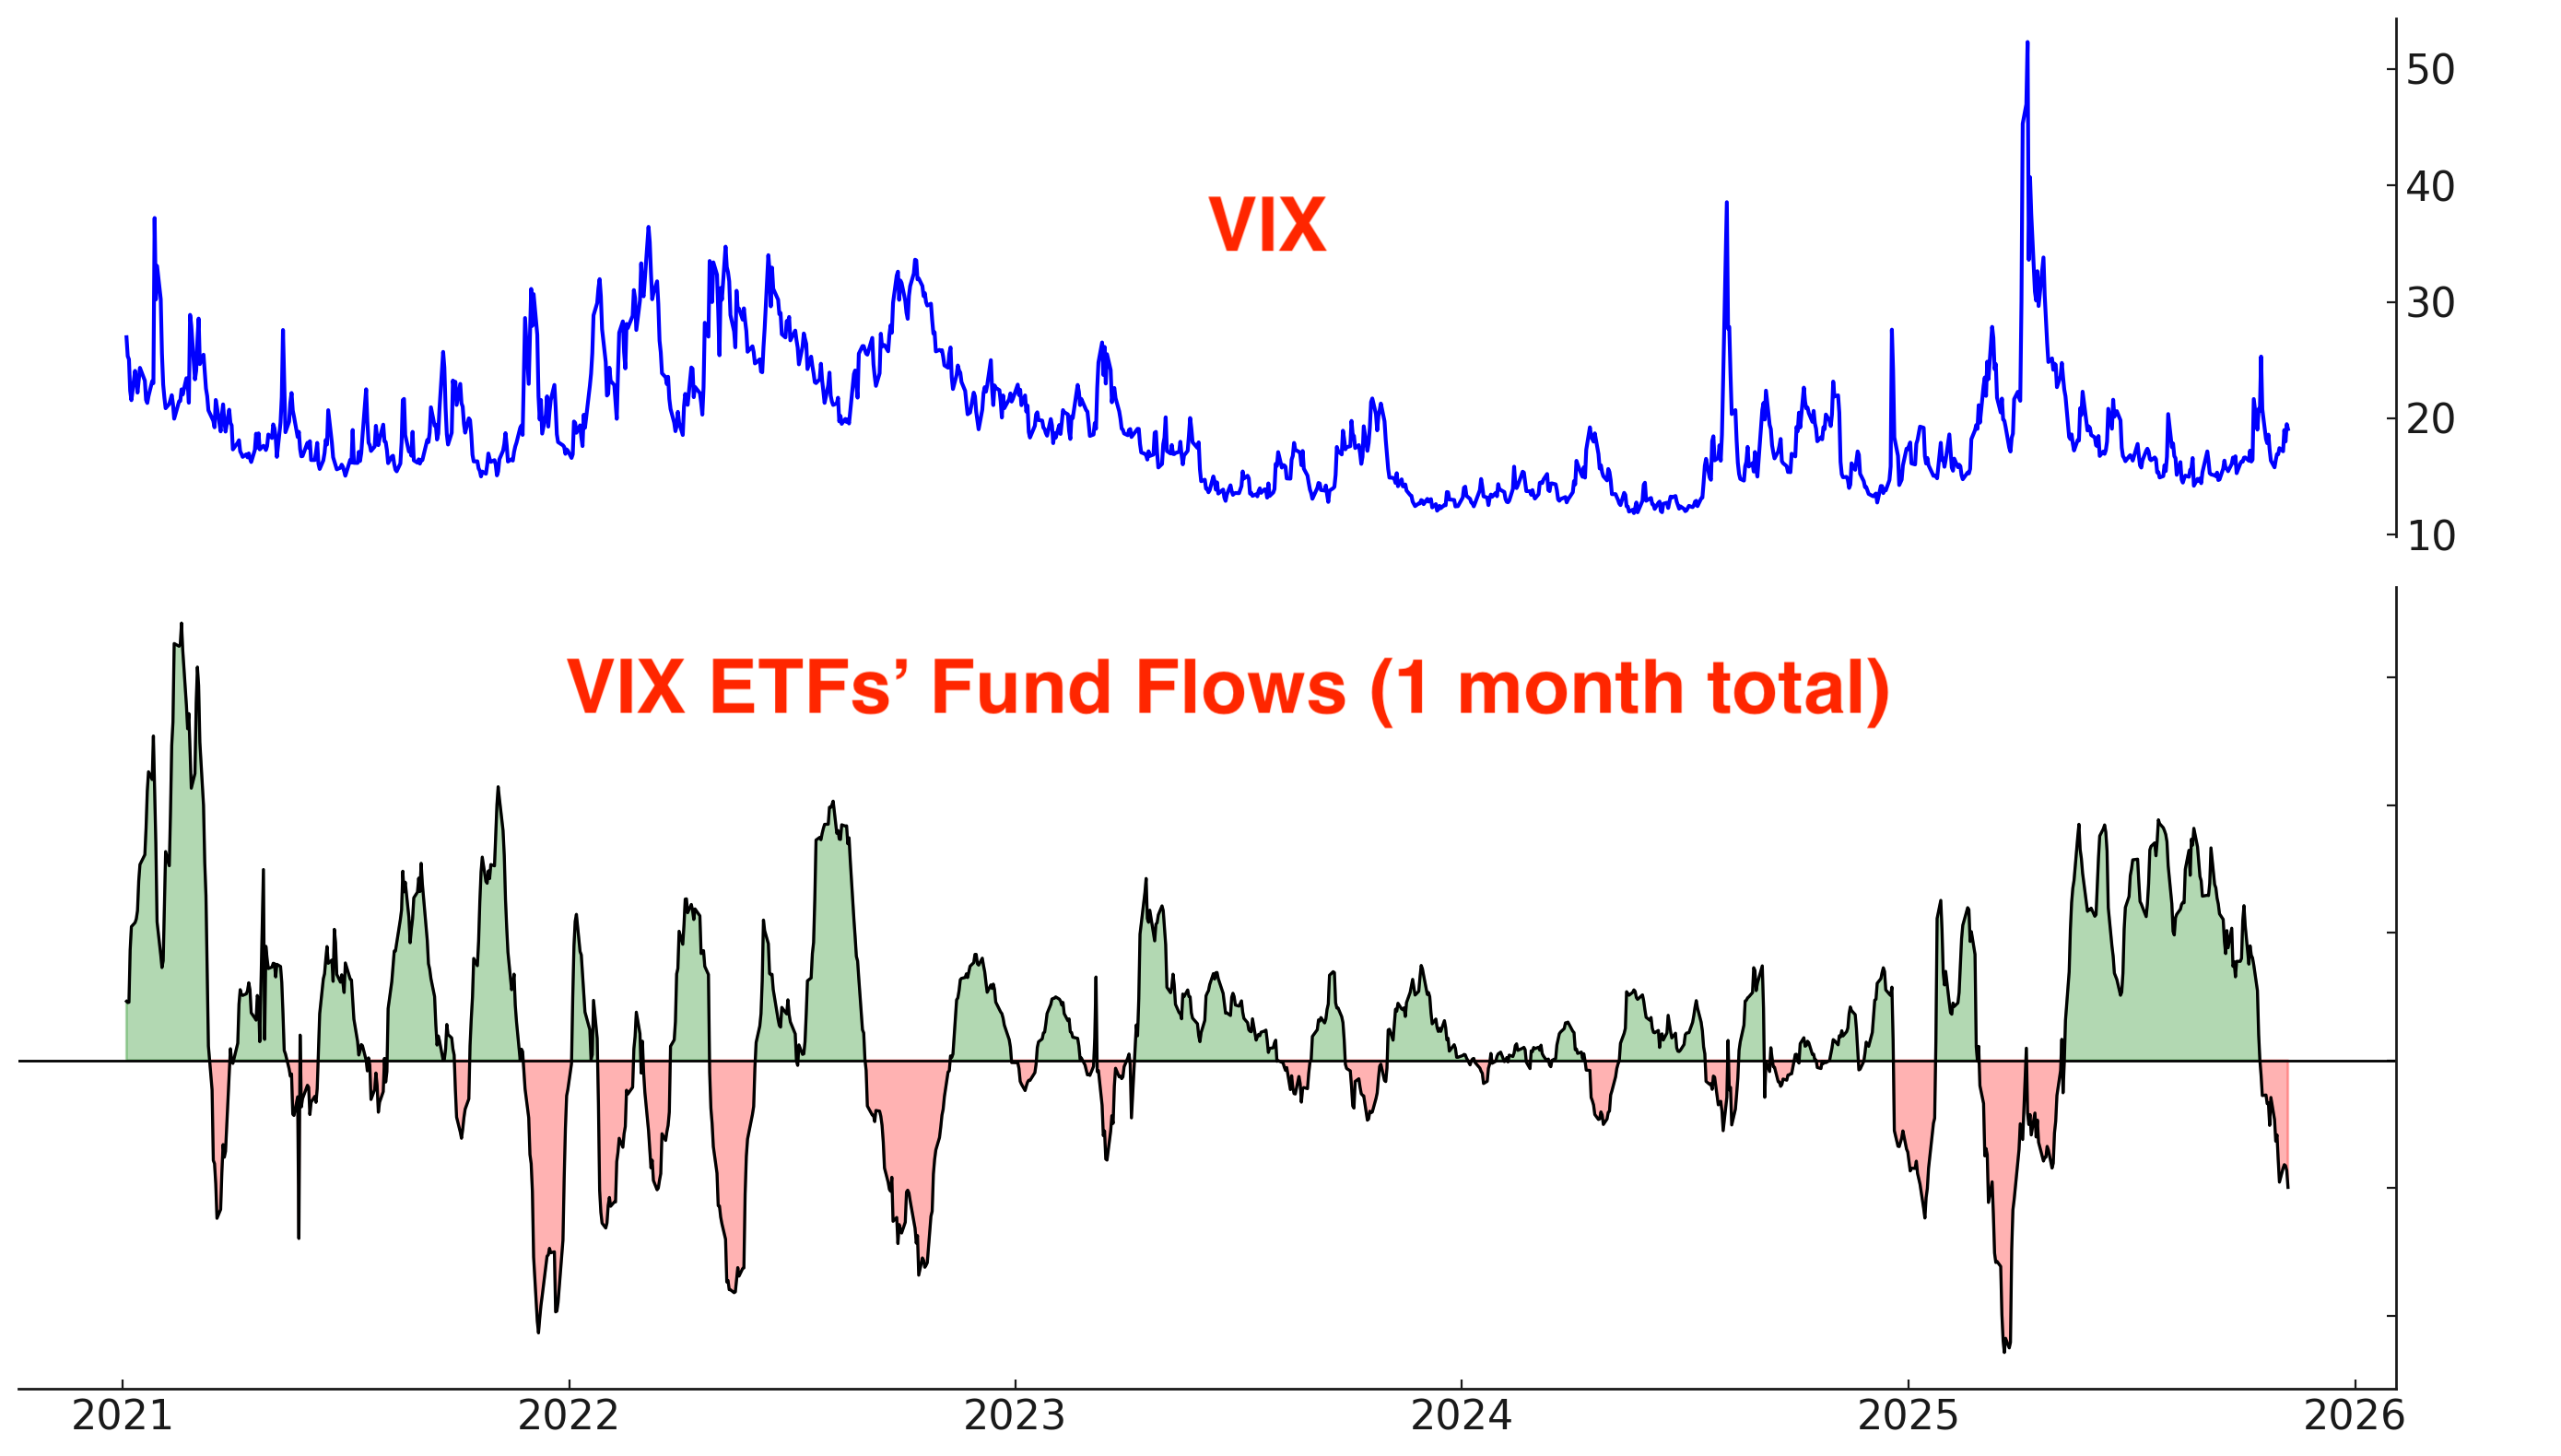
VIX ETFs are traded by mean-reversion traders; they buy when VIX is low and sell (take profits) when VIX is high.
VIX ETFs are seeing outflows as traders take profits on their long-VIX ETF positions:
Breadth
Here are the % of S&P stocks above their 200 and 50 day moving averages:
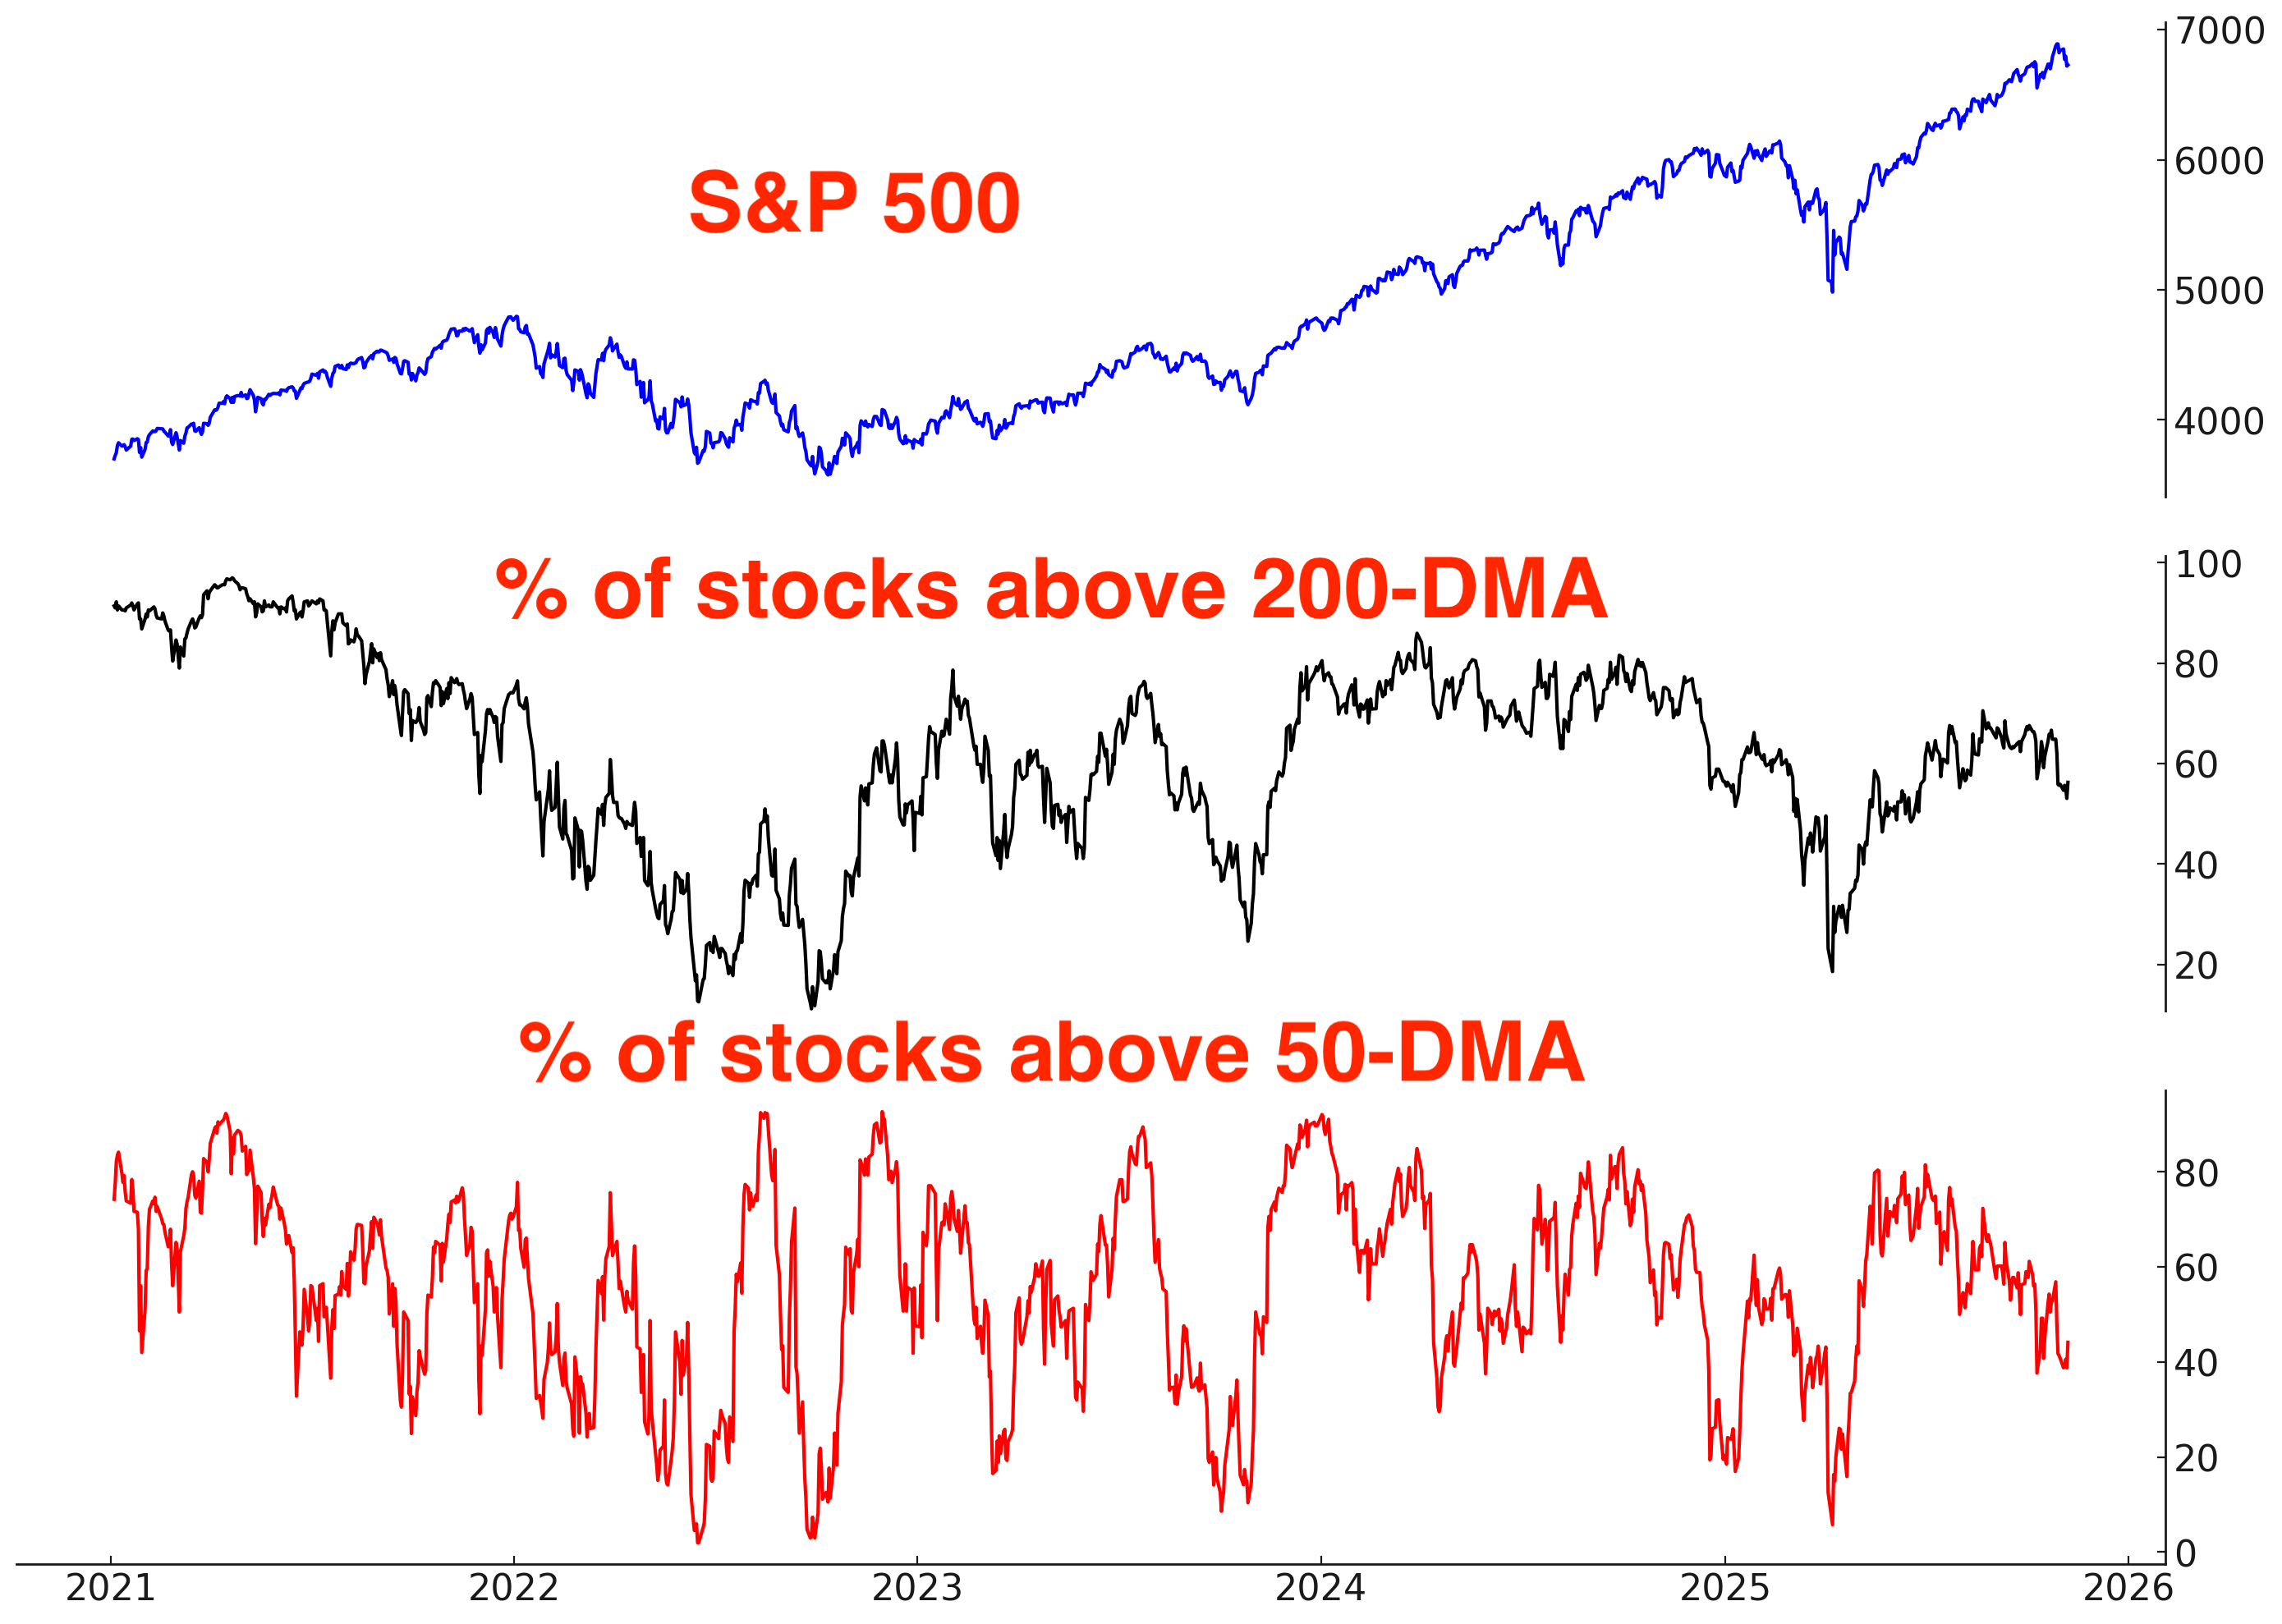
Considering that the S&P is not far from all-time highs, there are relatively few stocks above their 200 day moving average. This happened a lot during the late-1998 to 2000 bubble:

Trend
The trend is your friend, until it ends. Stocks are still trending higher, but this UpTrend is weakening.
For new traders, a simple and mechanical trend following approach beats 90% of the mumbo-jumbo that’s popularized on social media platforms like Youtube and X. Sounding smart ≠ being smart.
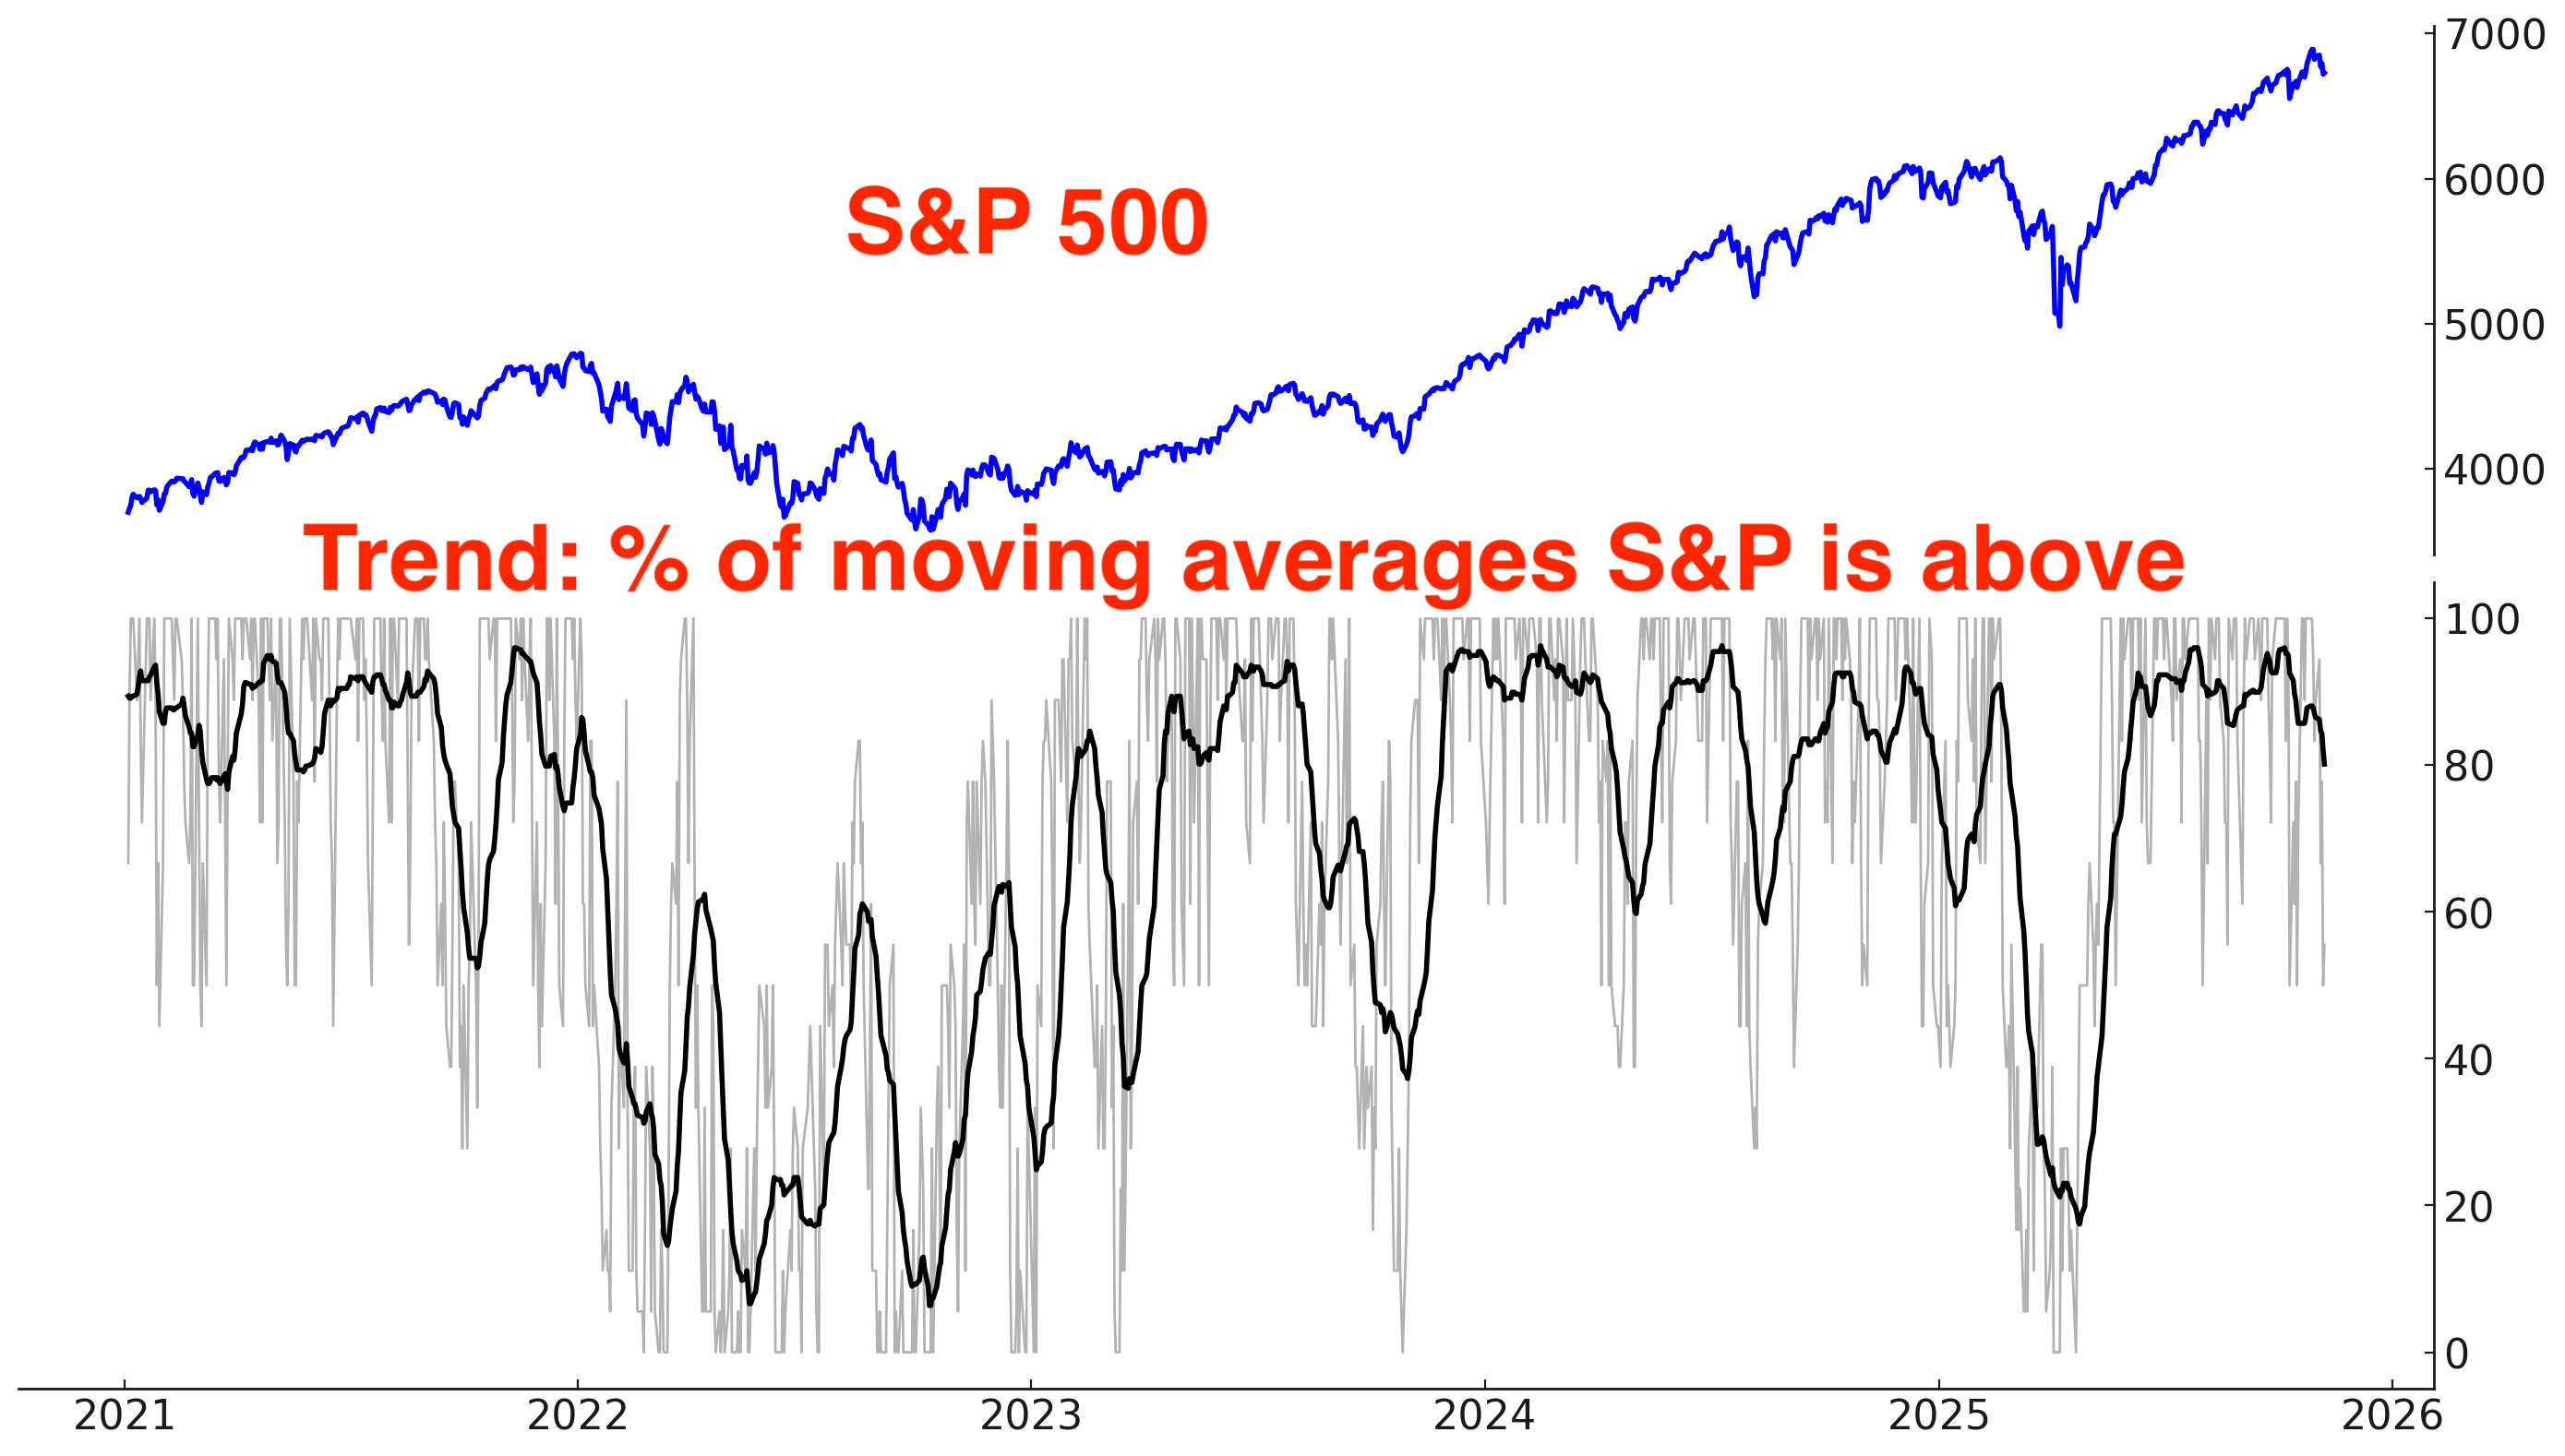
Why does trend matter? Because at least from a trend following perspective, it’s better to buy when the market is trending Up (e.g. above its 200-DMA) than when the market is trending Down (e.g. below its 200-DMA).
*There is nothing “special” about the 200 day moving average, except the fact that it’s popular. It is not significantly different from the 195, 190, 185, 180, 205, 210, 215, or 220 moving averages.
Long above vs. below the S&P 500’s 200 day moving average:

Long above vs. below the S&P 500’s 50 day moving average:

Long above vs. below the S&P 500’s 20 day moving average:

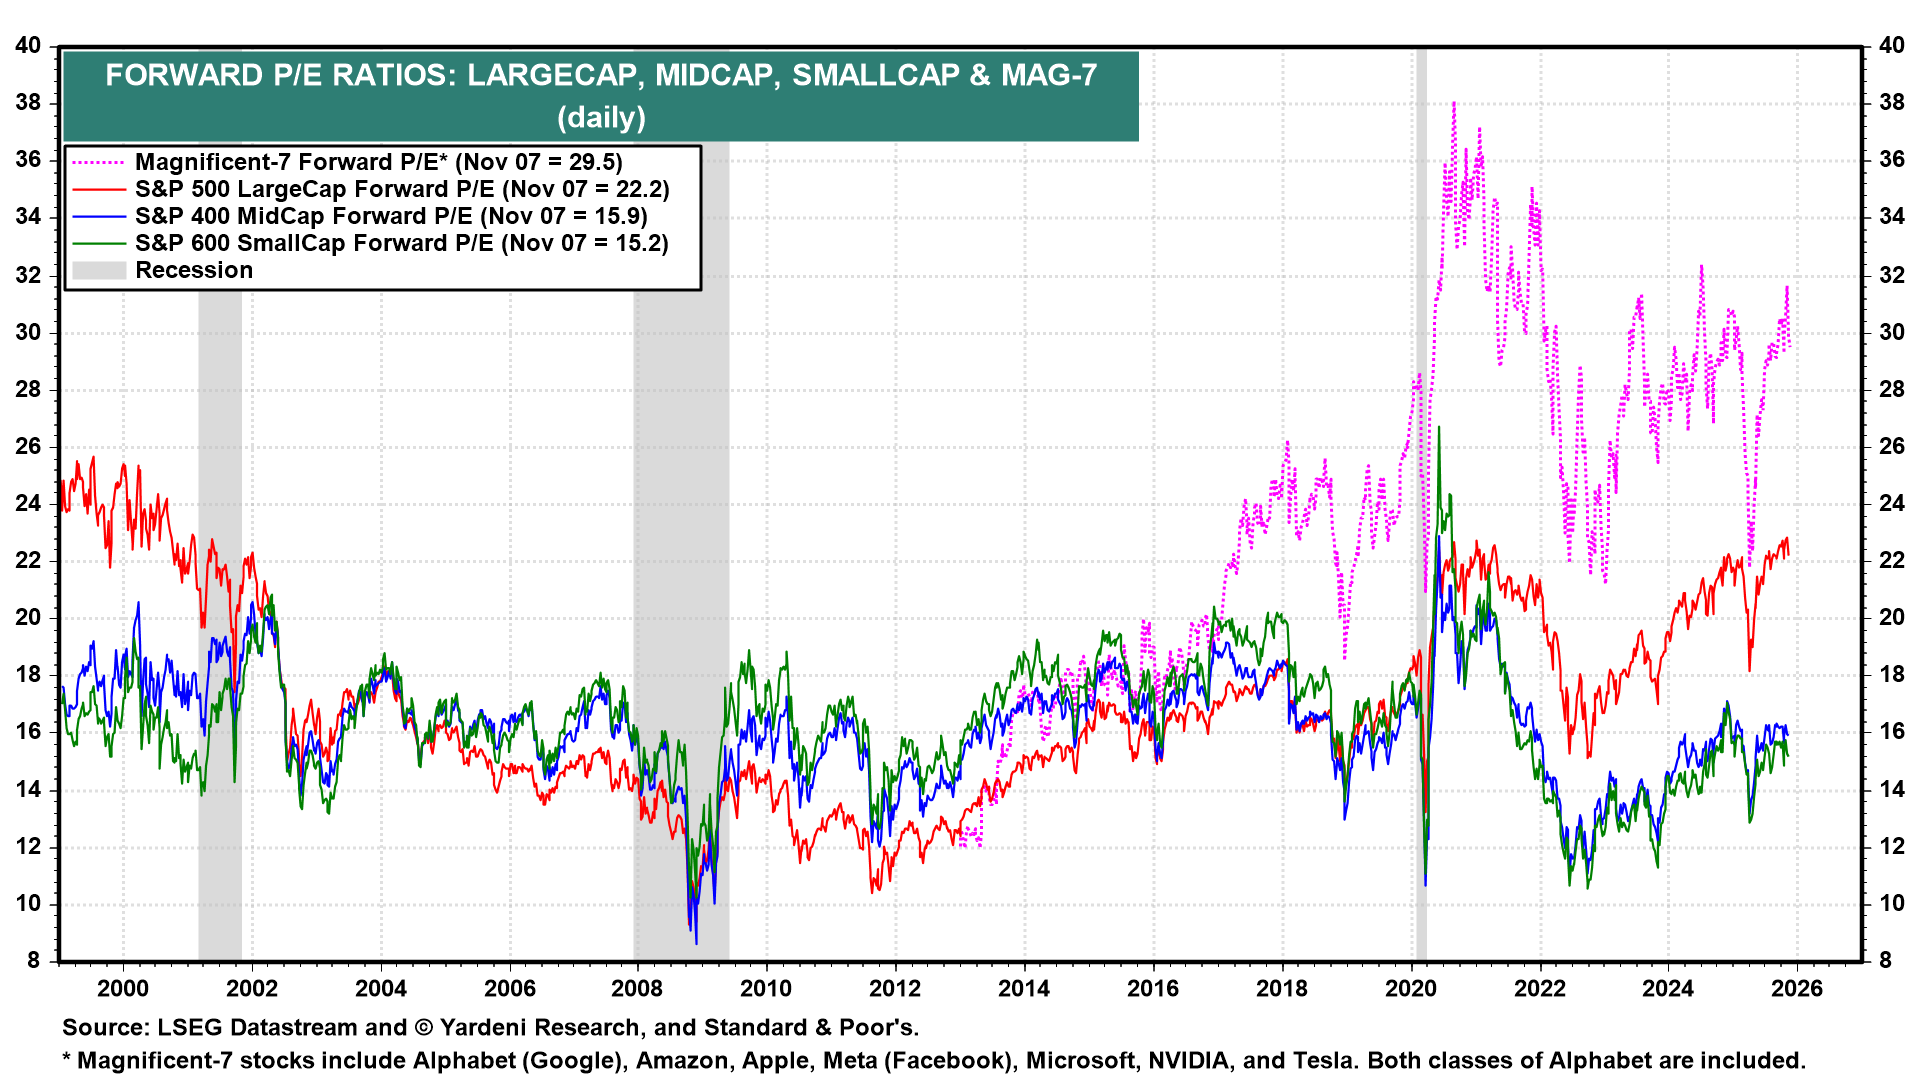
Earnings & Valuations
Some traders say that valuations and fundamentals are useless, and that “only price matters”. While this is true for day traders (valuations have zero impact on the market’s short term direction), fundamentals matter for traders and investors with longer term horizons.
Valuations for large cap stocks (S&P 500) remain elevated compared to their 10 year average:
Here’s the S&P 500’s forward earnings. In the long run, earnings and stock prices move in the same direction. Earnings are still growing right now. But what if earnings growth slows down?
