This week was quiet until the Israel/Iran conflict jolted markets. Stocks fell and oil jumped.
In today’s Markets Report I’ll share my outlook for stocks, Bitcoin, commodities, bonds, and currencies — and explain how I’m positioning my portfolio in response.
U.S. Stocks
Sentiment Surveys
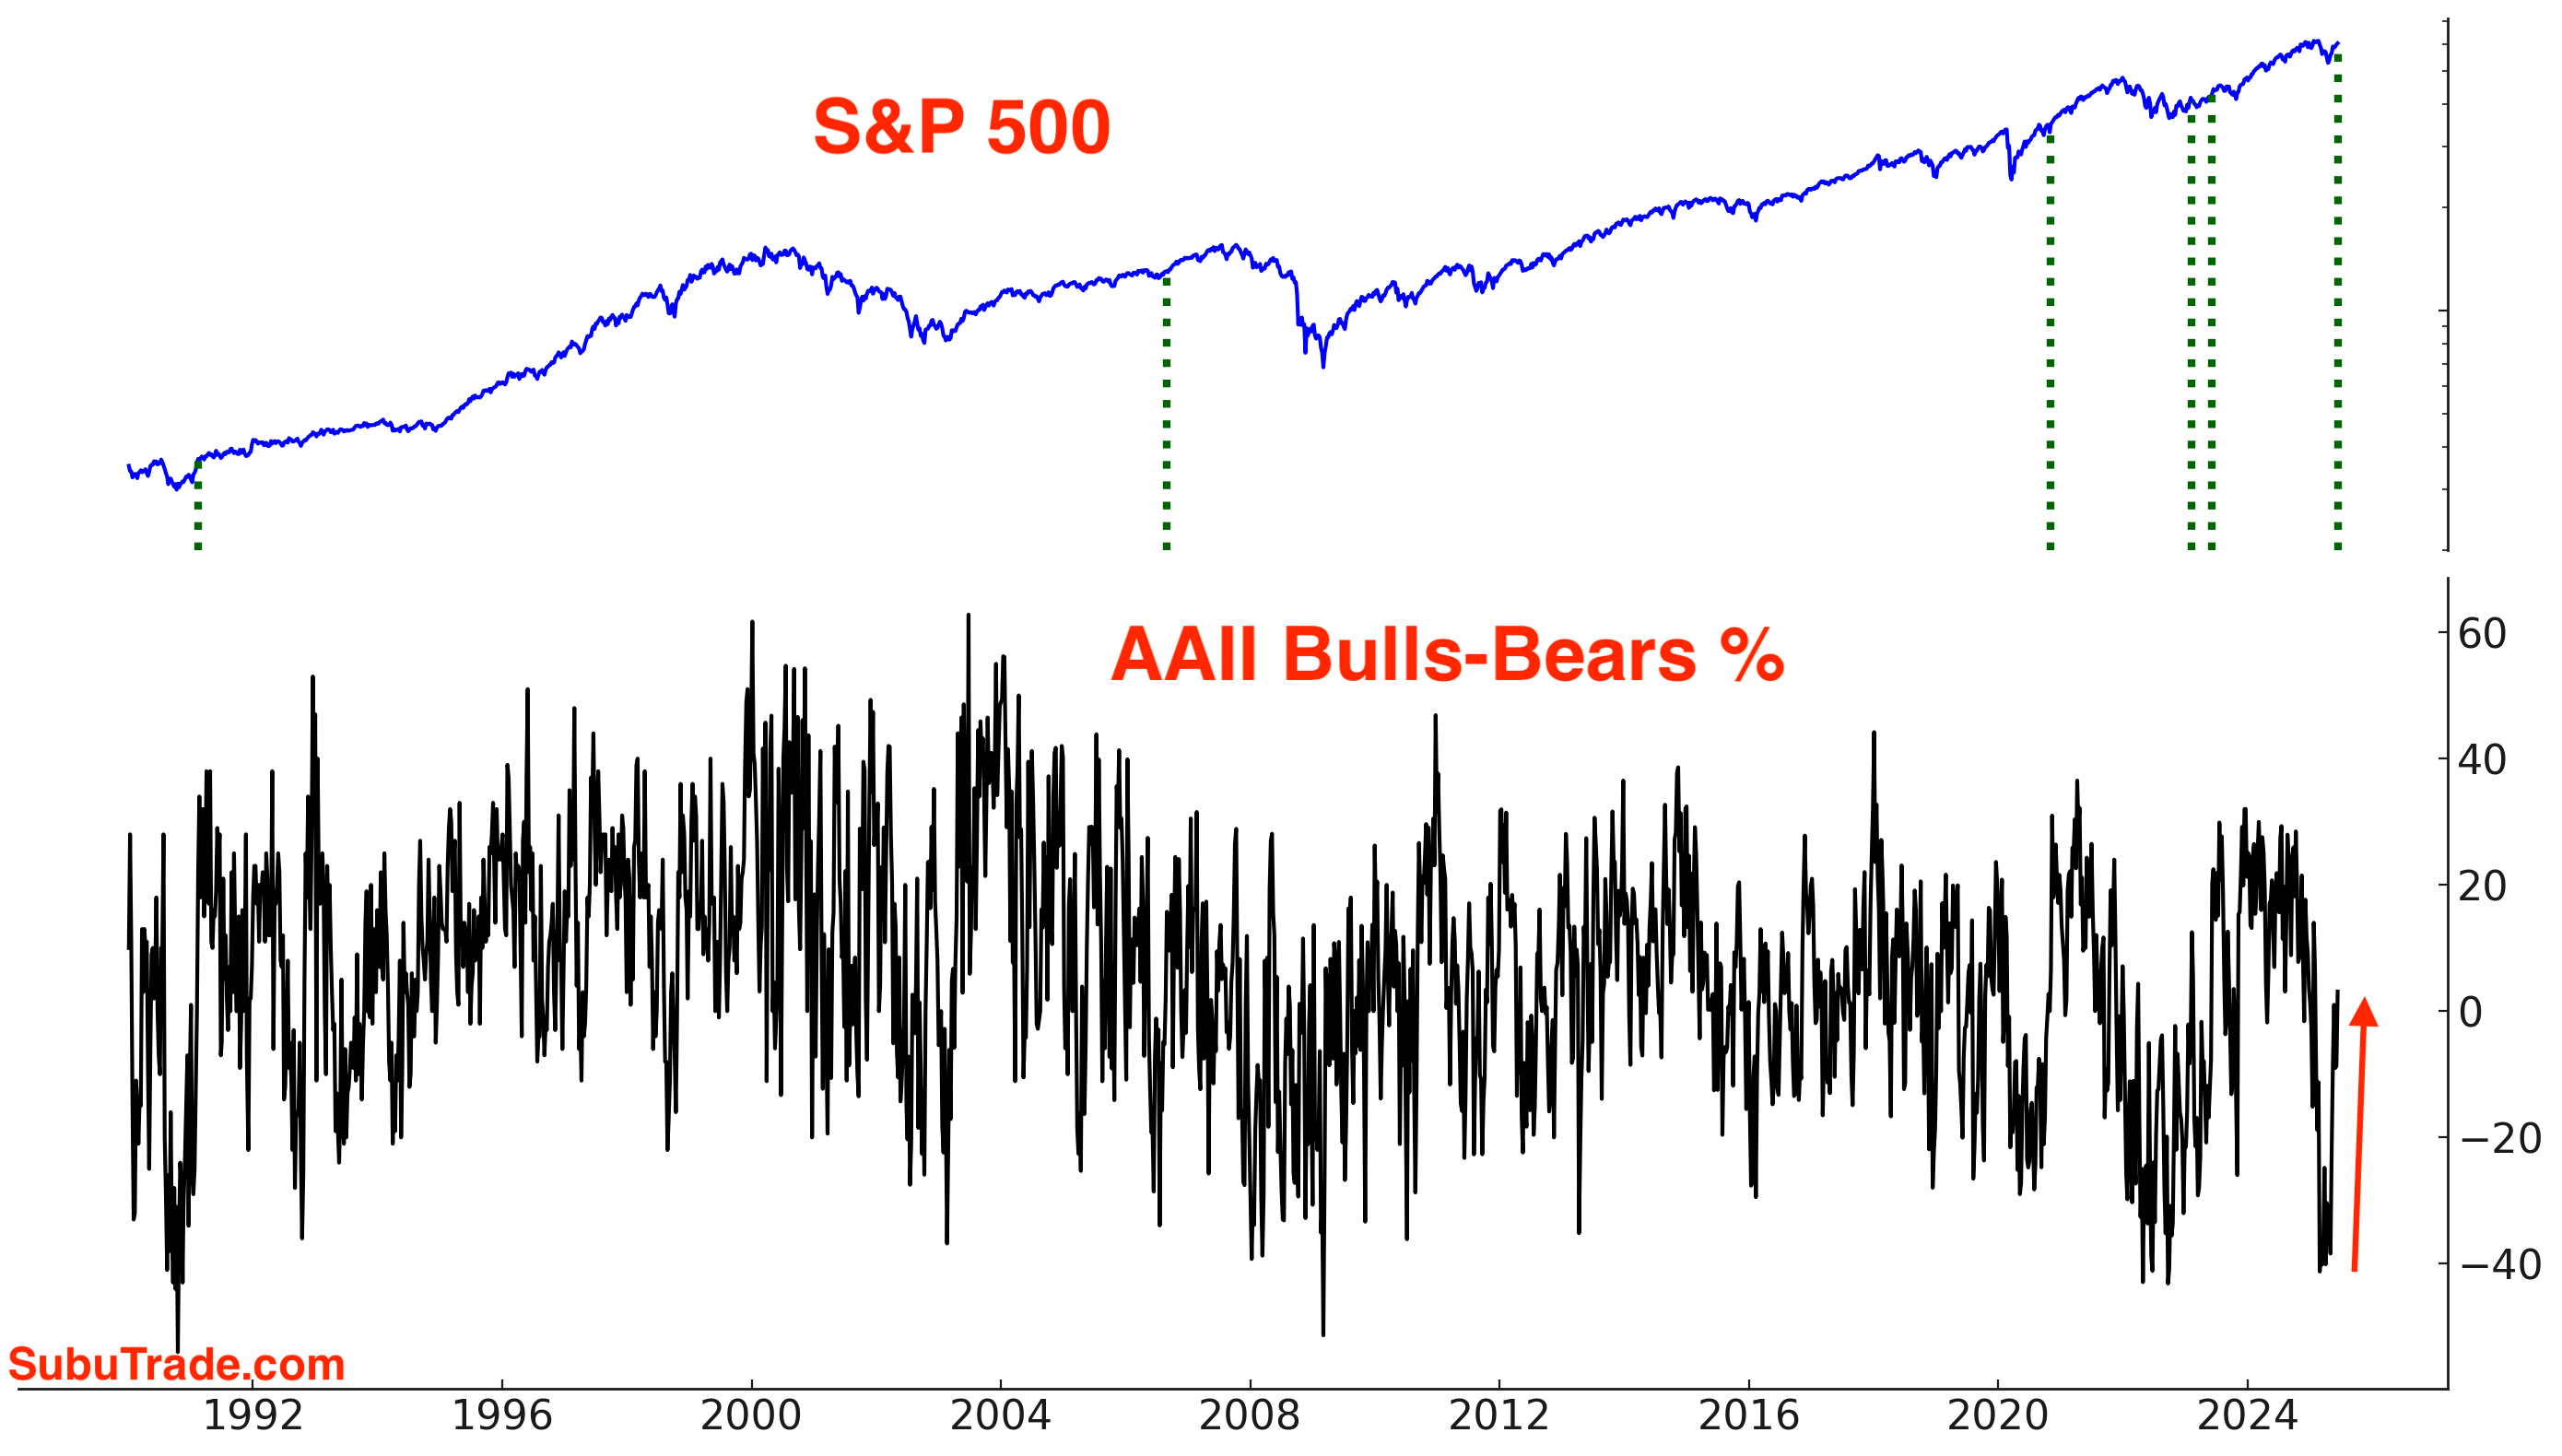
Depending on what sentiment indicators you look at, sentiment is just starting to recover. AAII Bulls-Bears is above 3% for the first time in 15 weeks. Despite stocks being close to all-time highs, there are hardly more bulls than bears!
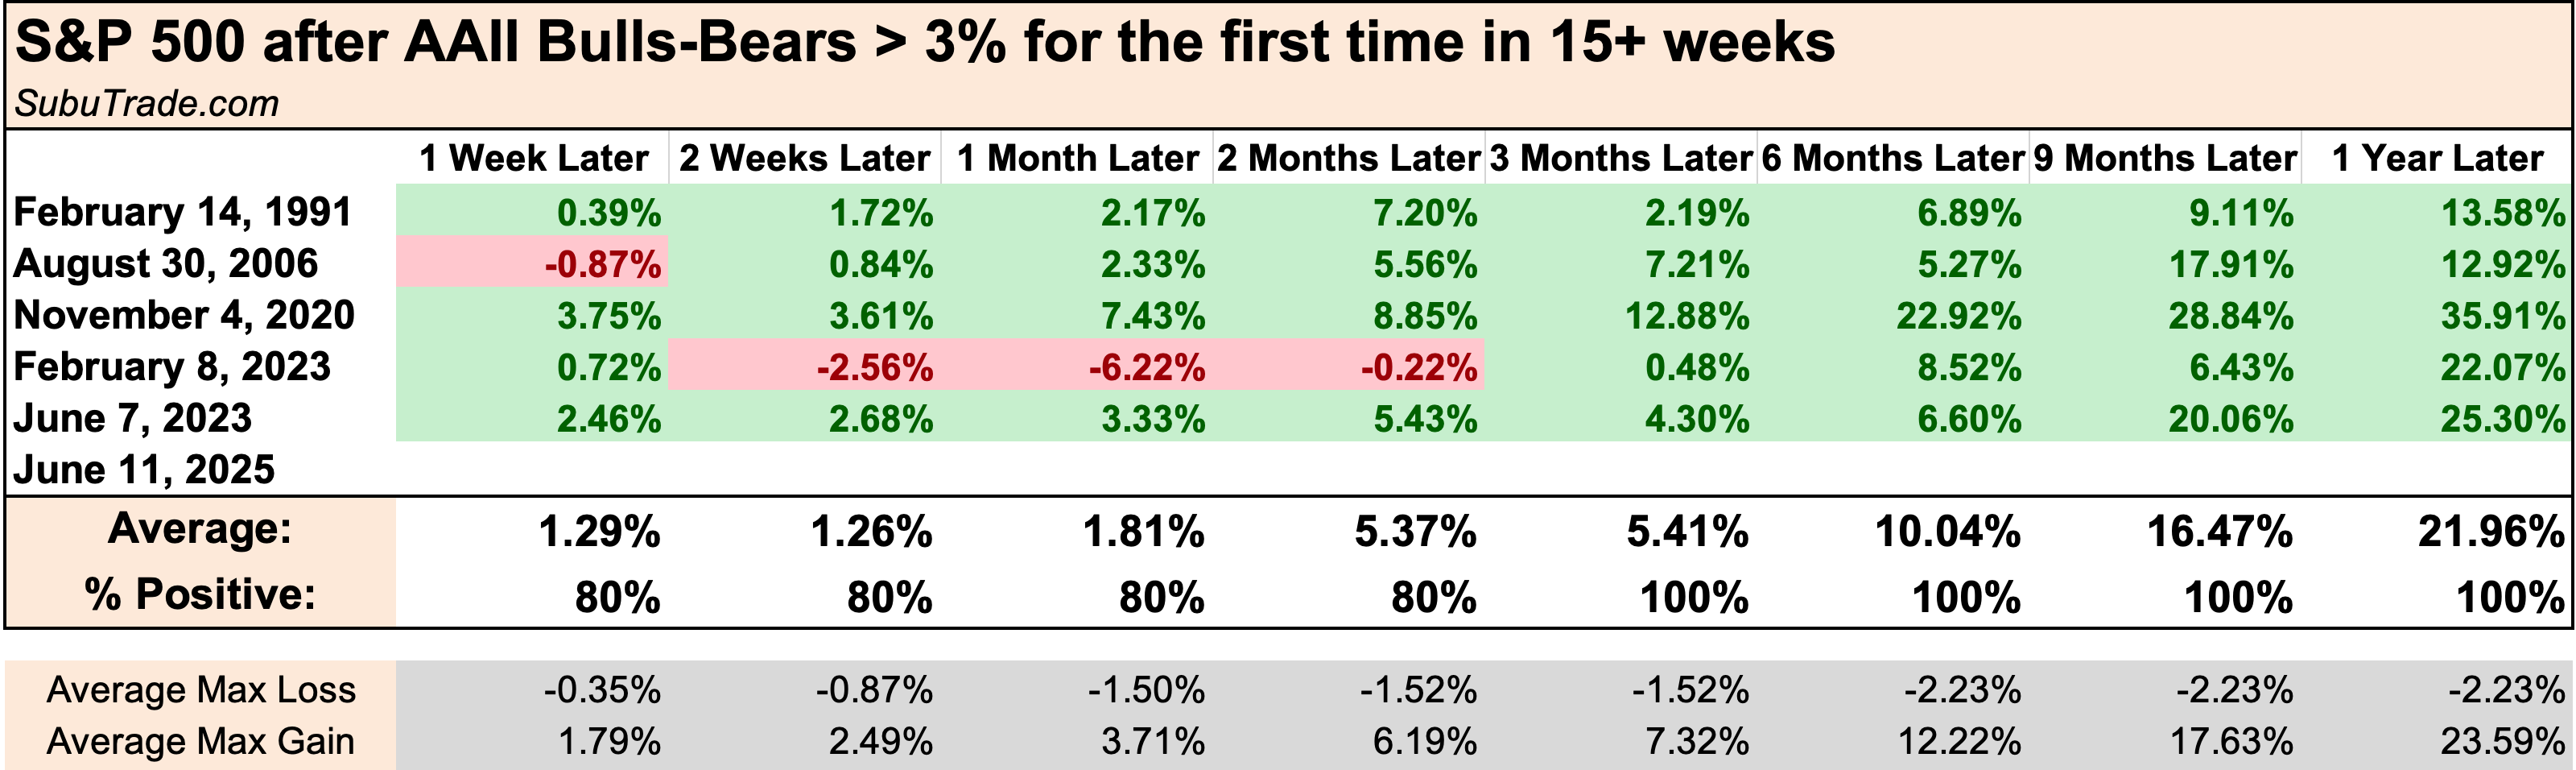
When sentiment started to recover for the first time in this many weeks, stocks usually had more room to rally:
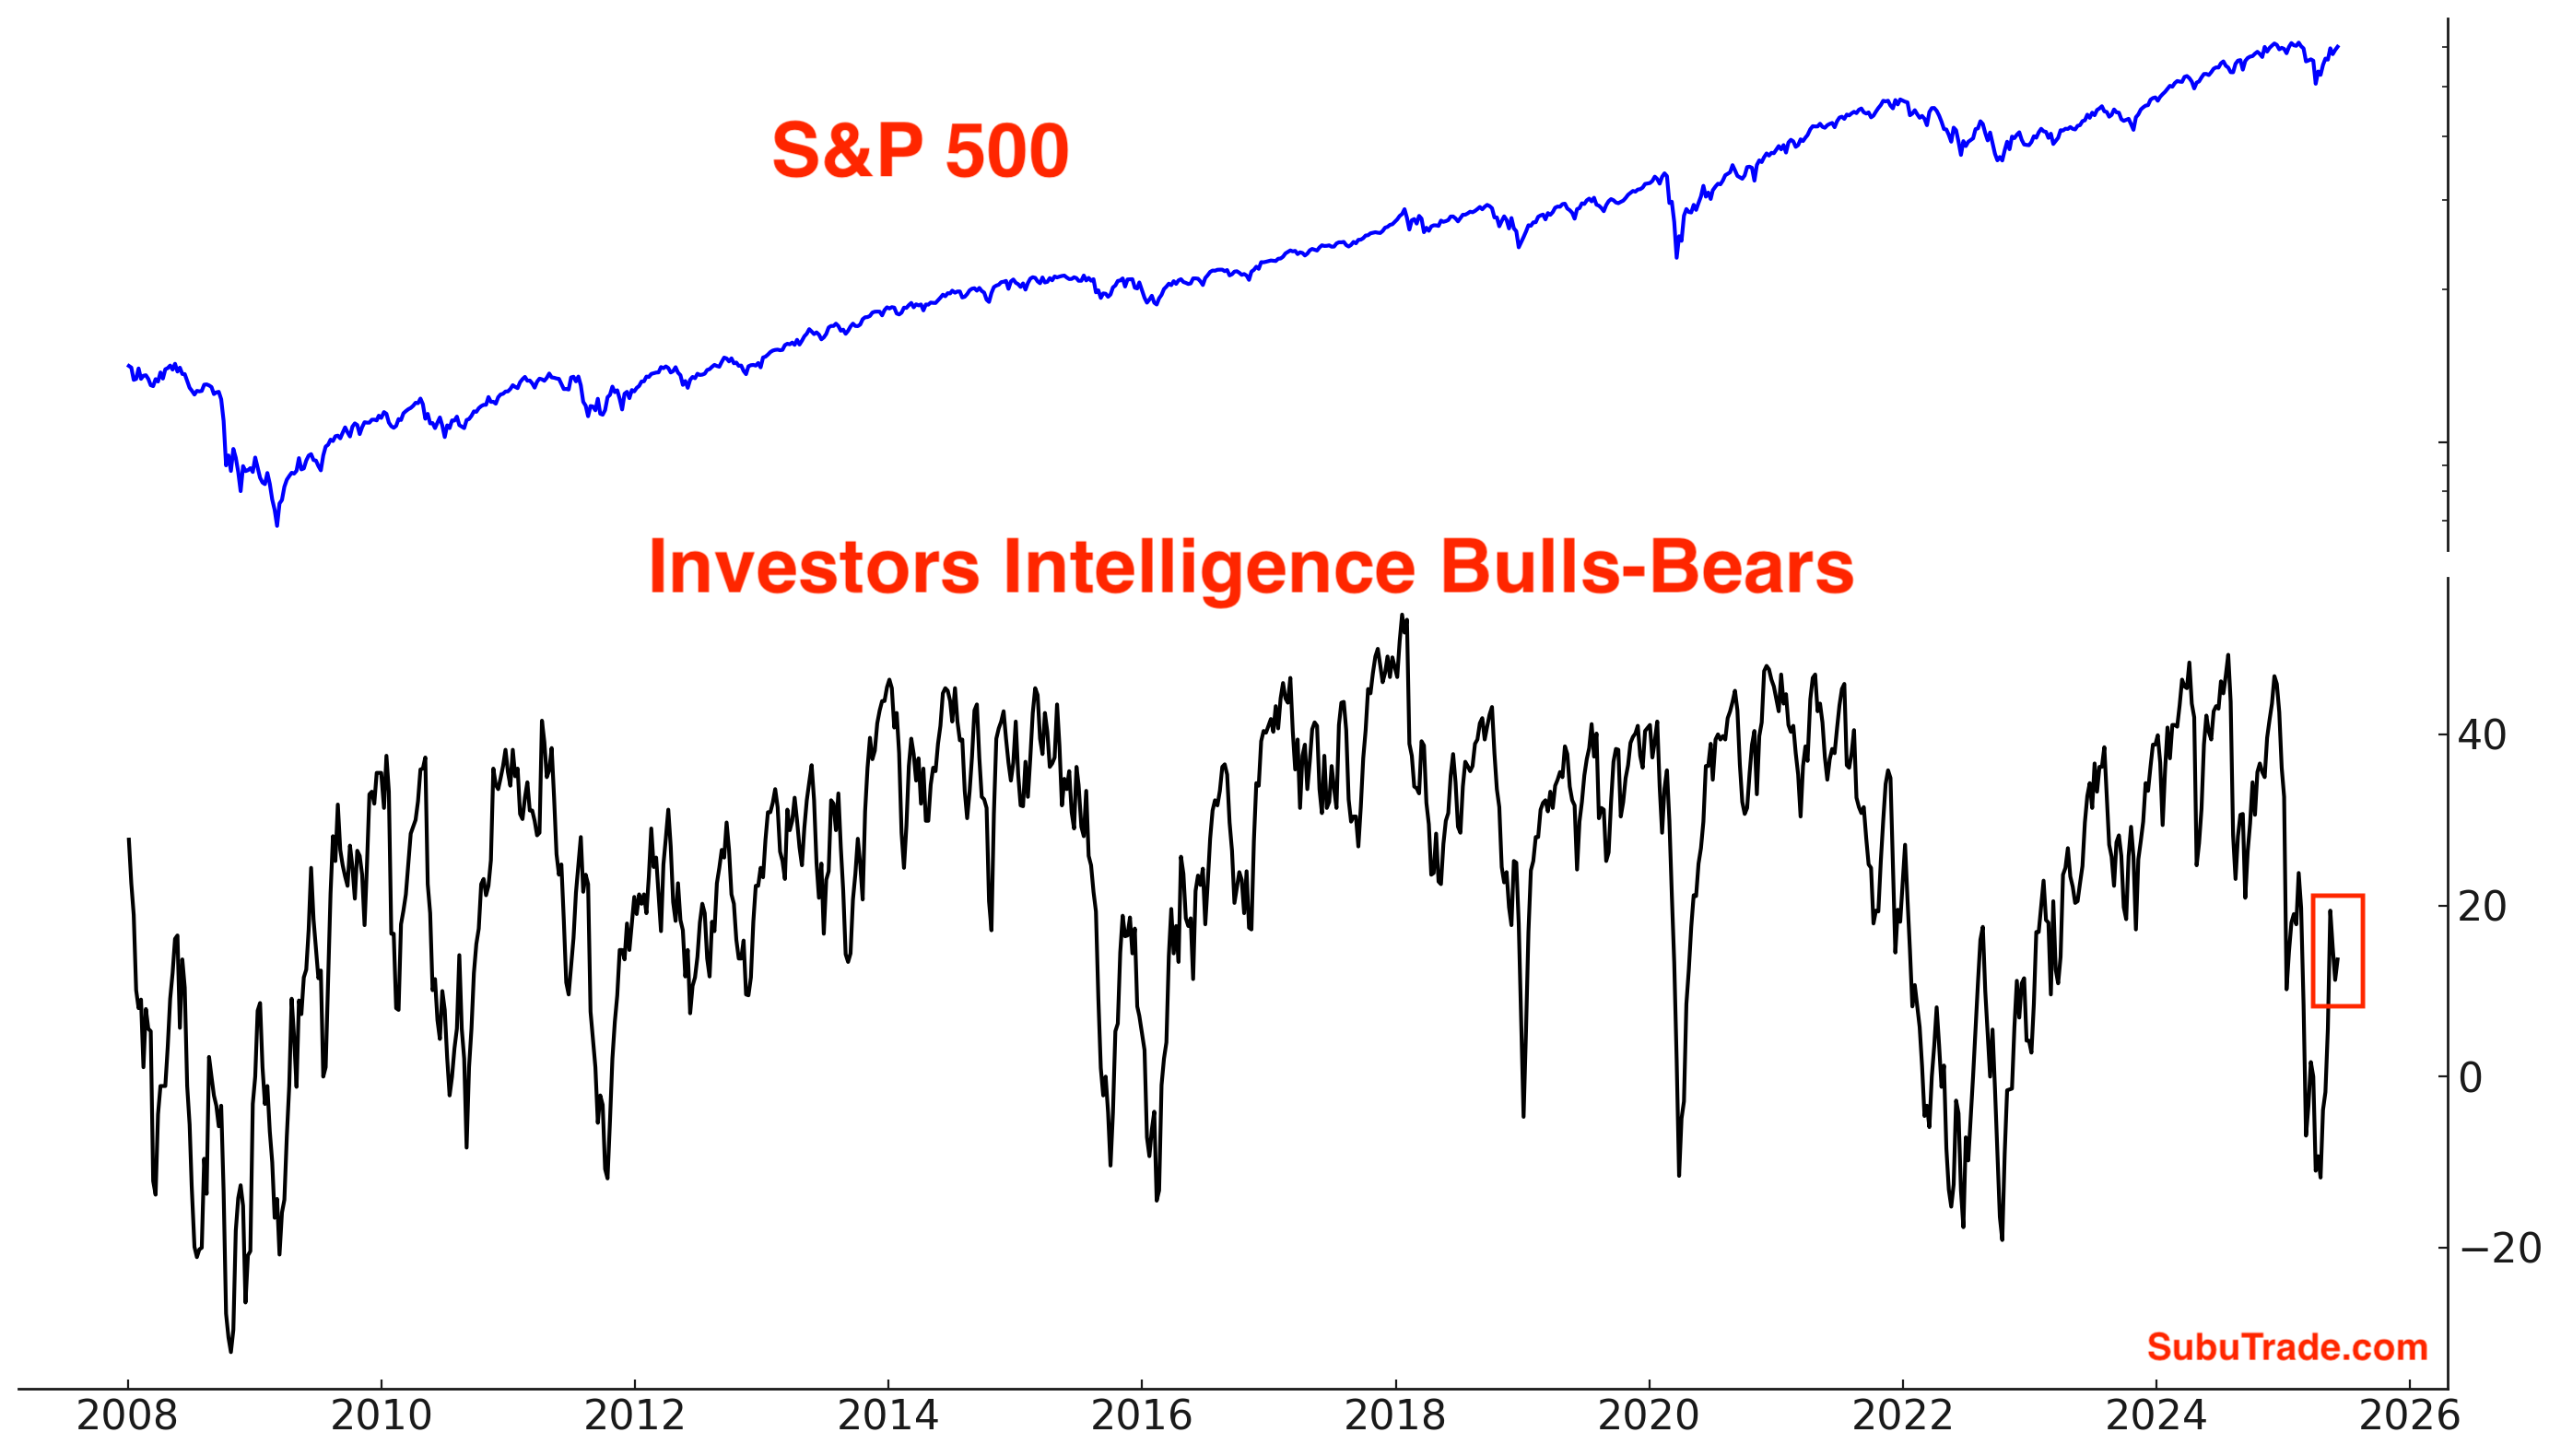
Investors Intelligence Bulls-Bears is in neutral territory:
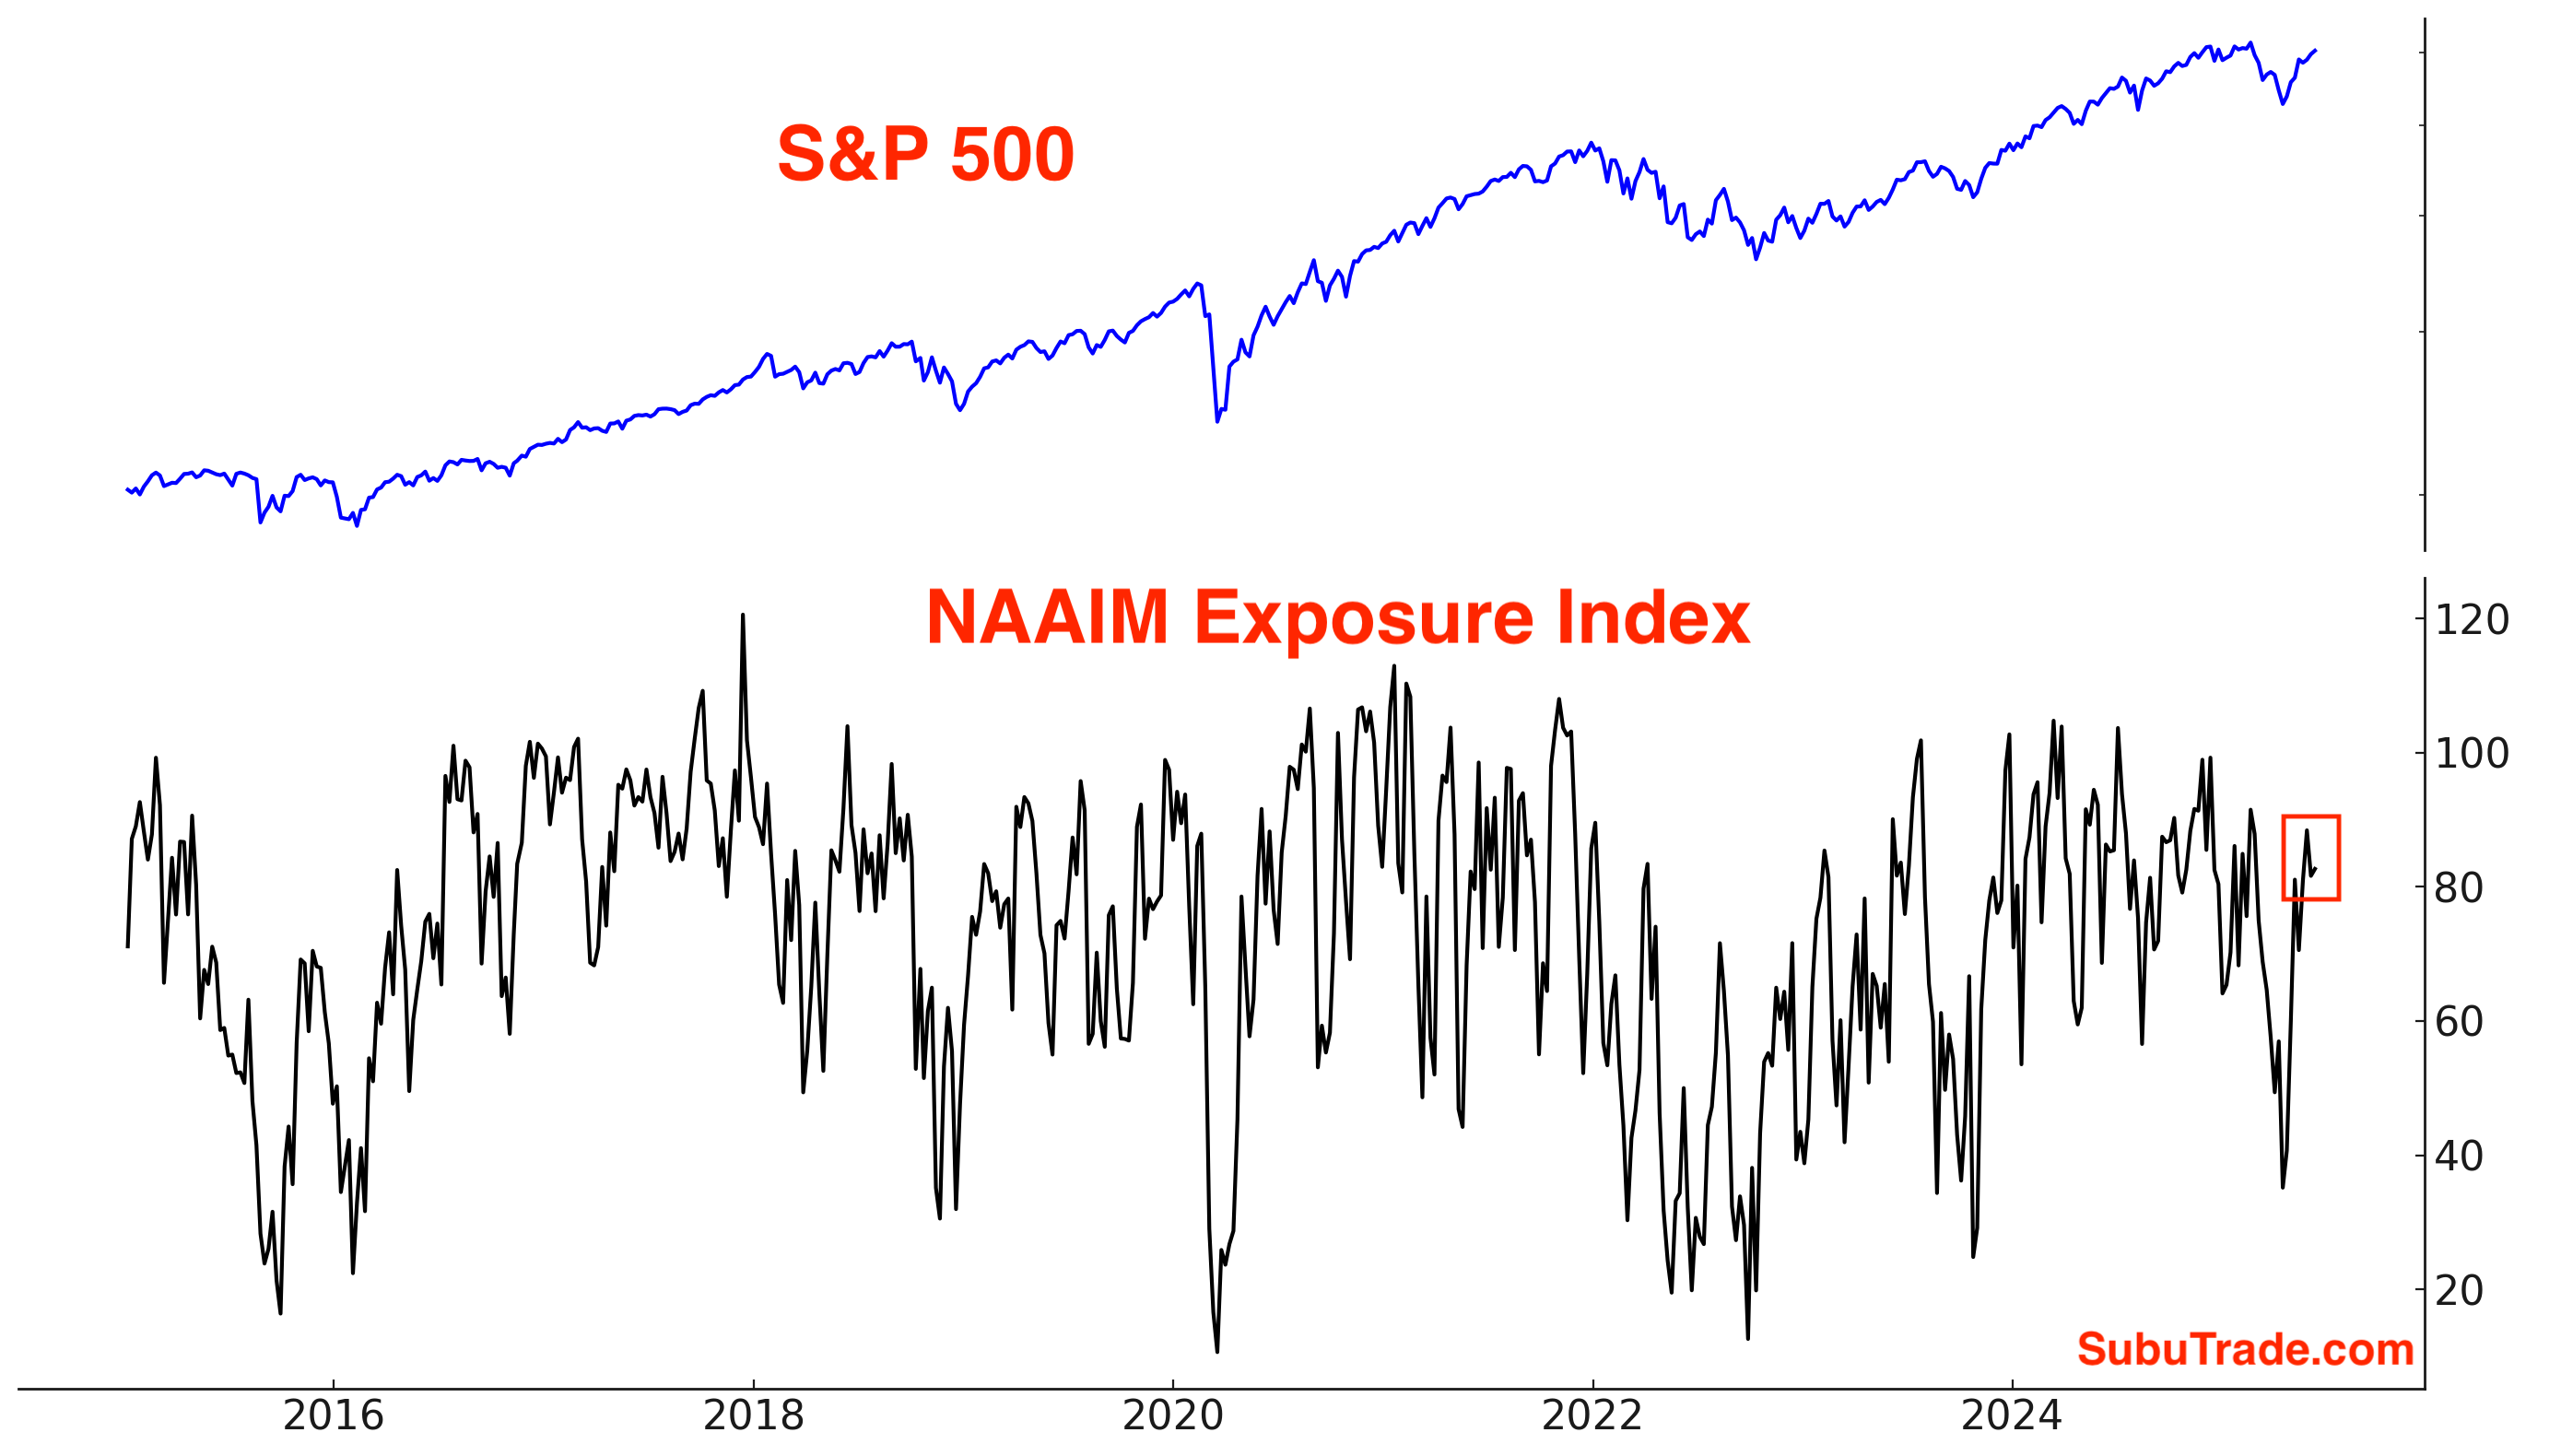
According to the NAAIM Exposure Index, asset managers lean bullish:
Options
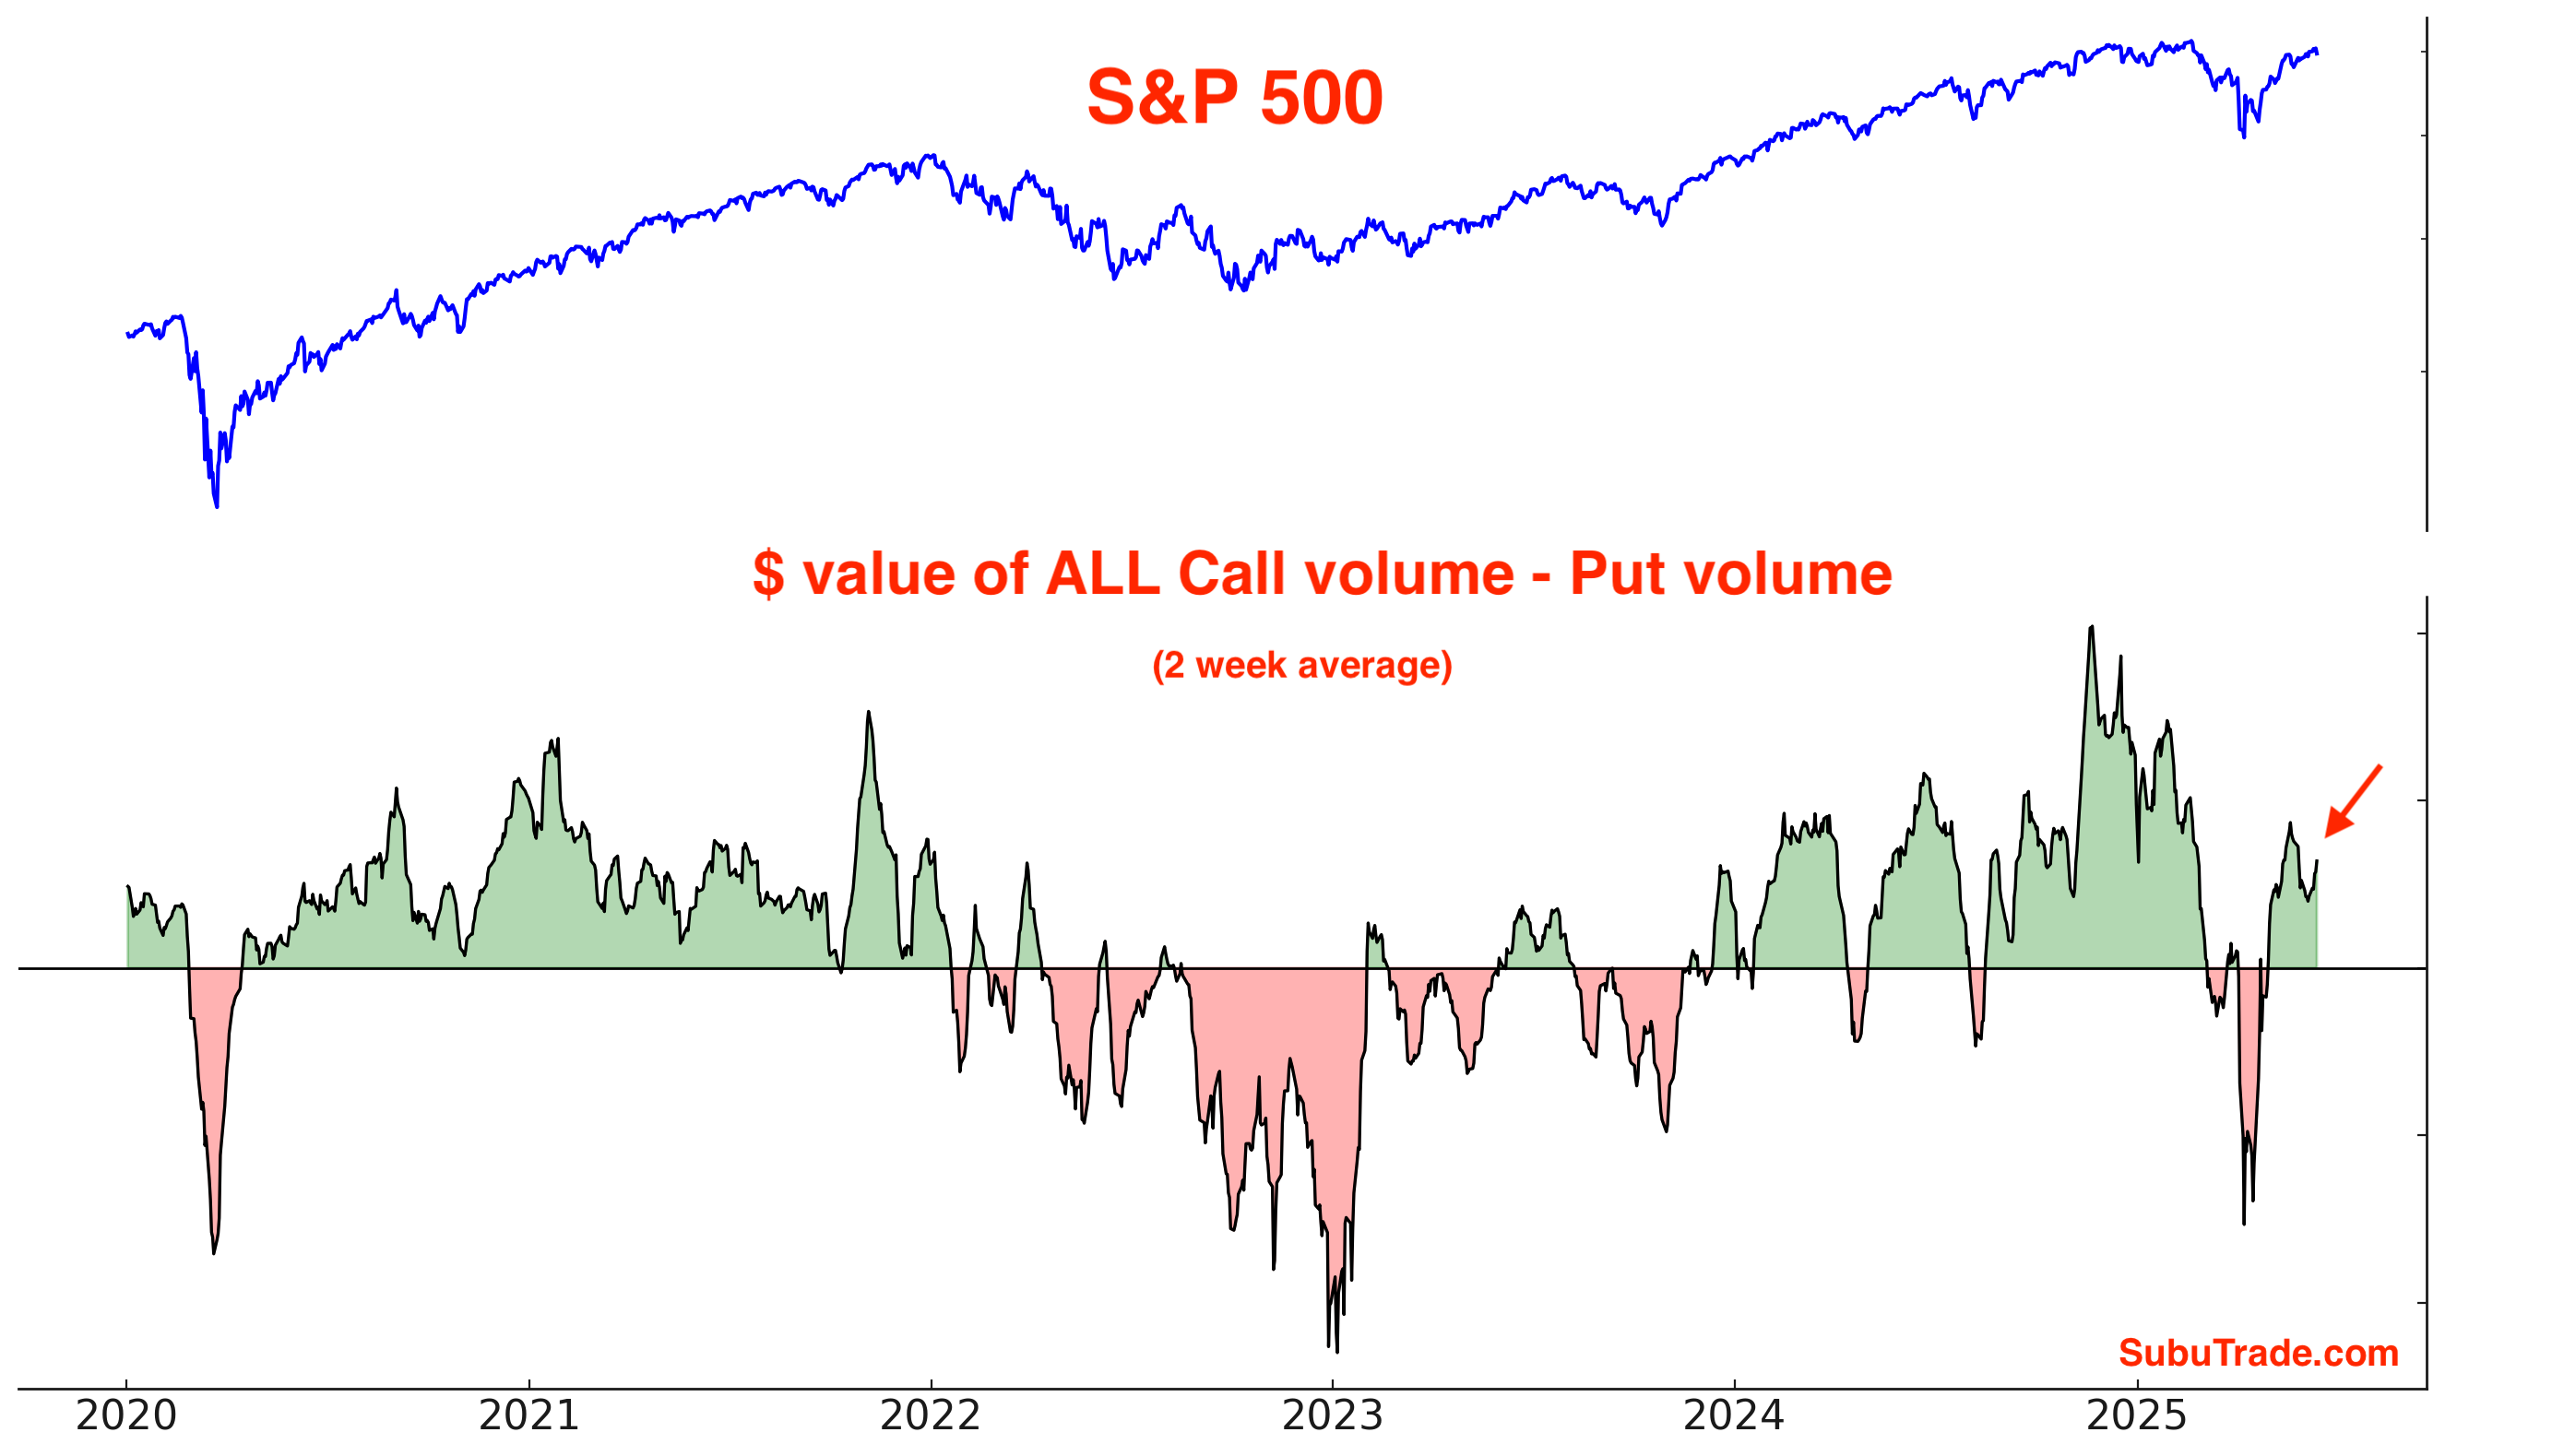
The $ value of all Call volume - the $ value of all Put volume is elevated, but not extremely high:
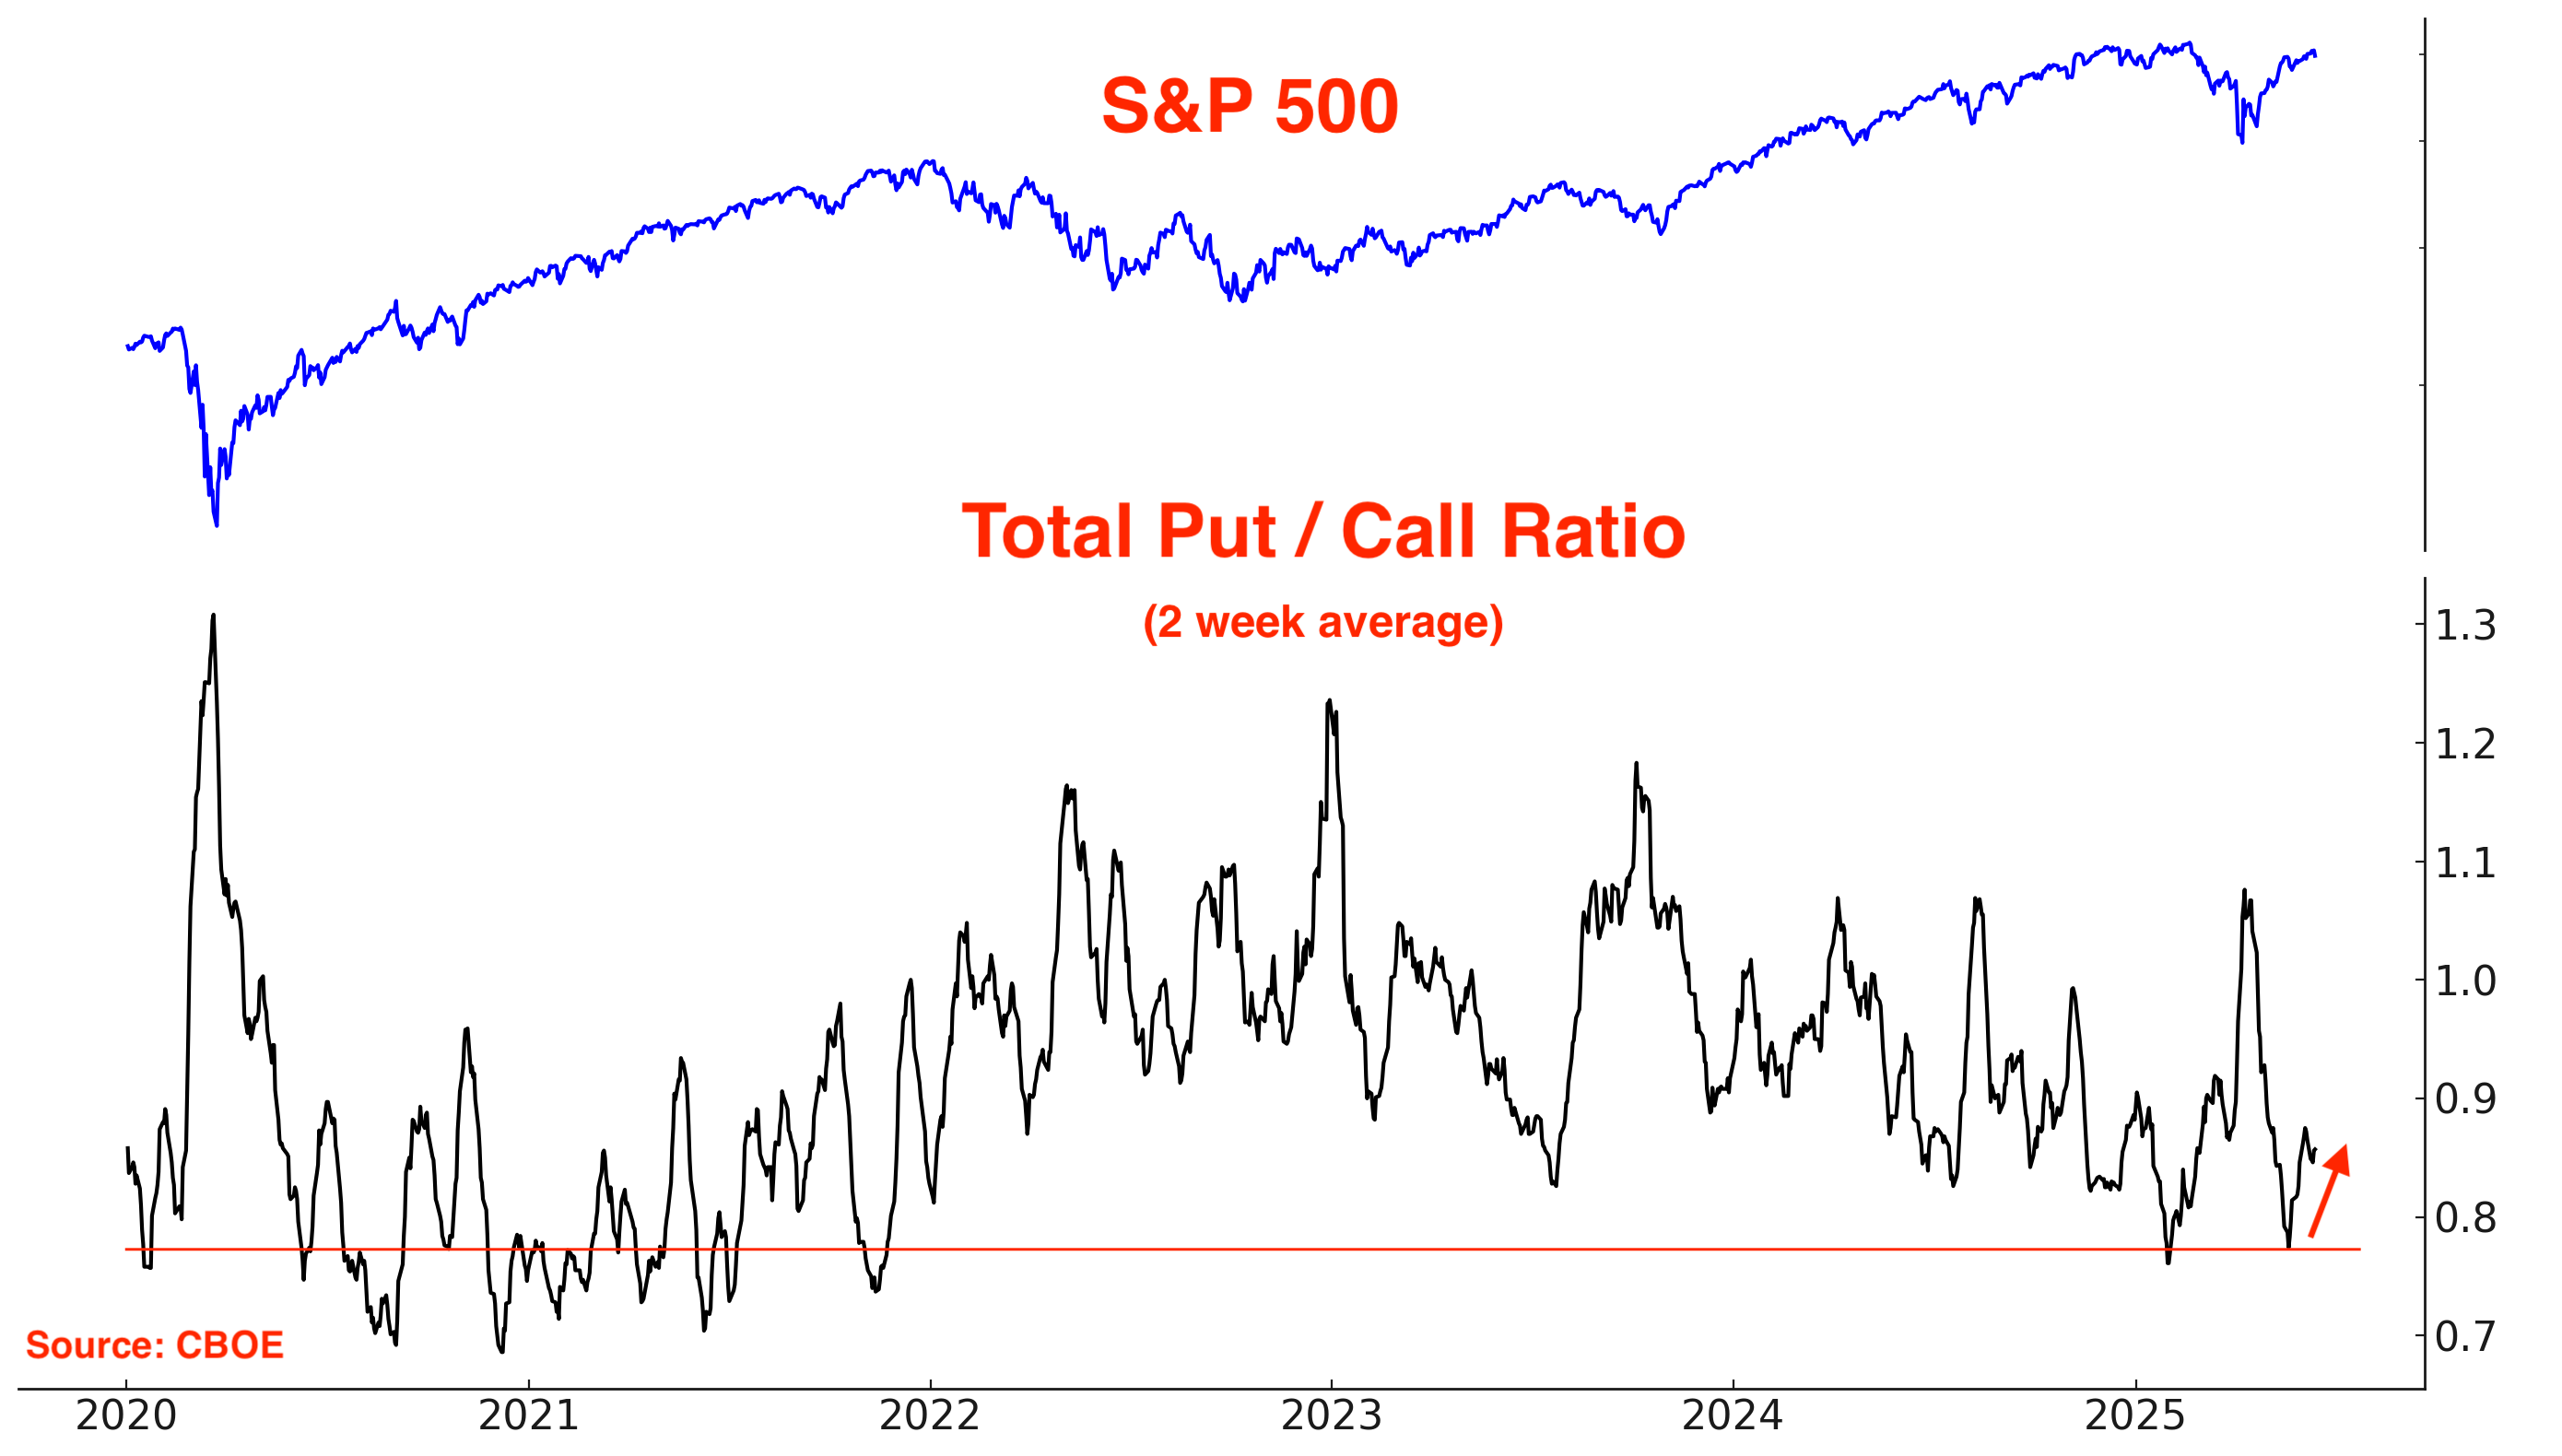
The CBOE’s Total Put/Call Ratio is not in “extreme” territory:
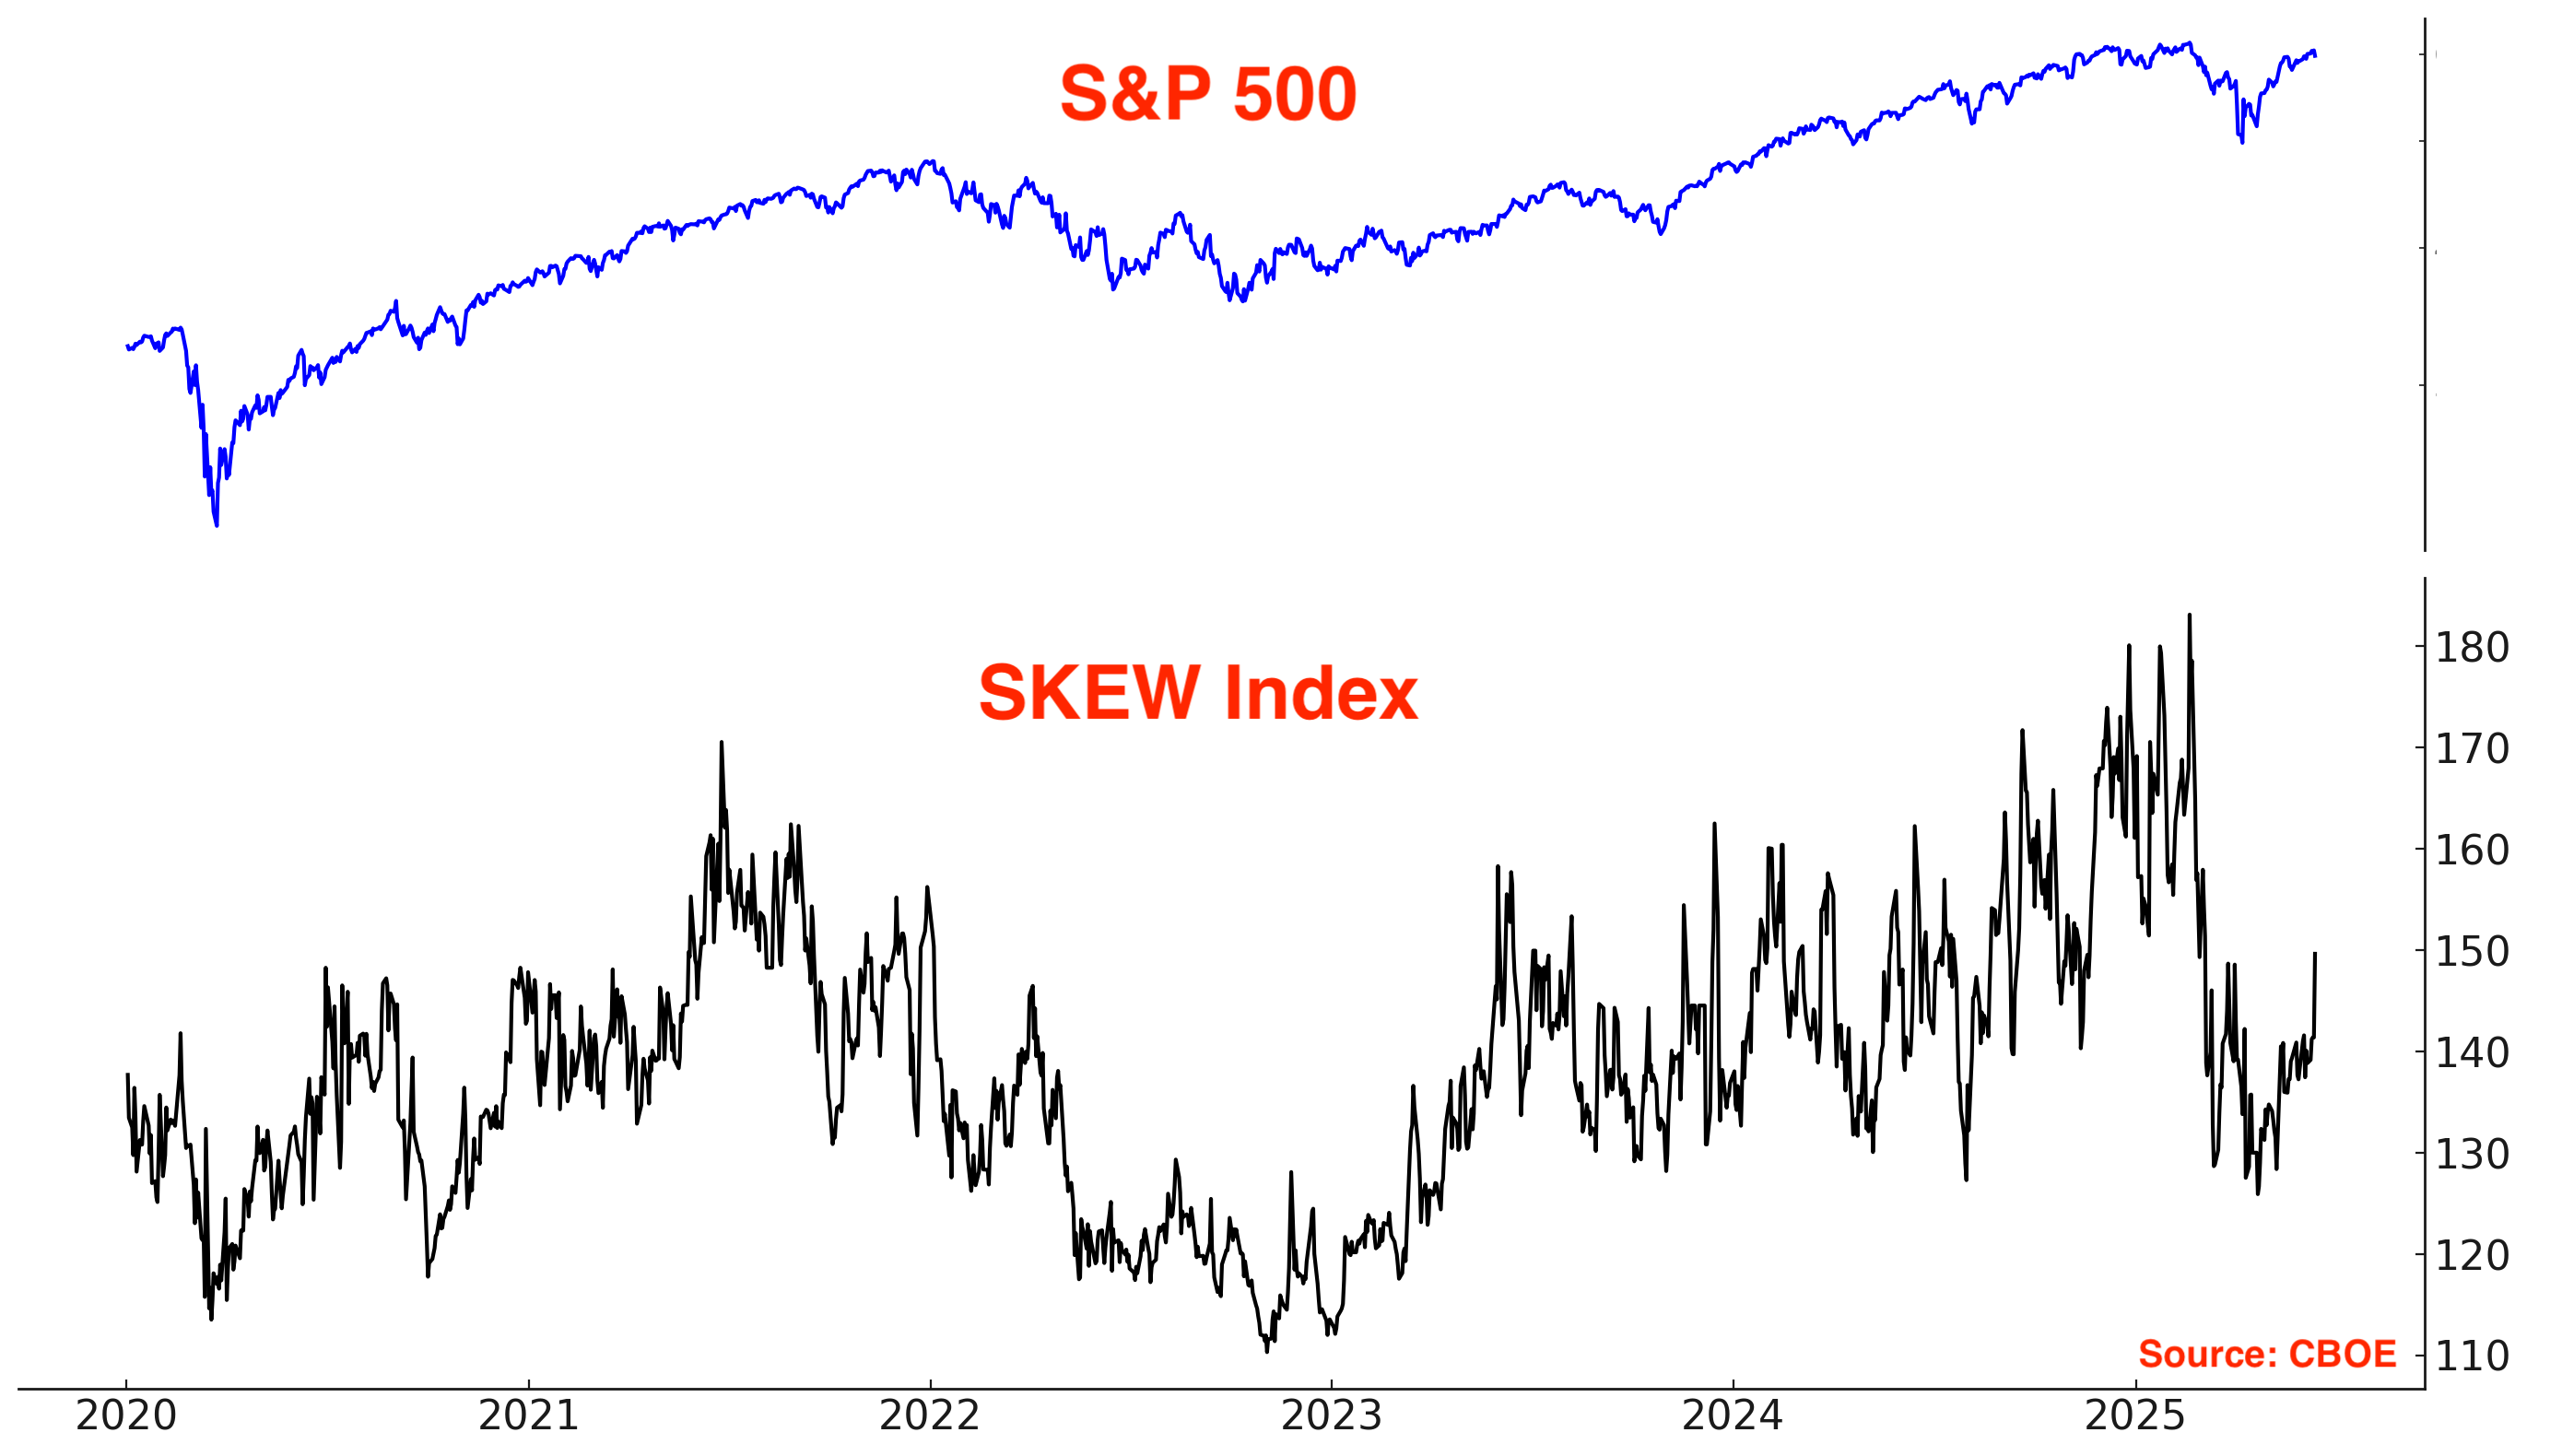
The SKEW Index, which reflects perceived tail risk in the options market — or the probability of extreme downside moves — remains muted. Despite stocks being near all-time highs, SKEW is well below the elevated levels seen earlier this year.
Breadth
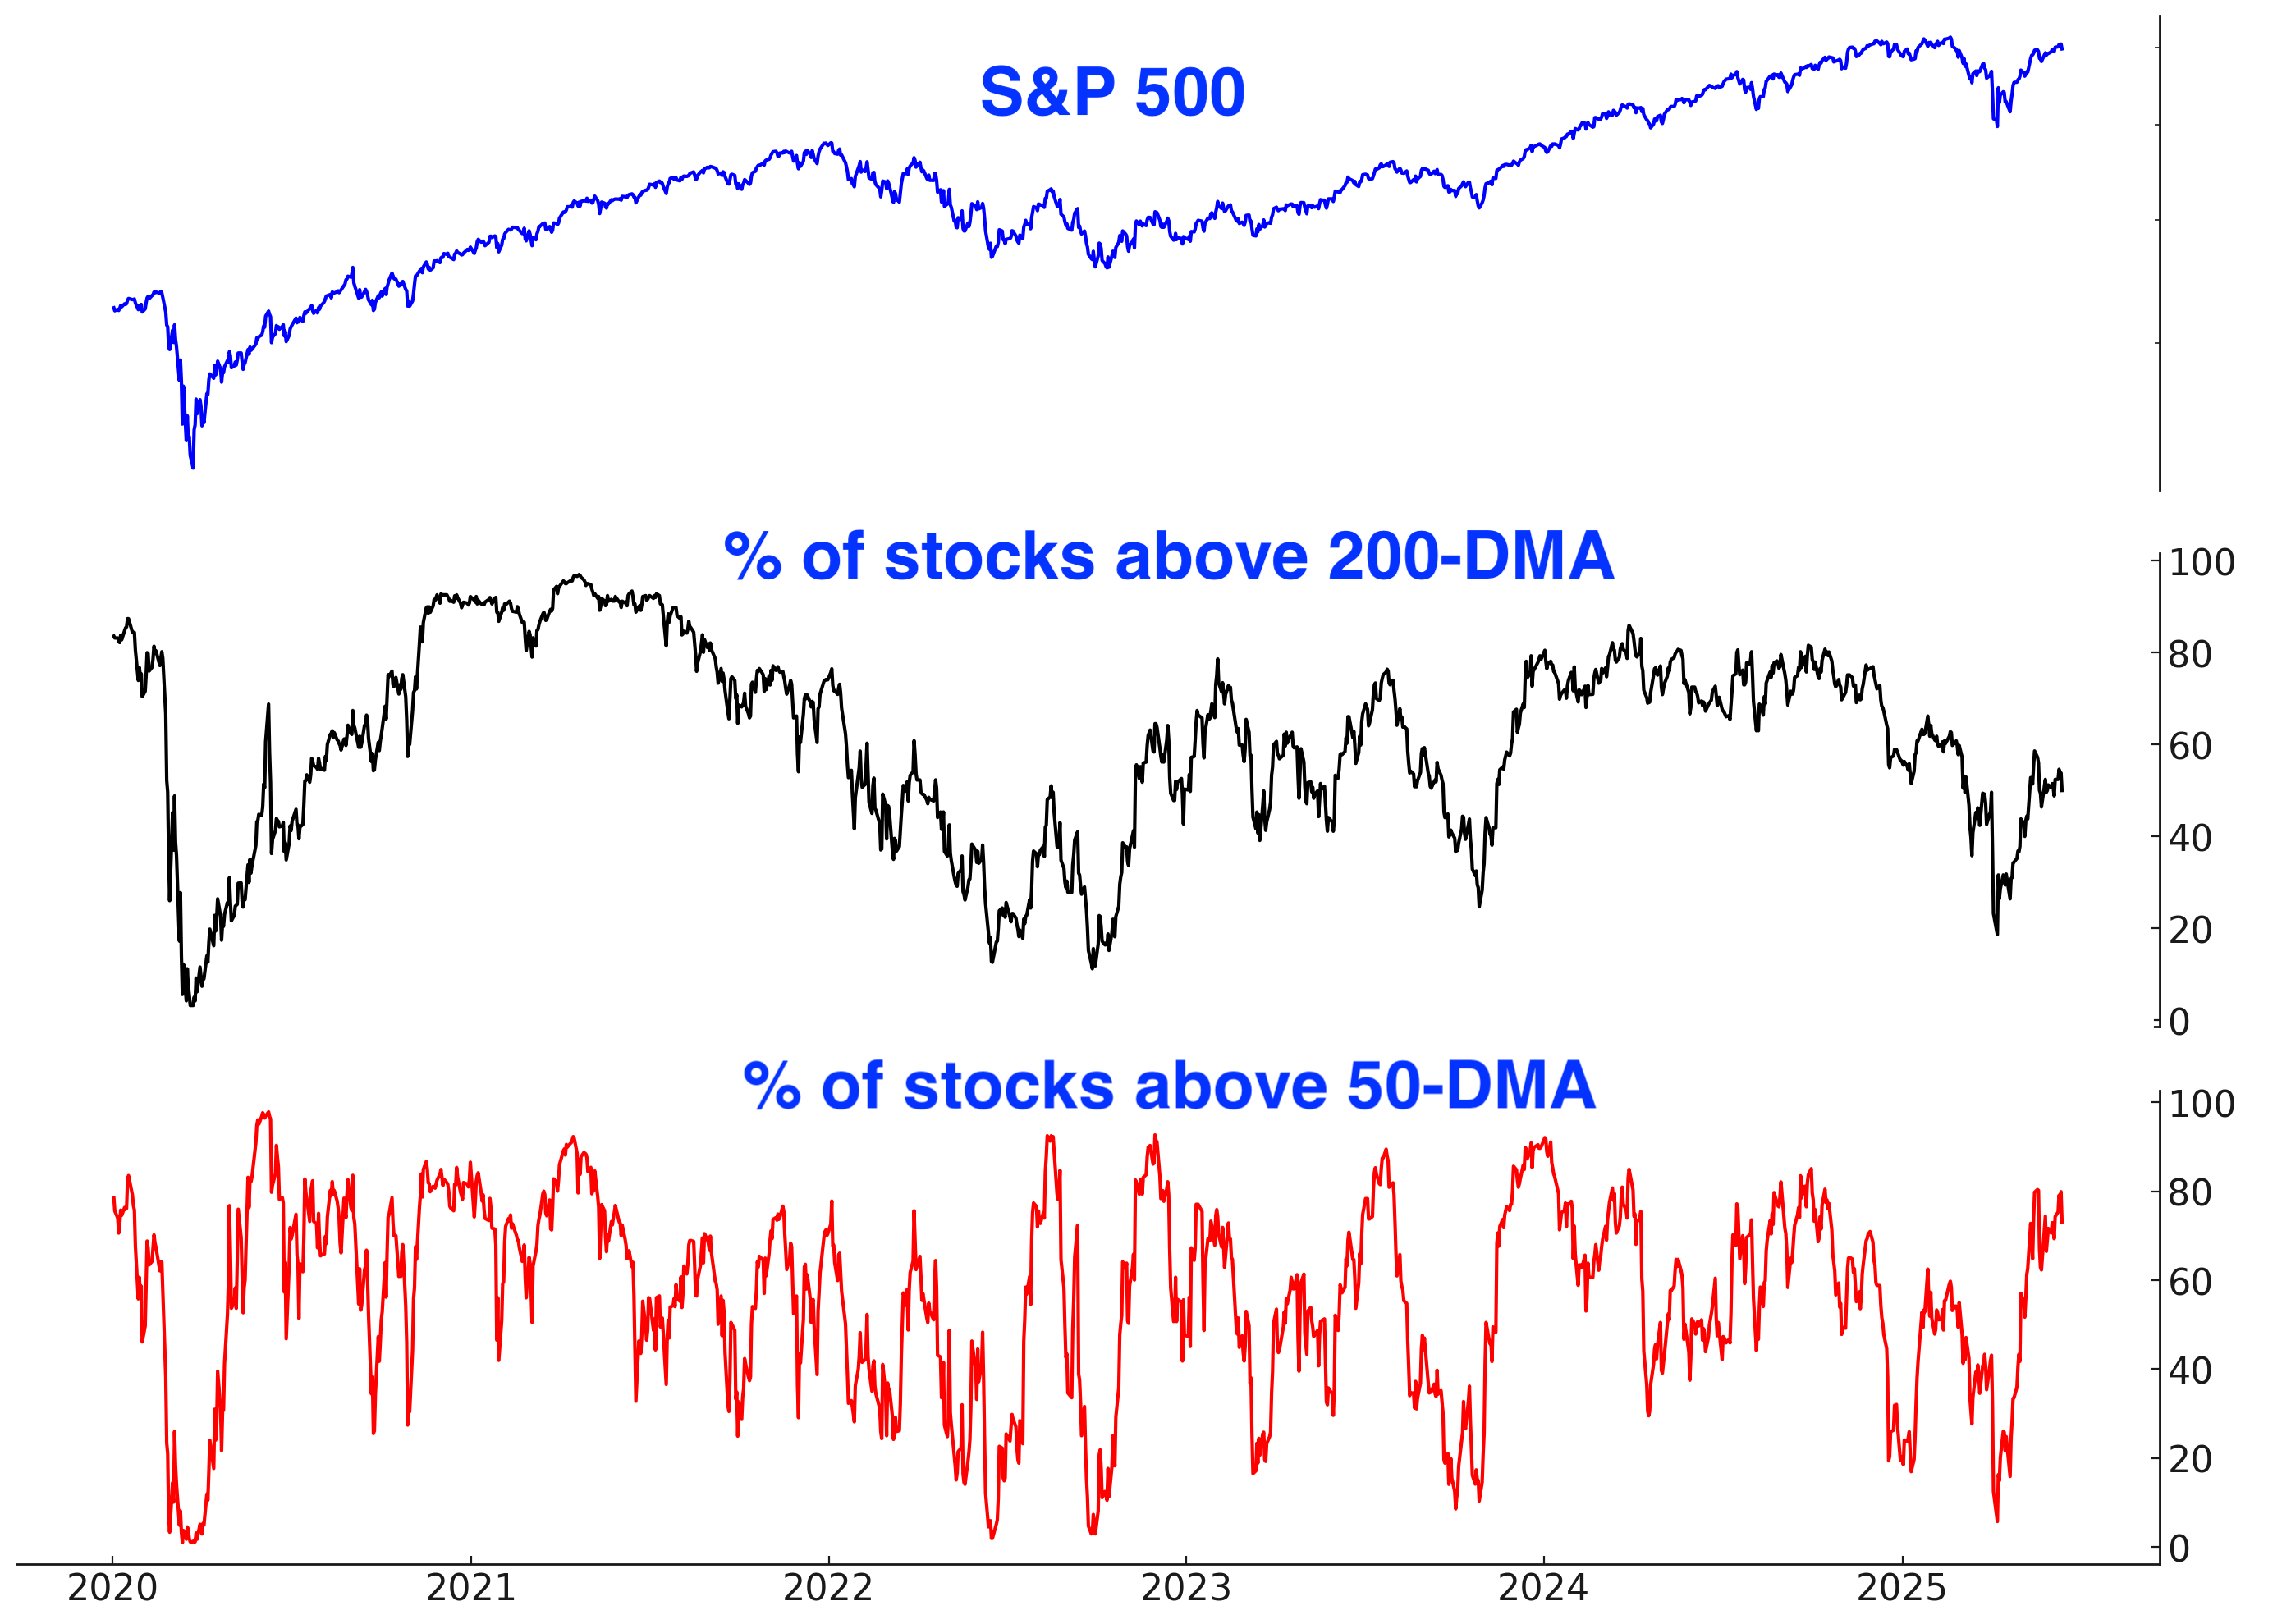
Here are the % of S&P 500 stocks above their 200 and 50 day moving averages.
*These popular breadth indicators usually track the S&P’s distance from its 200 and 50 day moving averages. The logic is simple: the more stocks above the 200-DMA, the more the S&P will be above its 200-DMA. The more stocks below the 200-DMA, the more the S&P will be below its 200-DMA.
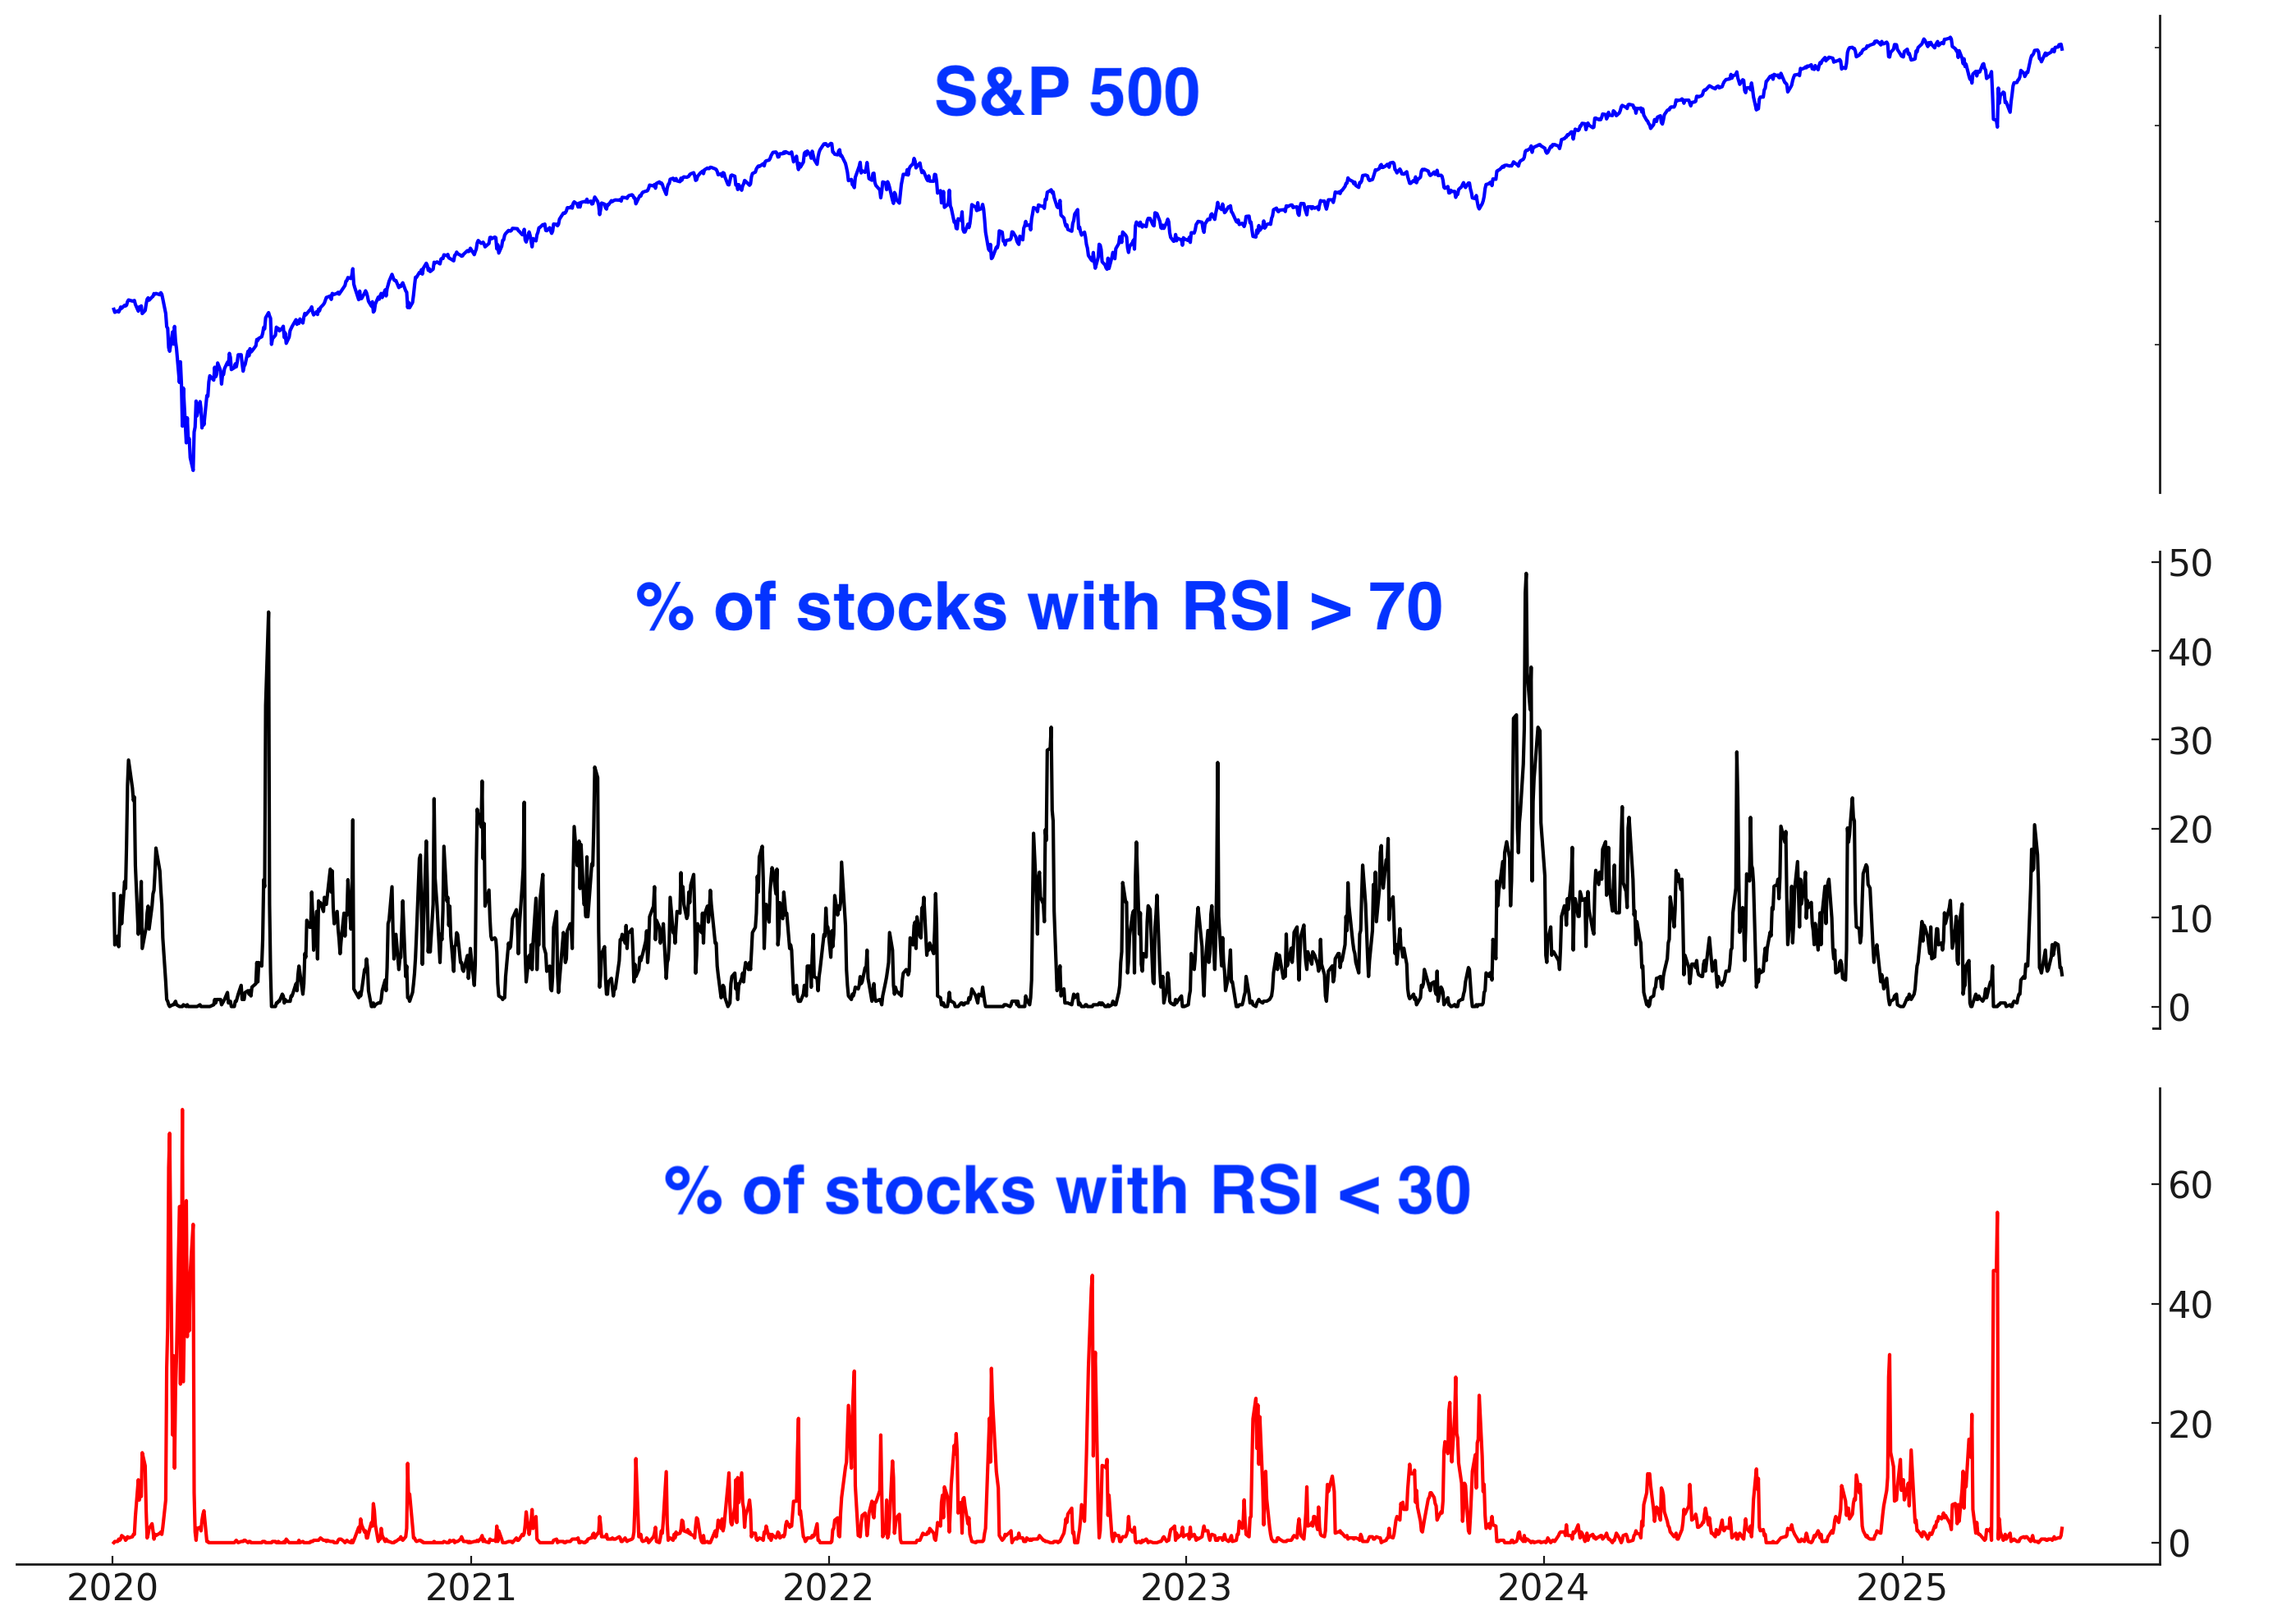
Few S&P 500 stocks are oversold or overbought, which is no surprise after the past few weeks’ choppy price action washed out momentum:
Other Sentiment
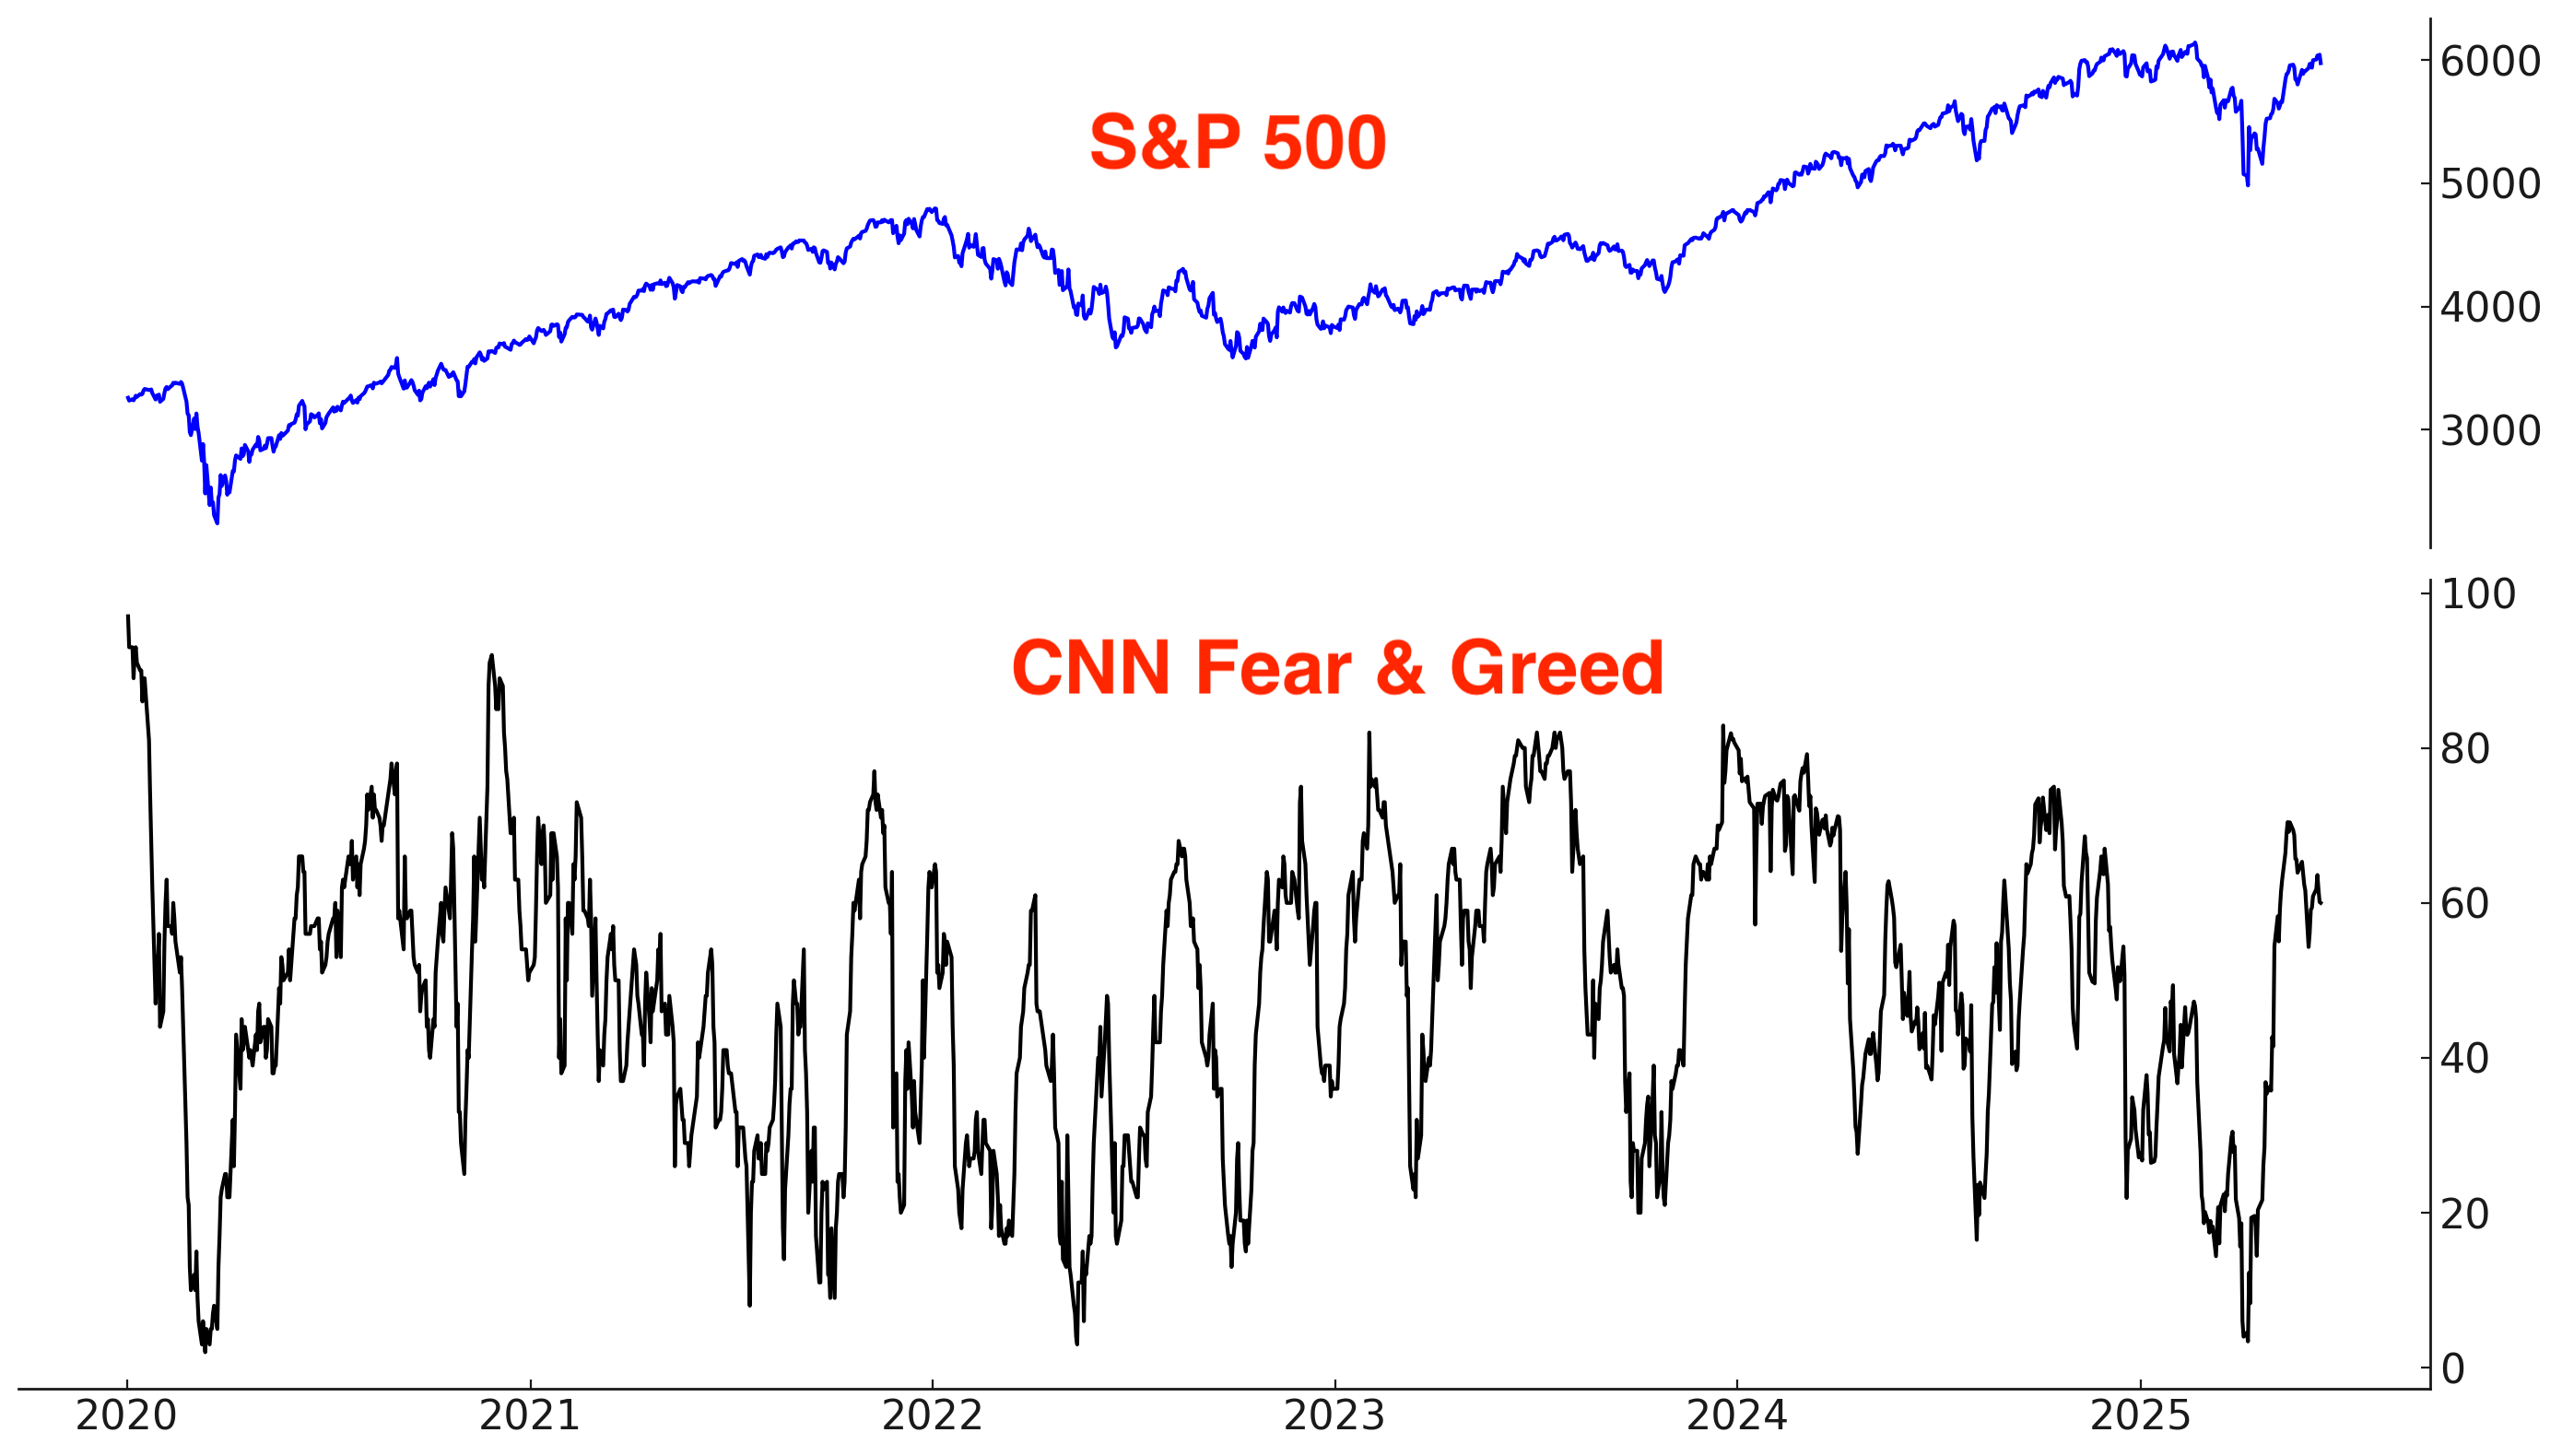
The CNN Fear & Greed indicator remains elevated, but isn’t in “extreme greed” territory:
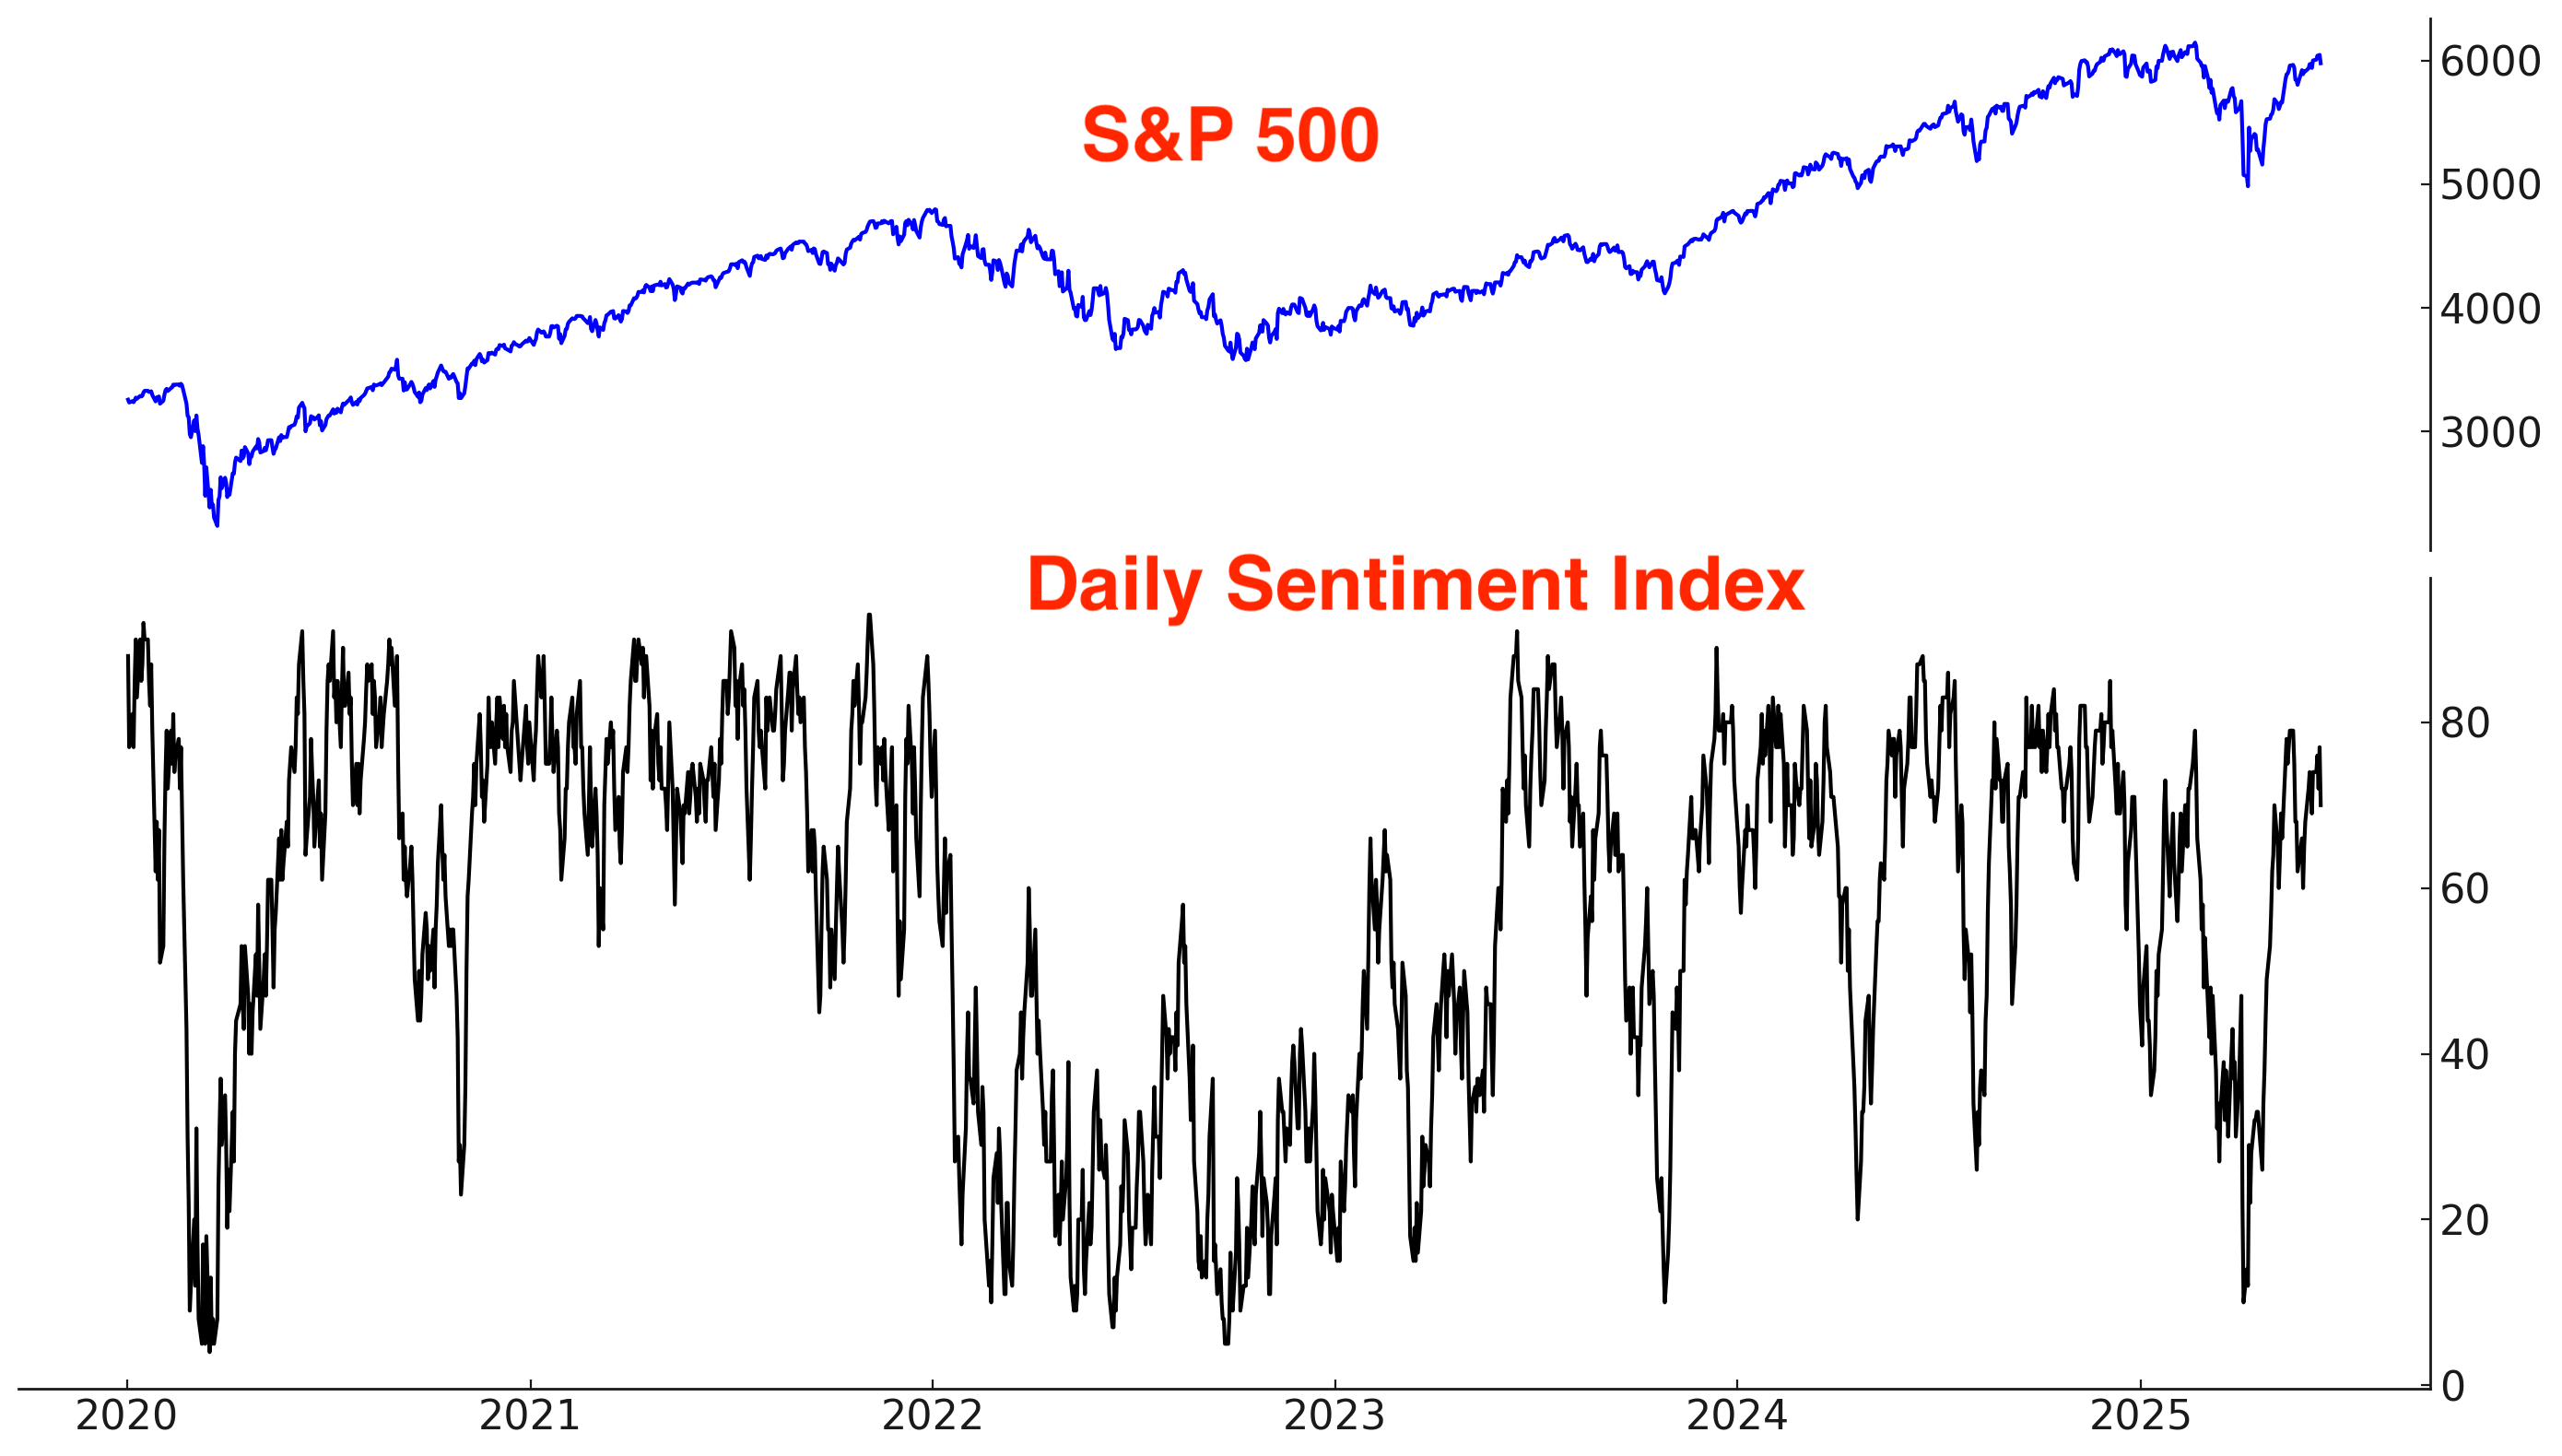
Likewise, the S&P 500’s Daily Sentiment Index is elevated:
Corporate Insiders
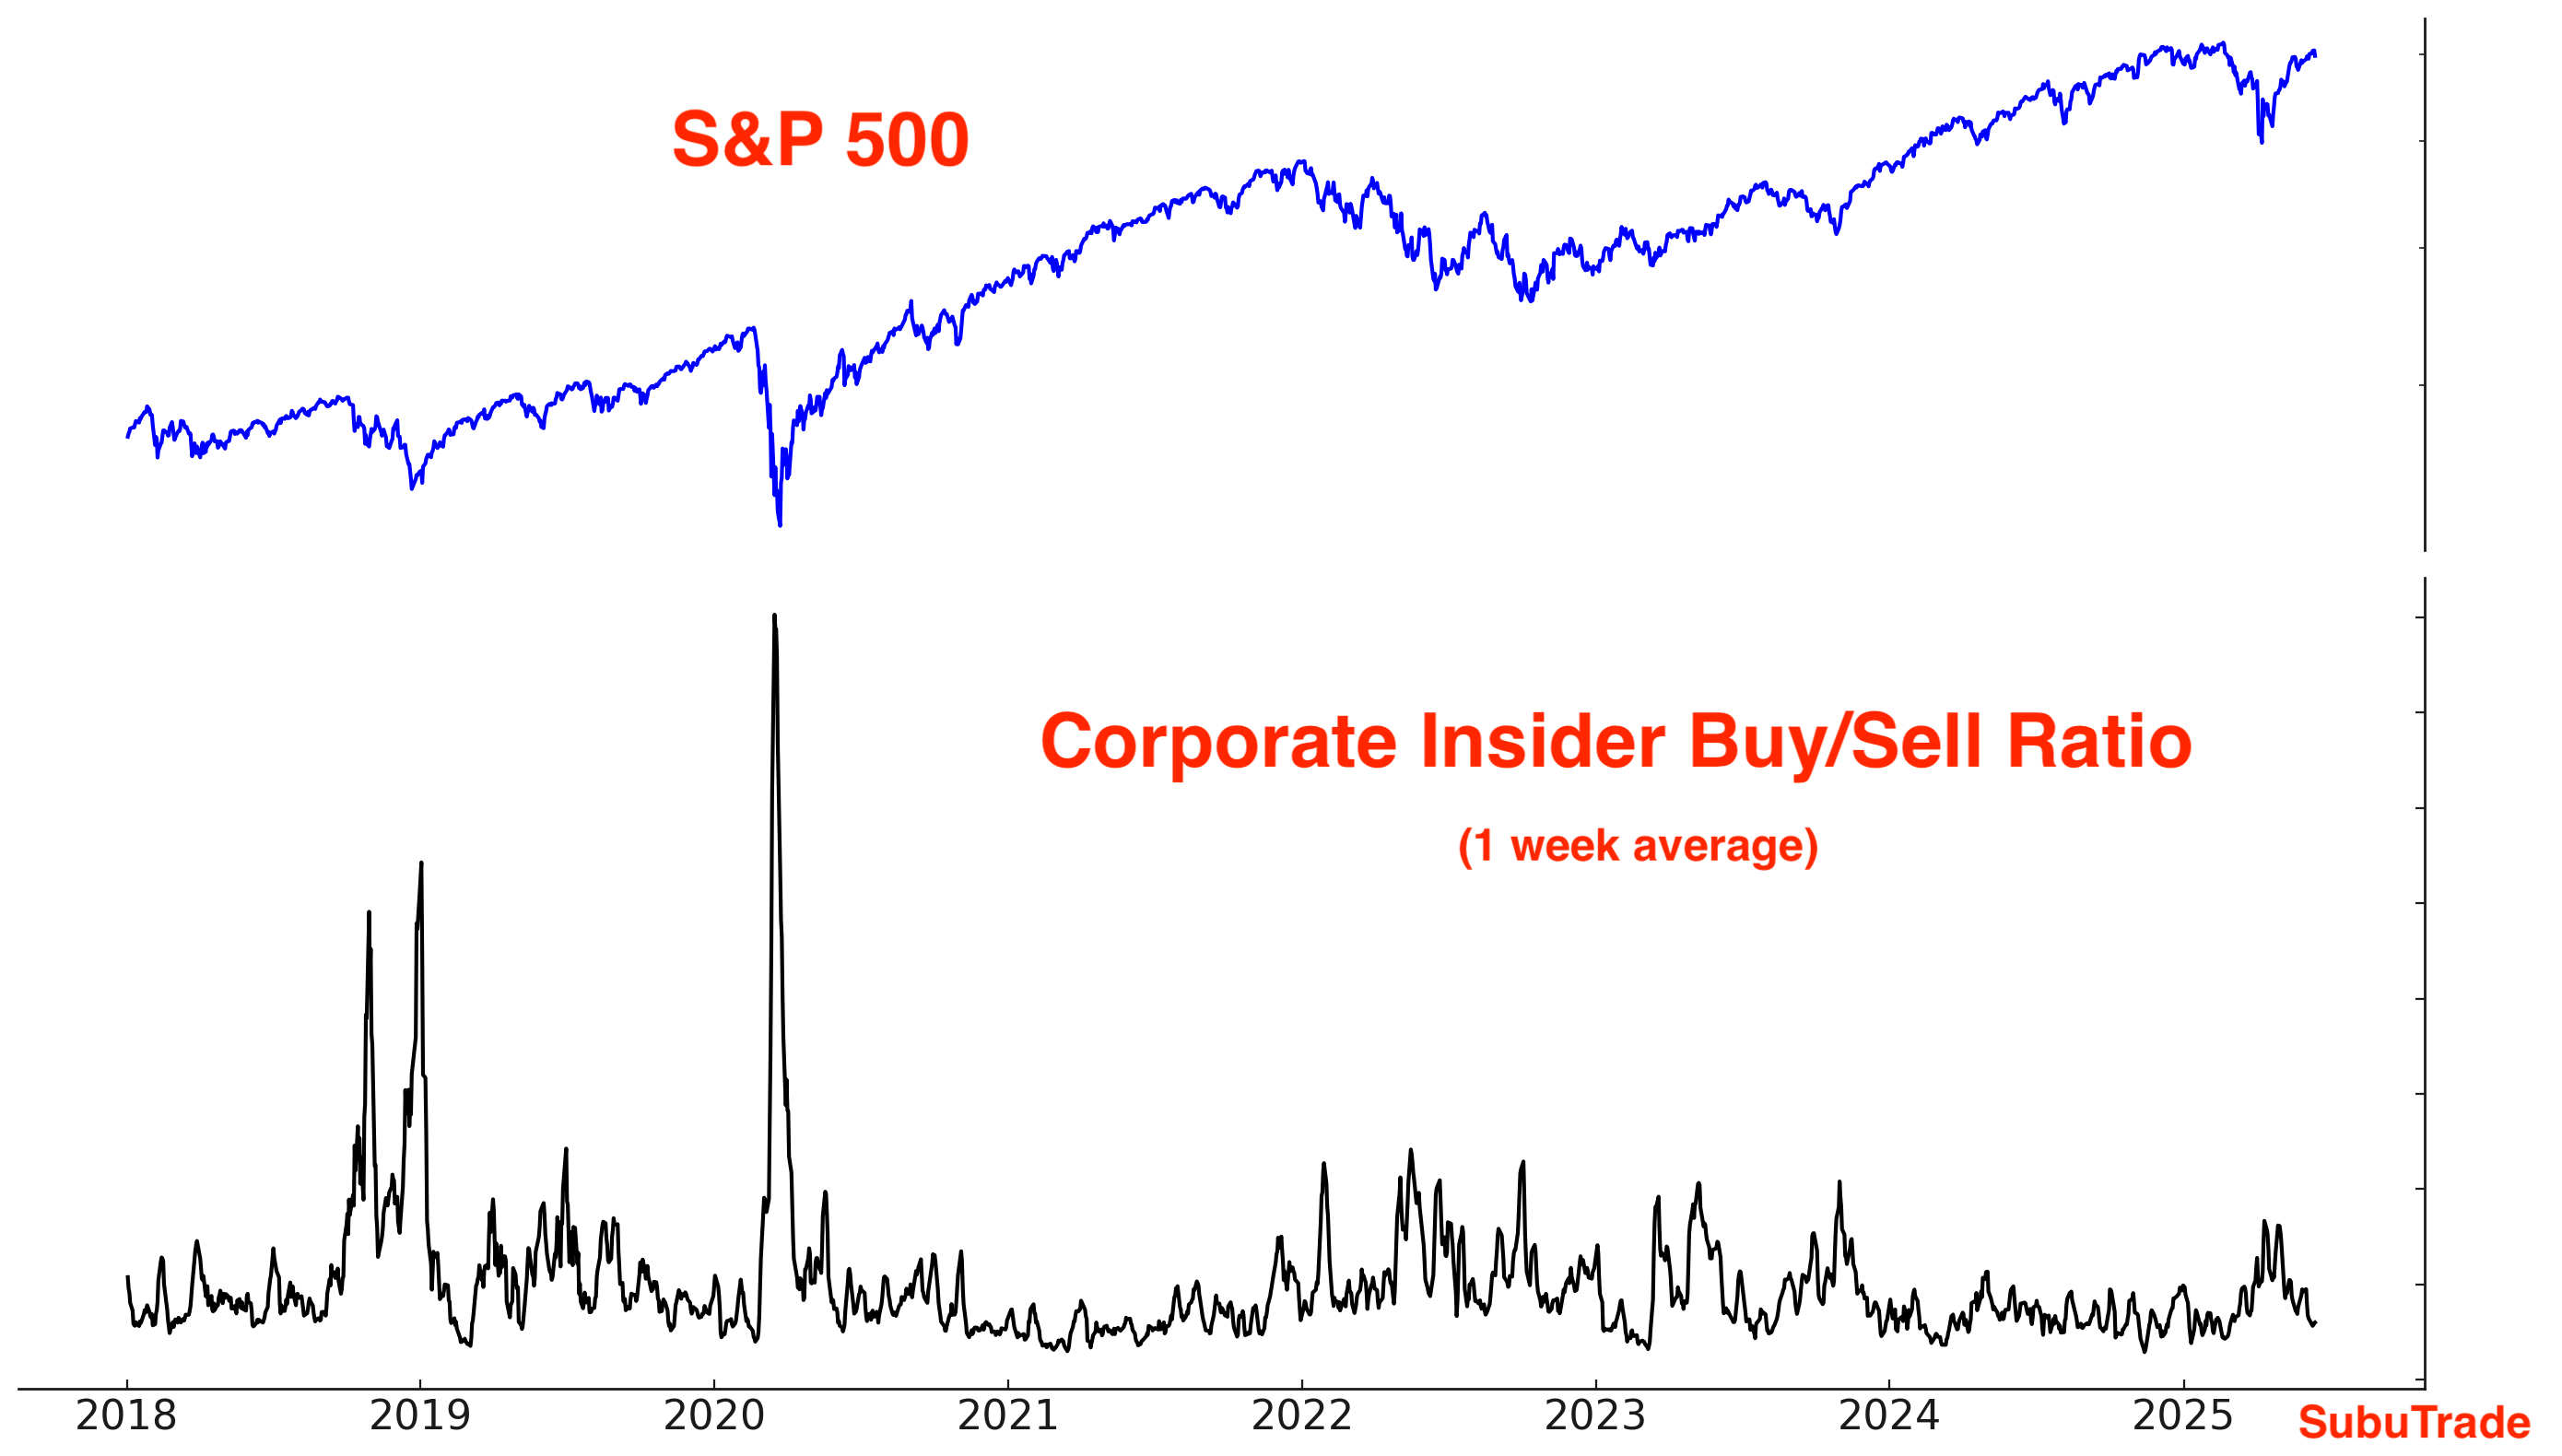
Not much change among corporate insiders:
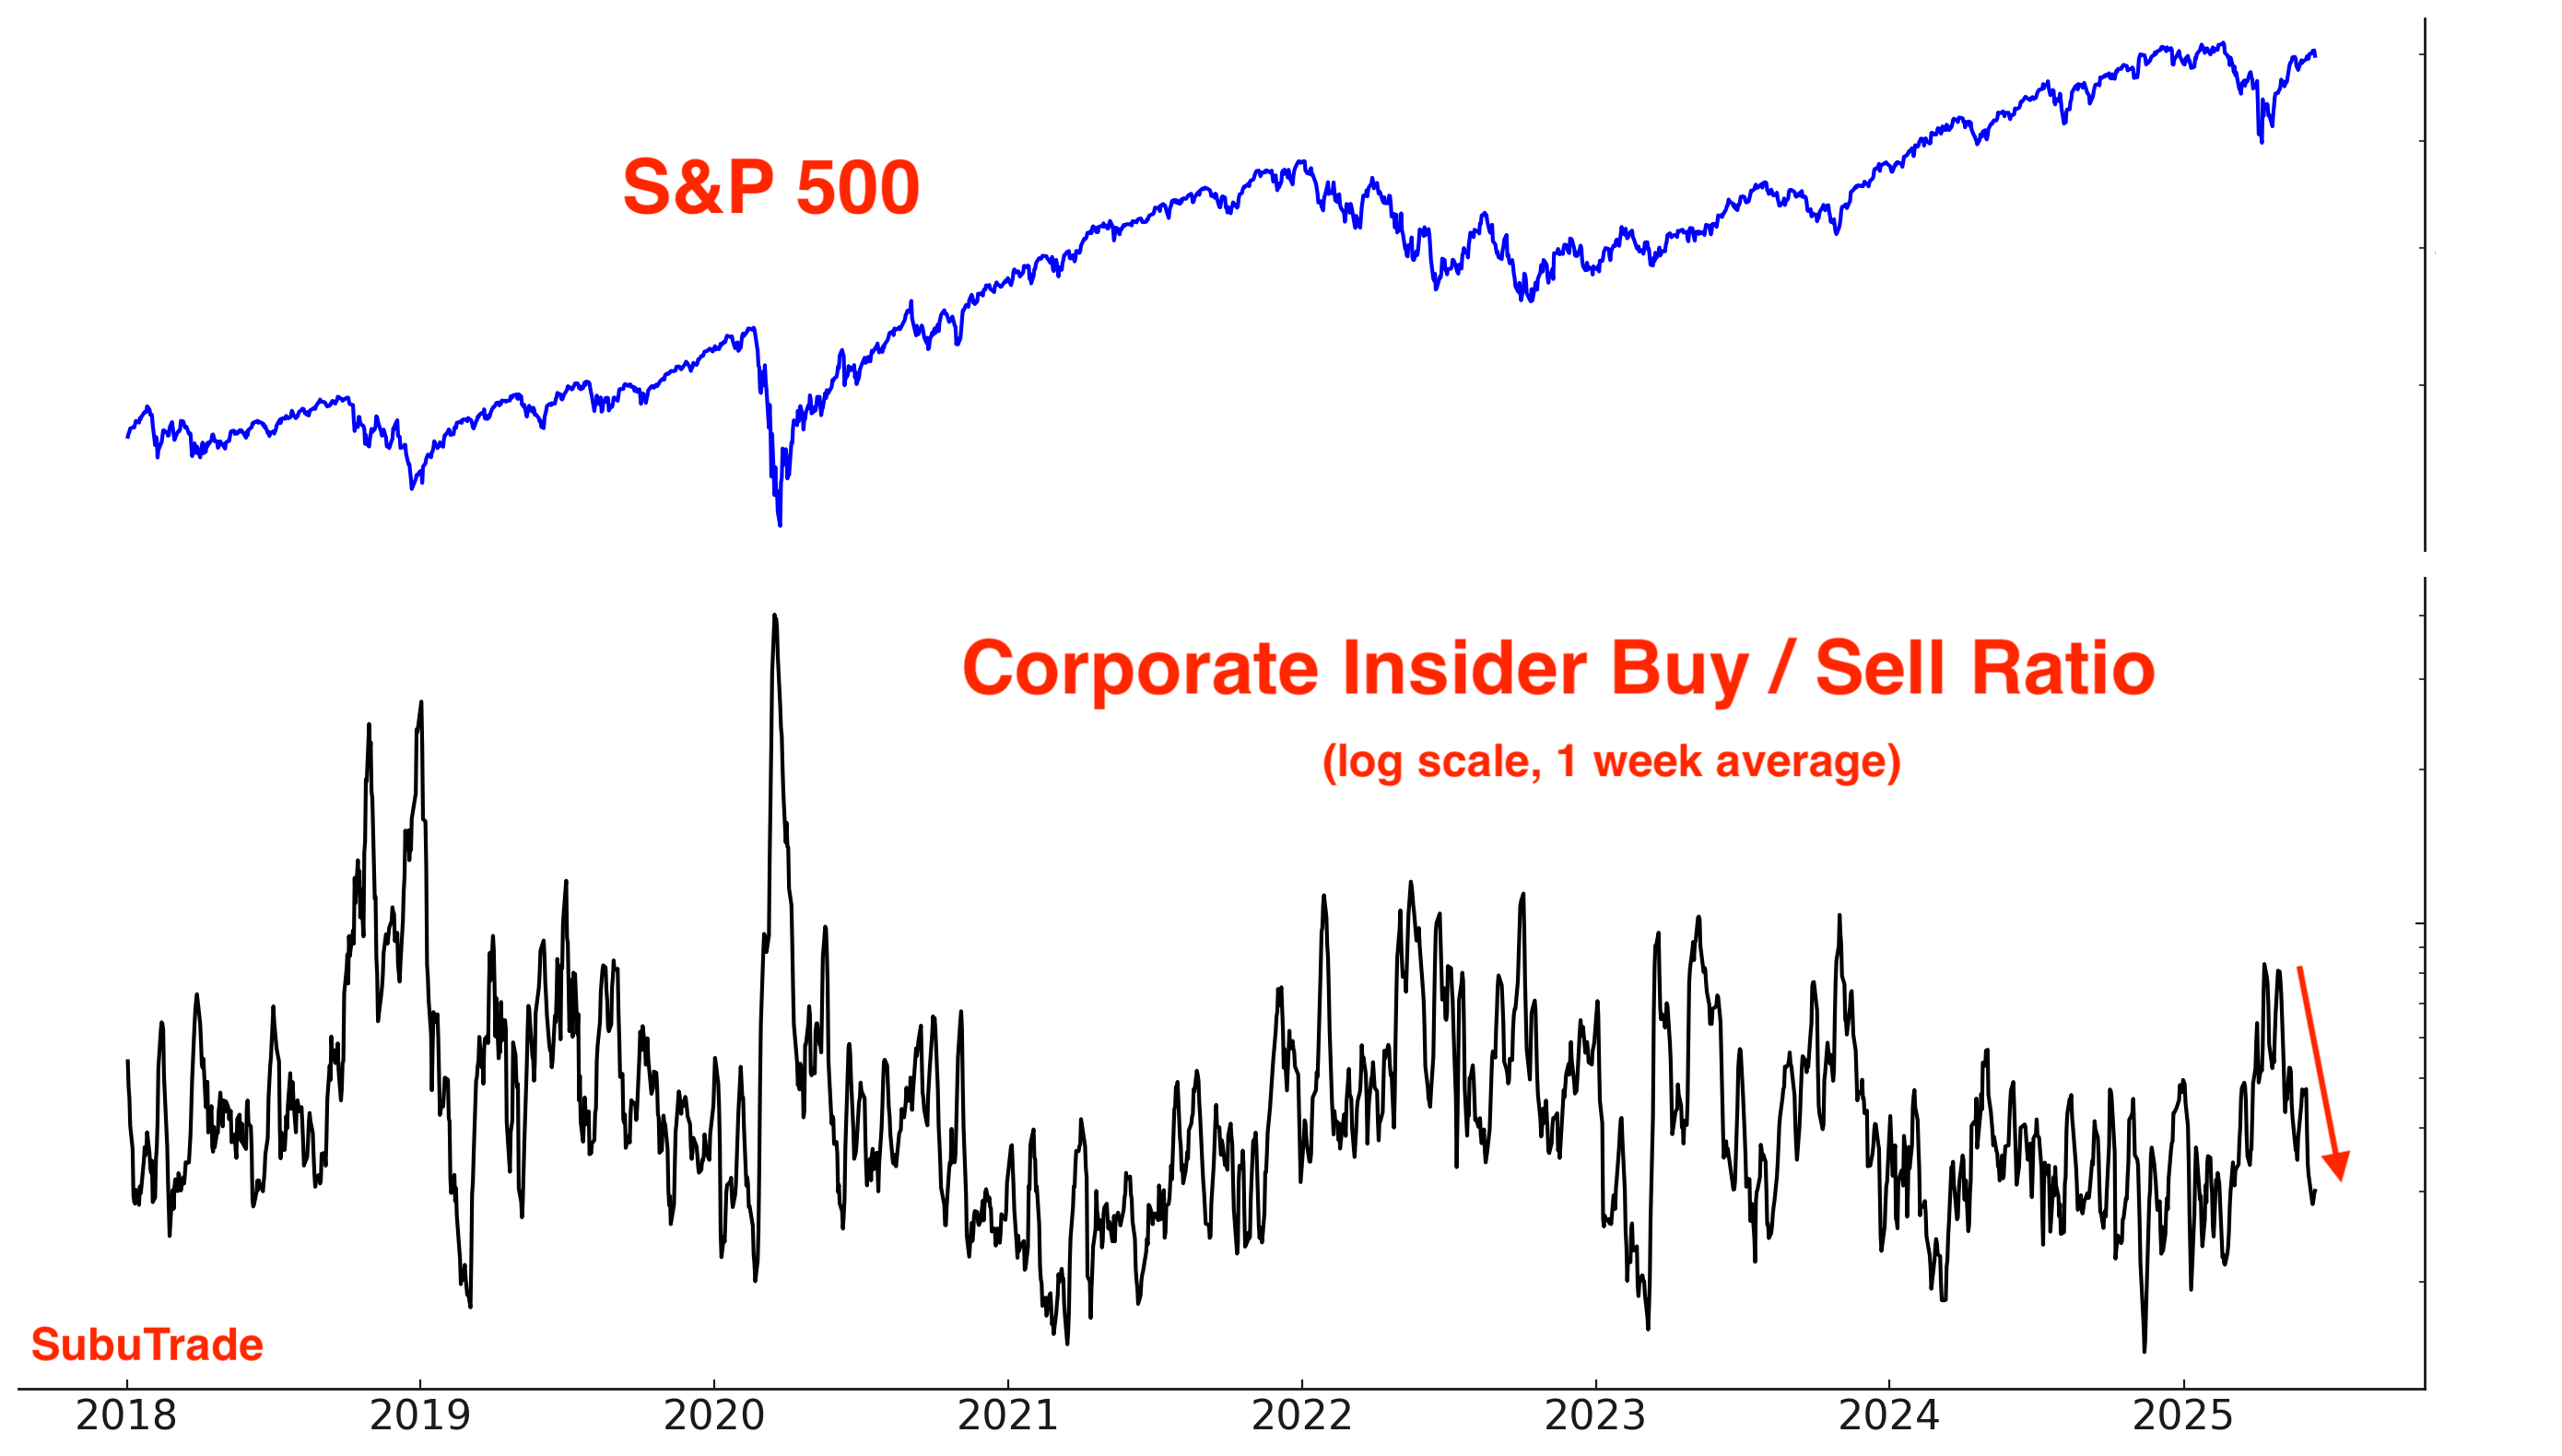
Same chart, but using a log scale for the Insider Buy/Sell Ratio:
Fund Flow
*Fund flows aren’t automatically contrarian. It depends on what type of trader is buying/selling and why. Some ETFs are traded by mean-reversion traders, while other ETFs are traded by trend followers. Moreover, many ETFs are small relative to the underlying market, so fund flows don’t always reflect broad sentiment towards that market.
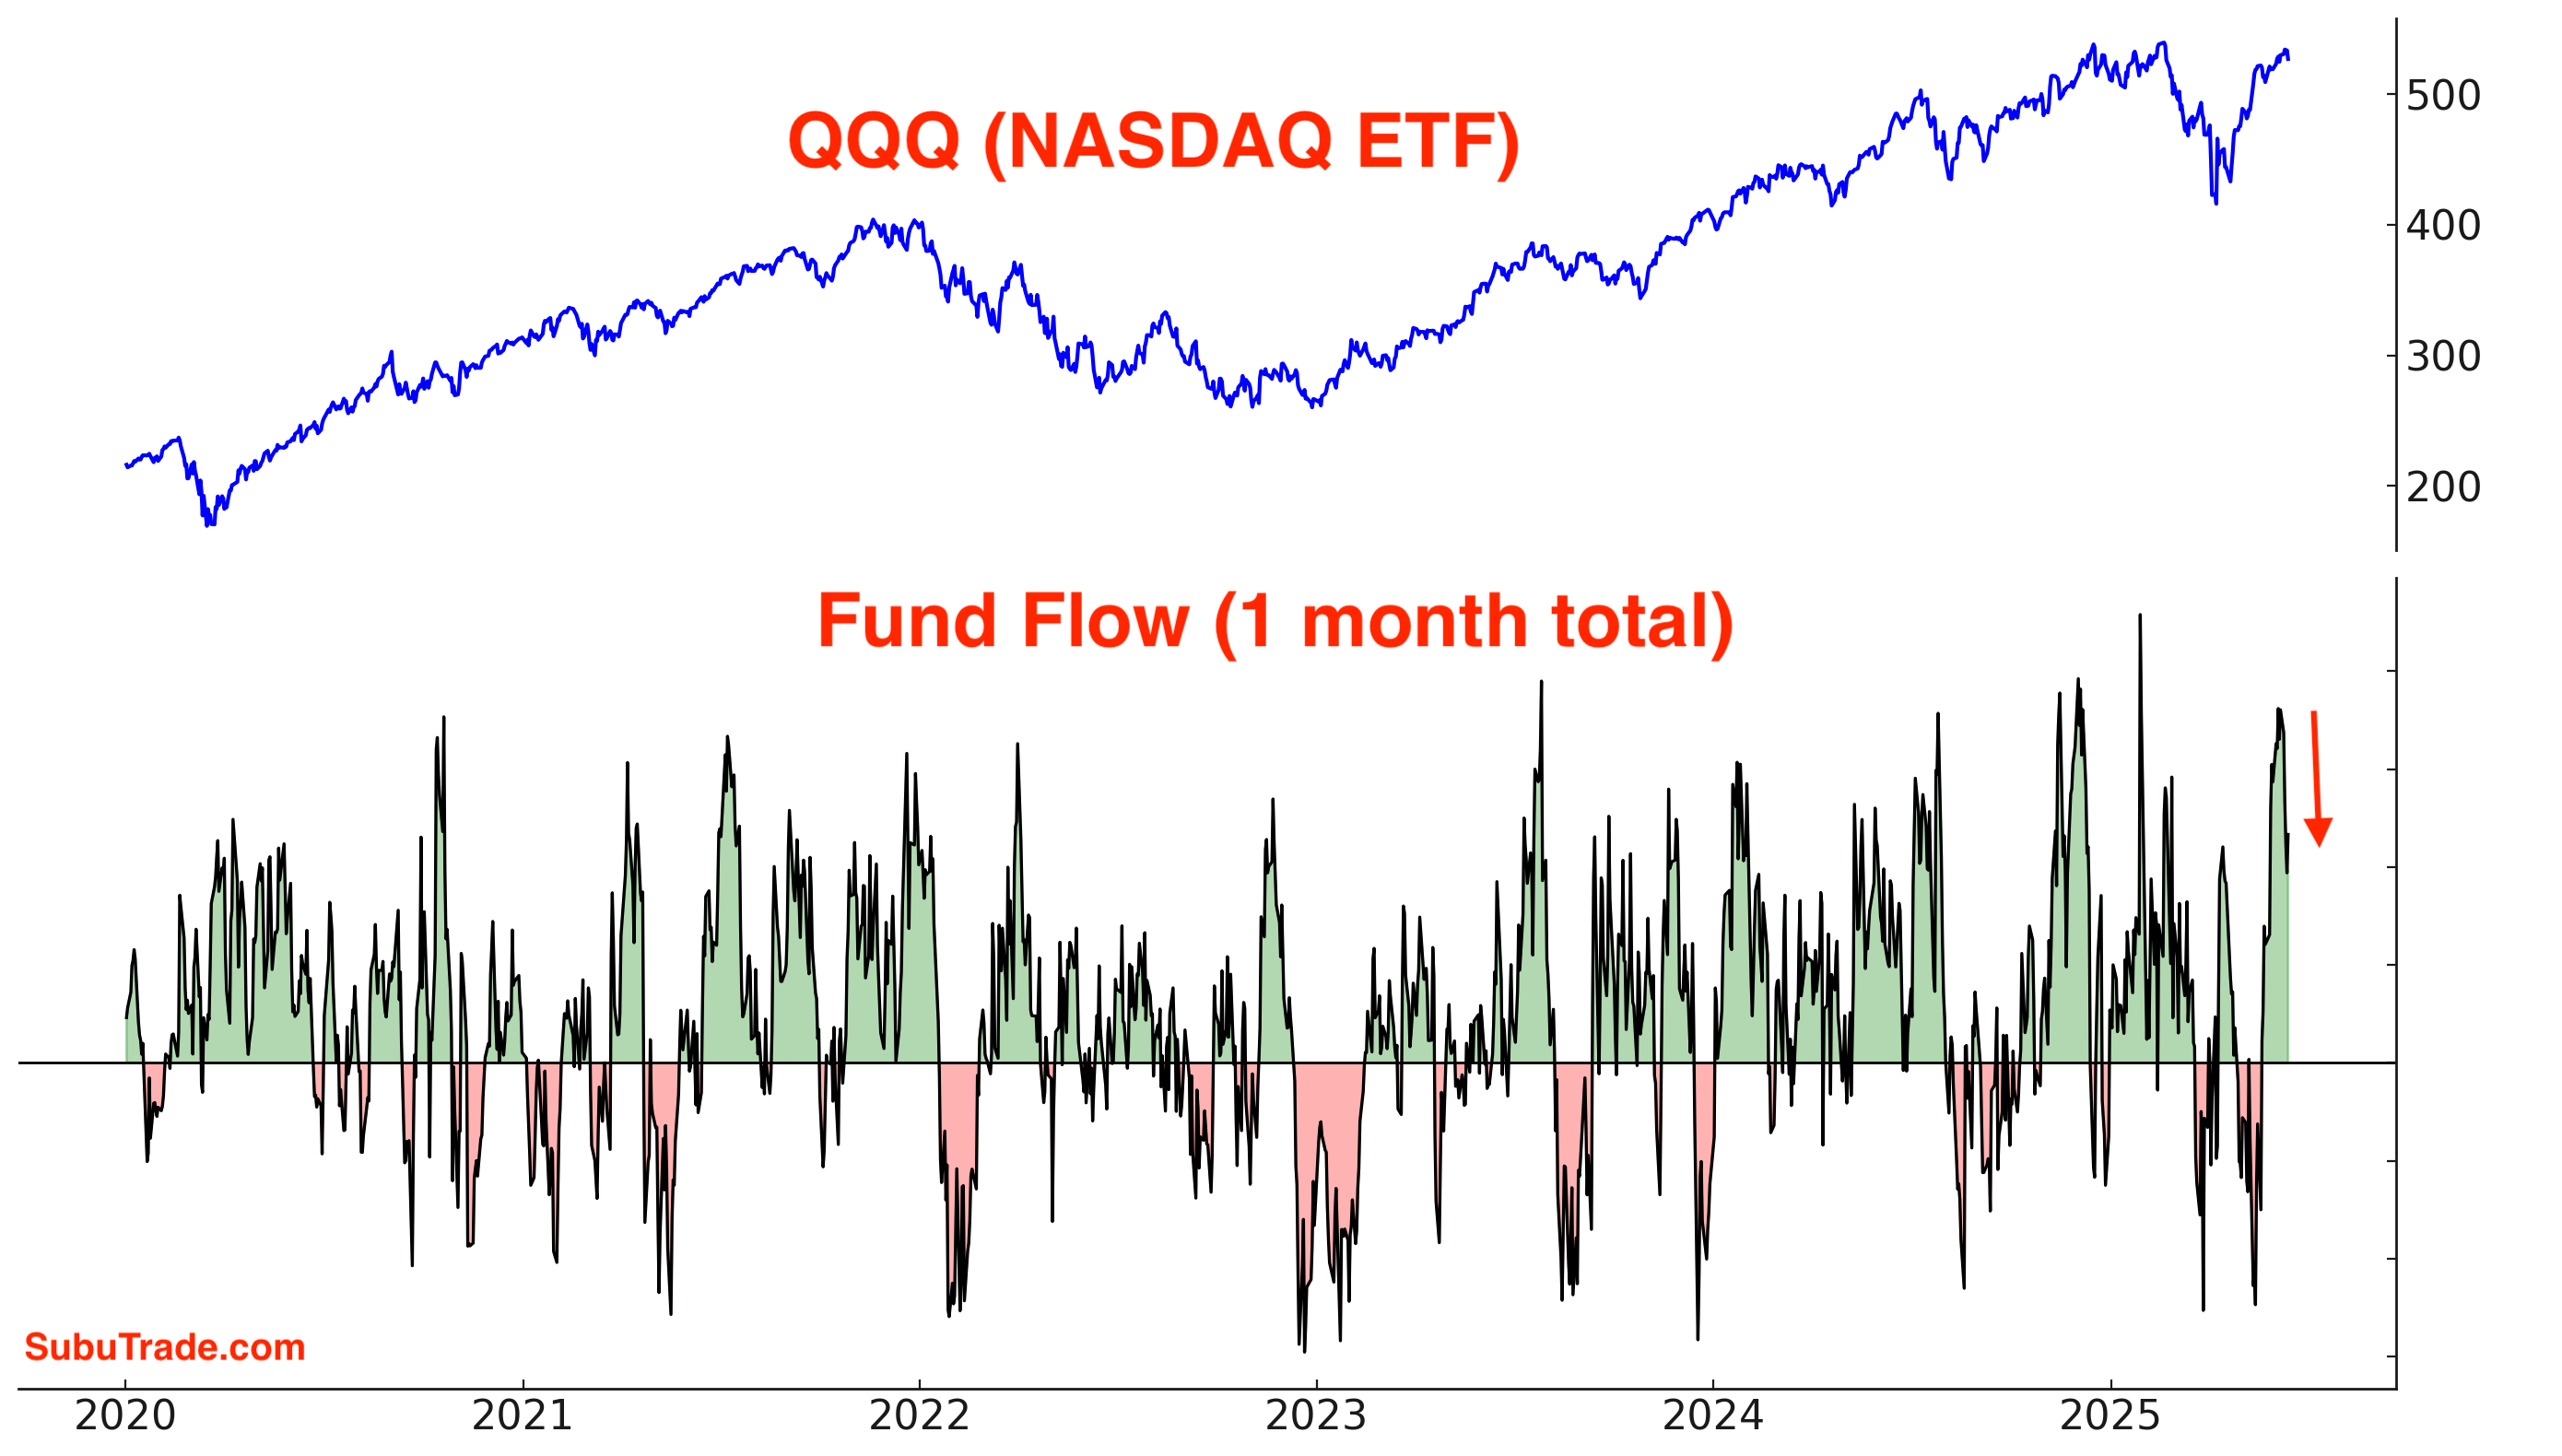
Inflows into QQQ (NASDAQ ETF) are slowing down:
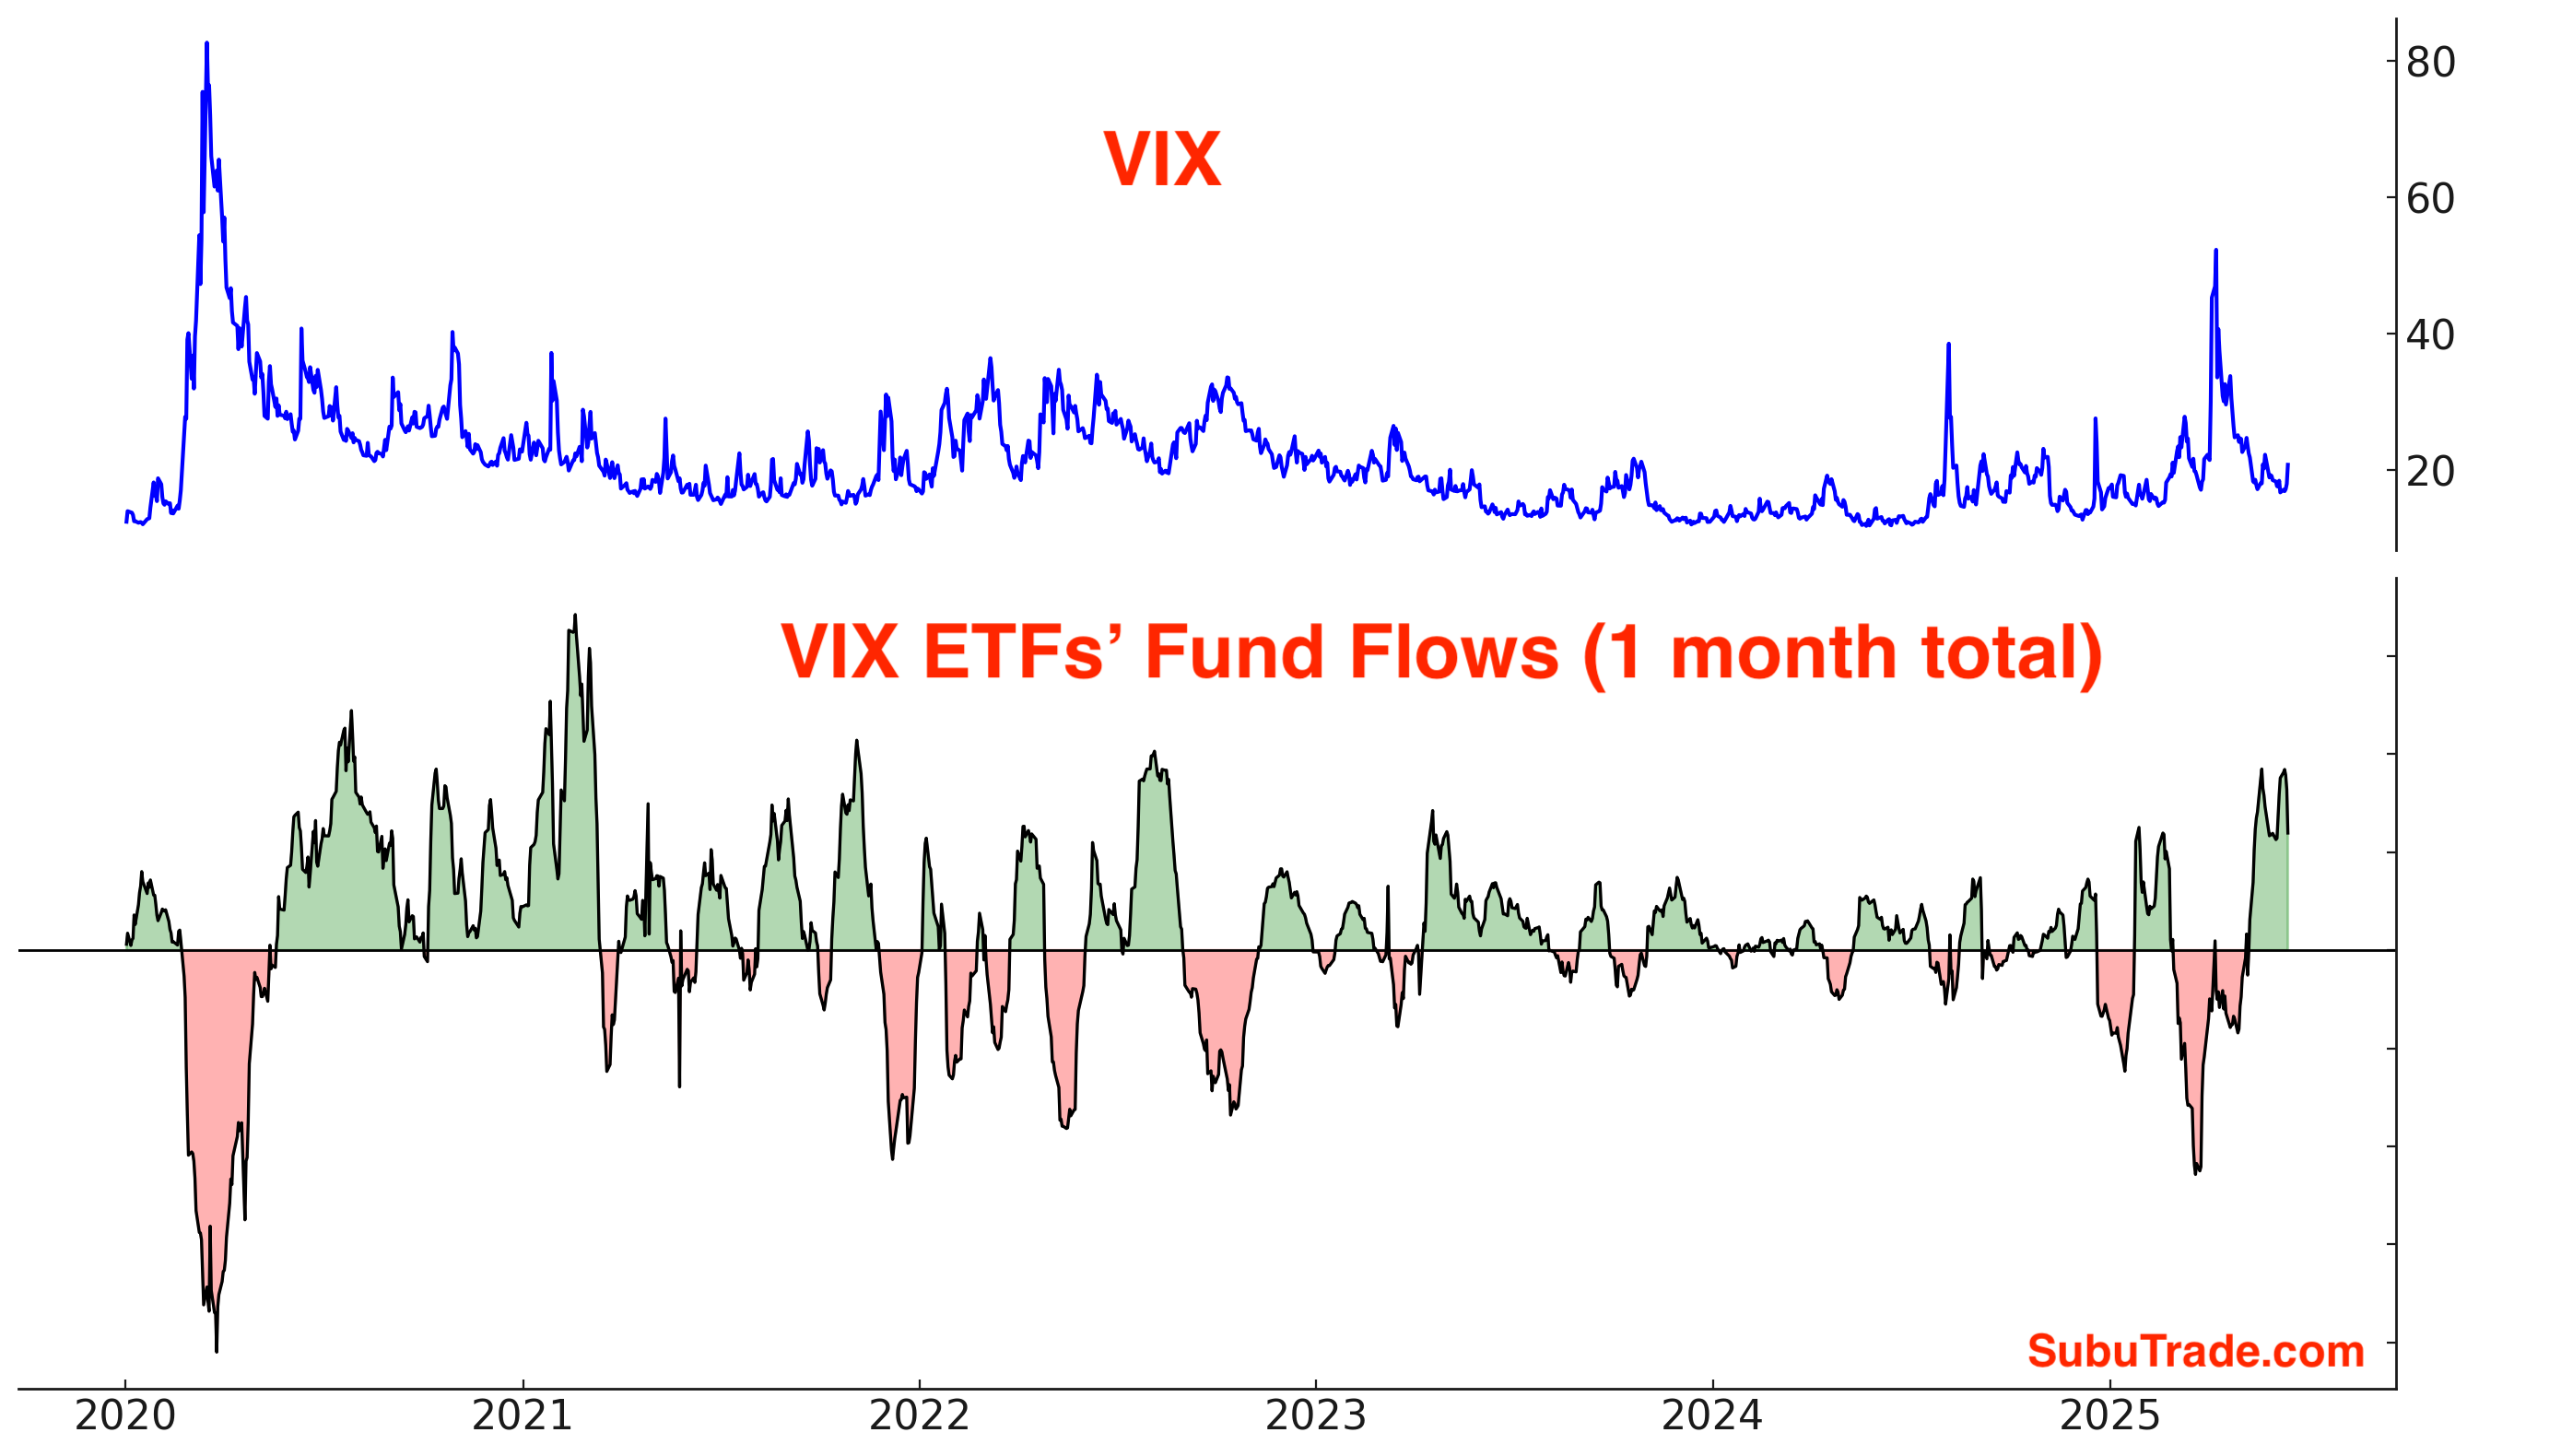
VIX ETFs are often traded by mean-reversion traders; they buy when VIX is low and sell (take profits) when VIX is high.
VIX ETFs continue to see inflows, which suggests that these mean-reversion traders are betting on a jump in volatility:
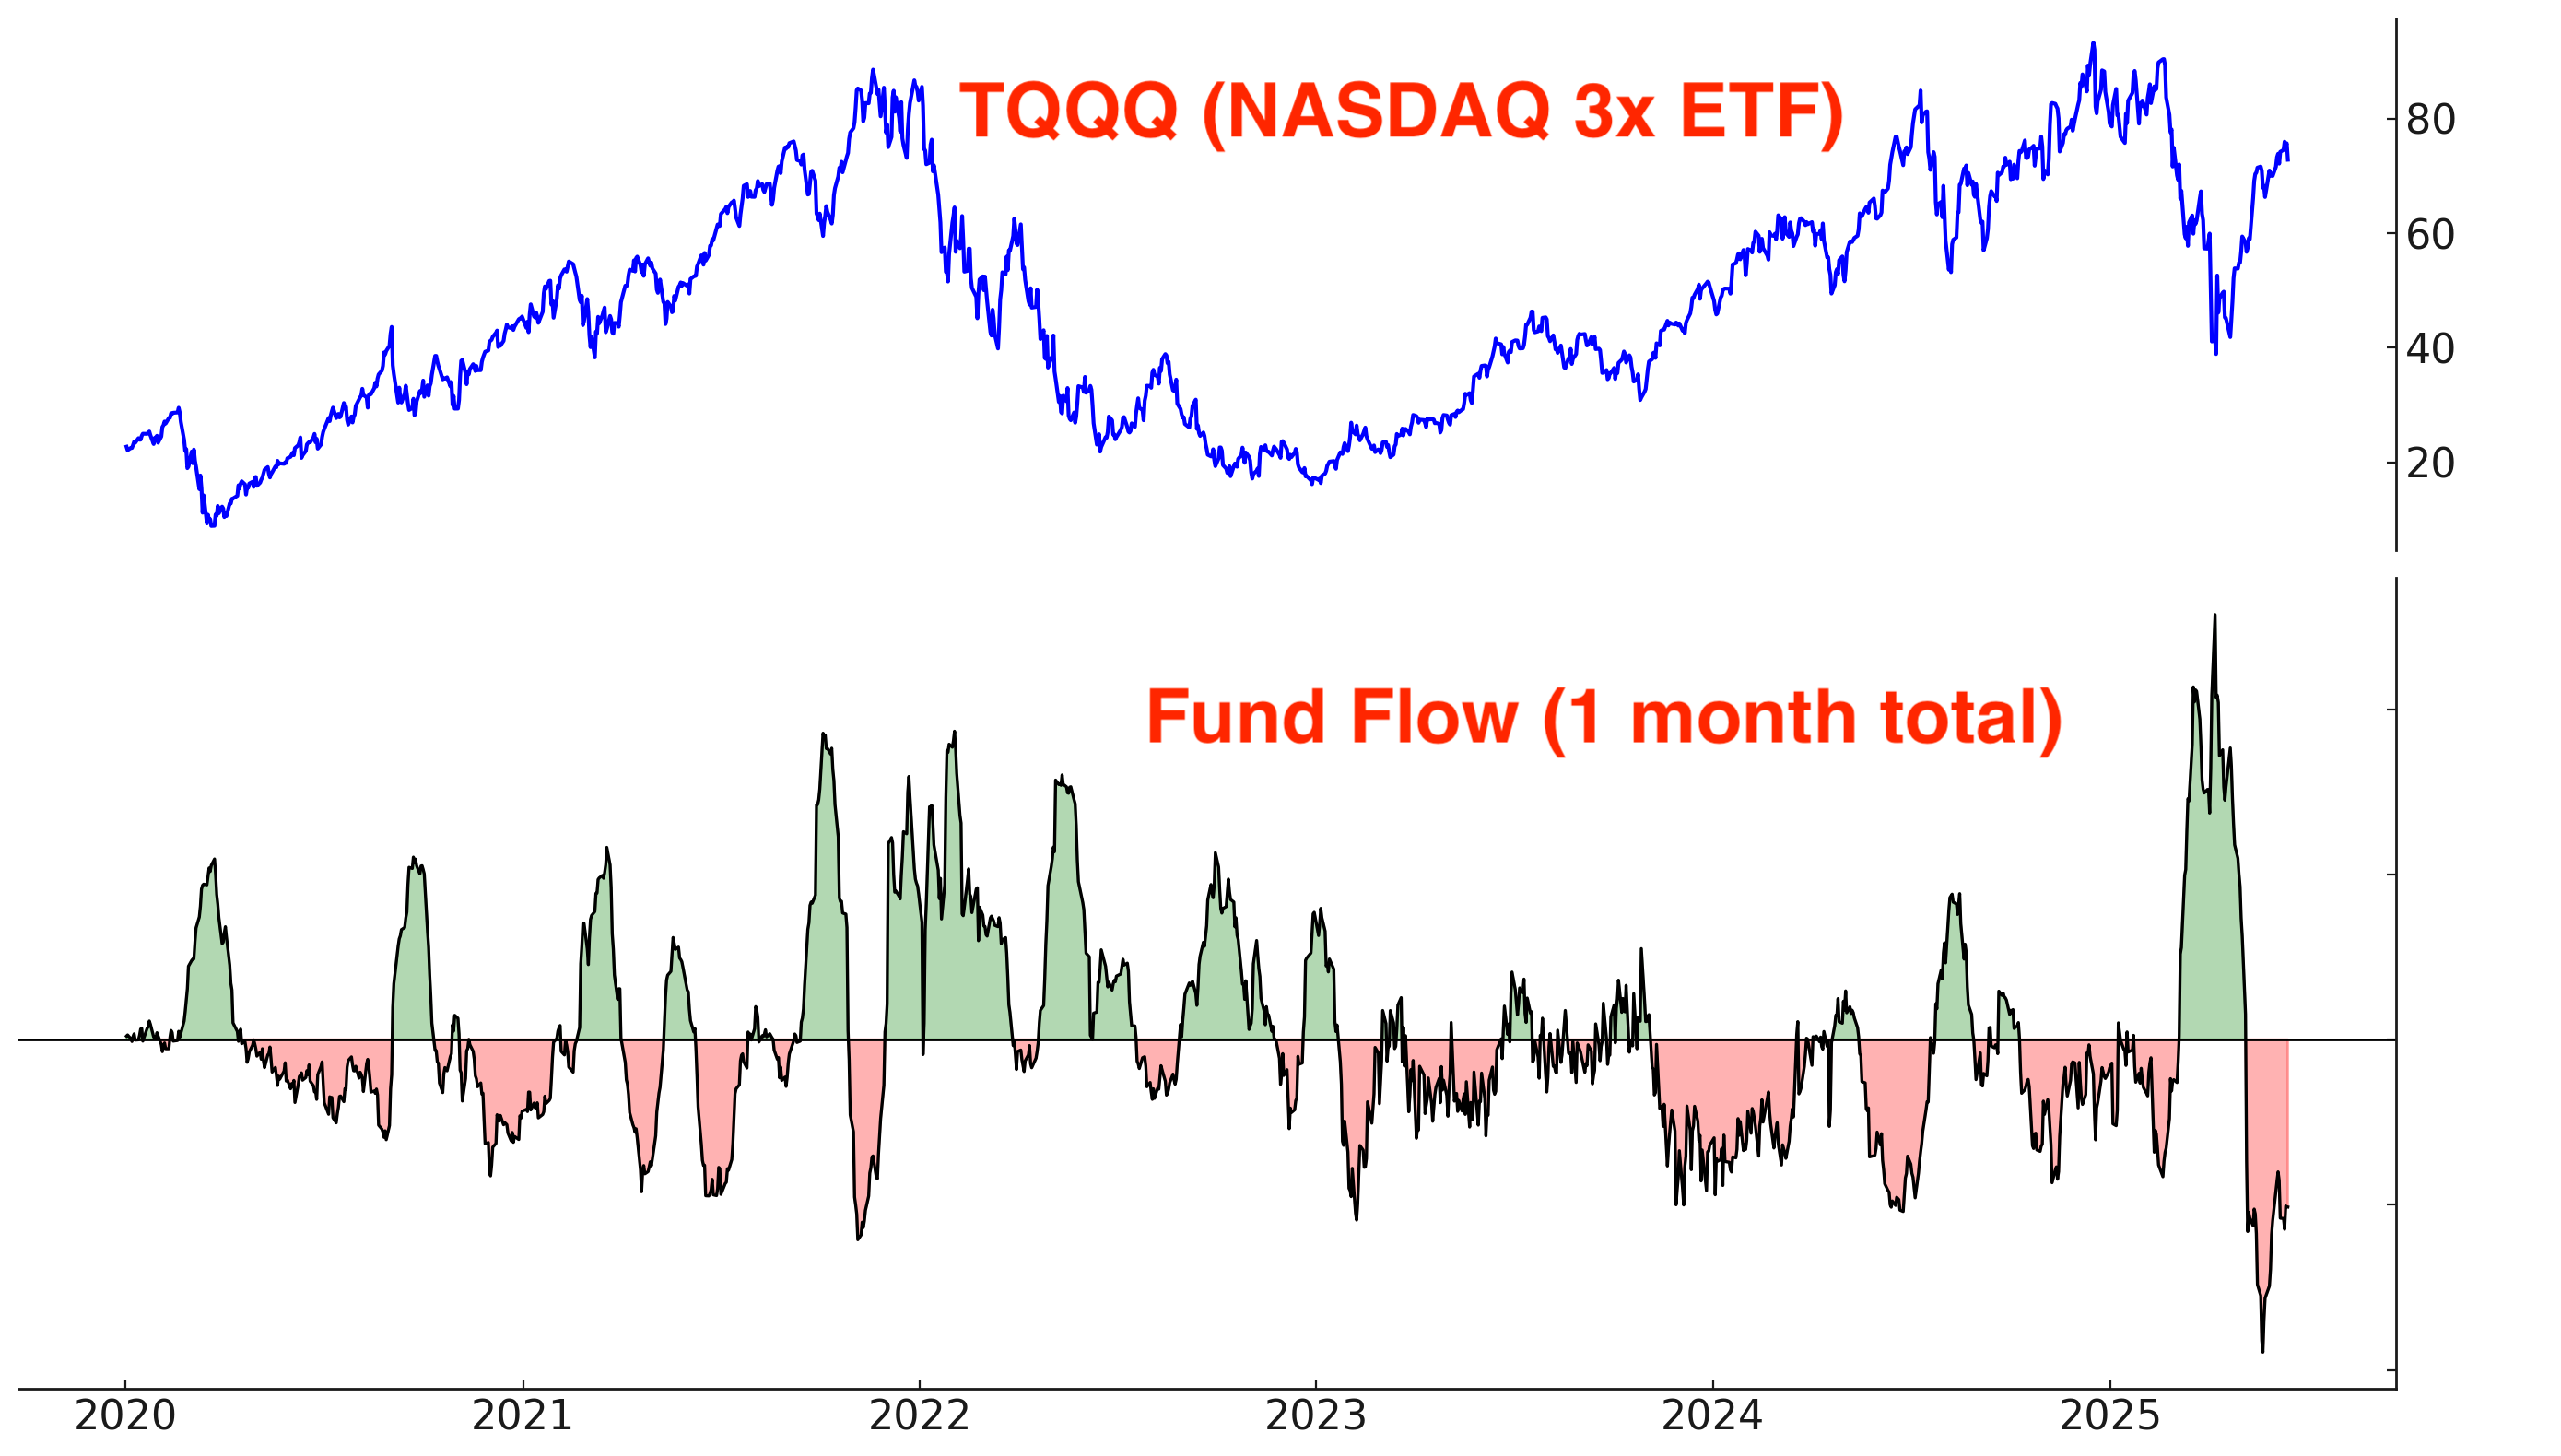
TQQQ is also traded by mean-reversion traders who buy when TQQQ falls and sell (take profits) when TQQQ rallies.
TQQQ is still seeing outflows, which suggests that these mean-reversion traders are still taking profits:
Trend
The trend is your friend, until it ends. Stocks continue to trend higher:
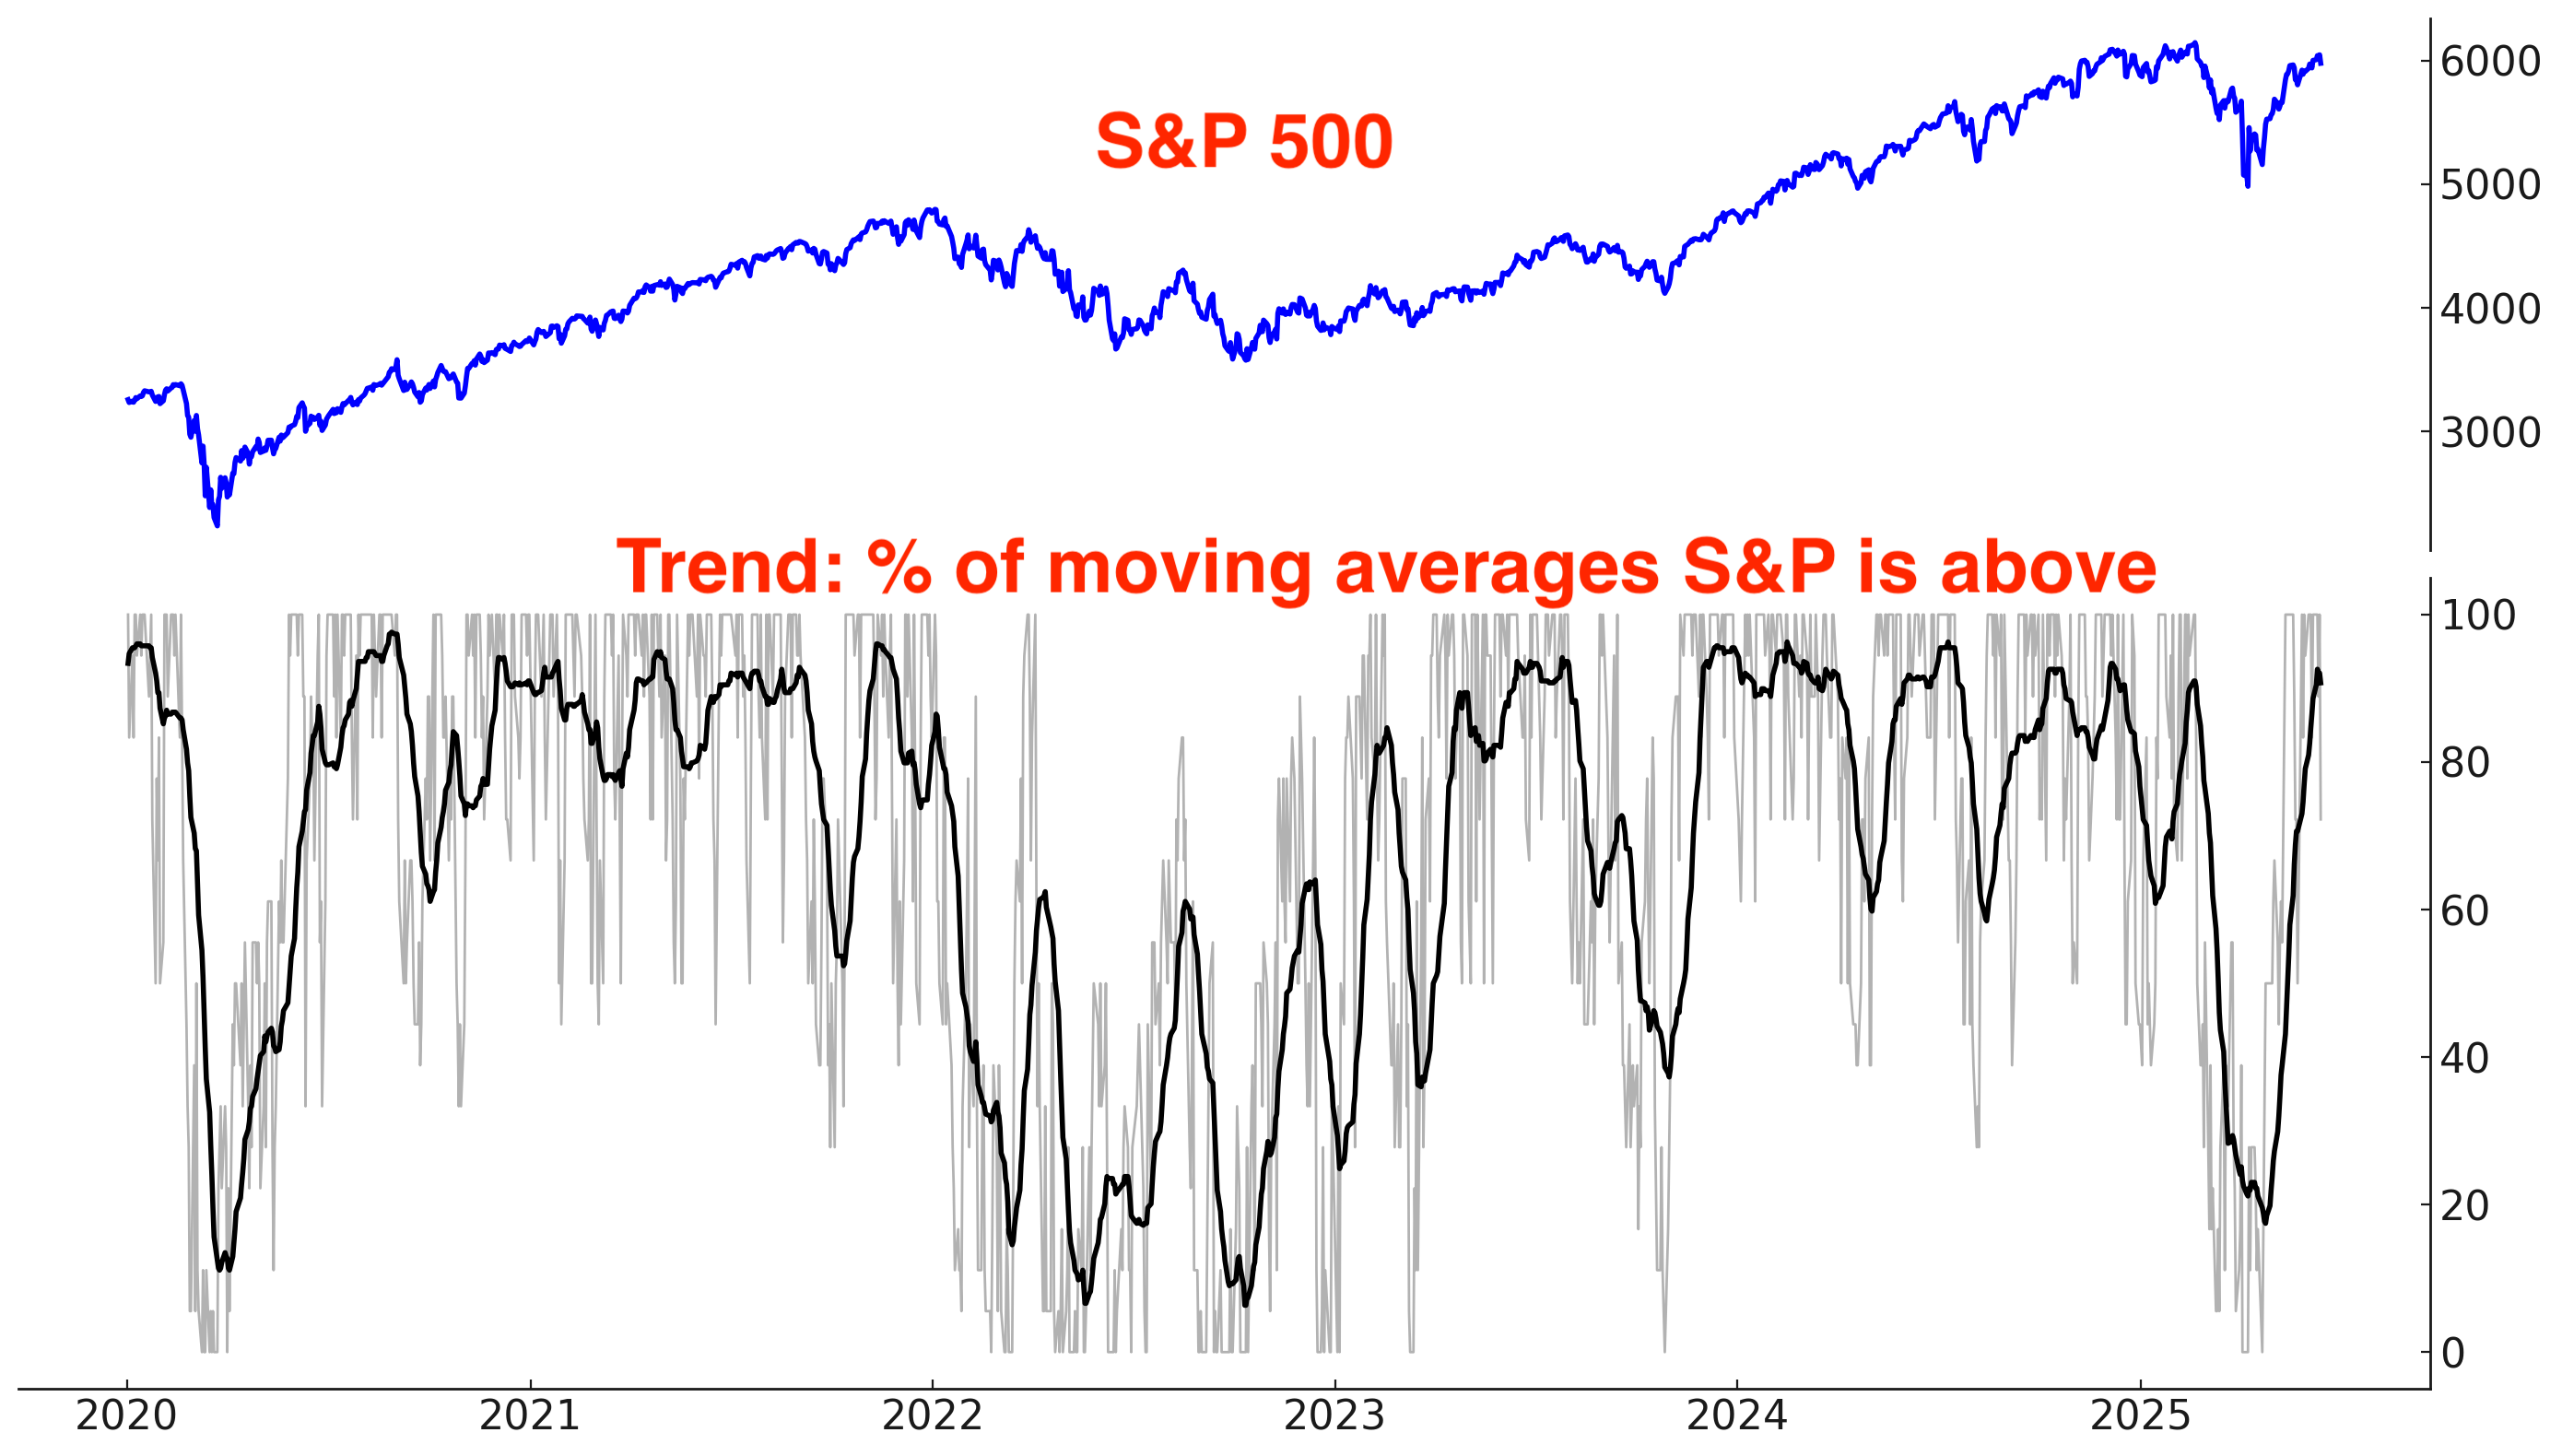
Why does trend matter? Because at least from a trend following perspective, it’s better to buy when the market is trending Up (e.g. above its 200-DMA) than when the market is trending Down (e.g. below its 200-DMA).
*There is nothing “special” about the 200 day moving average, except the fact that it’s popular. It is not significantly different from the 195, 190, 185, 180, 205, 210, 215, or 220 moving averages.
Long above vs. below the S&P 500’s 200 day moving average:

Long above vs. below the S&P 500’s 50 day moving average:

Long above vs. below the S&P 500’s 20 day moving average:

Earnings & Valuations
Some traders say that valuations and fundamentals are useless, and that “only price matters”. While this is true for day traders (valuations have zero impact on the market’s short term direction), fundamentals matter for traders and investors with longer term horizons.
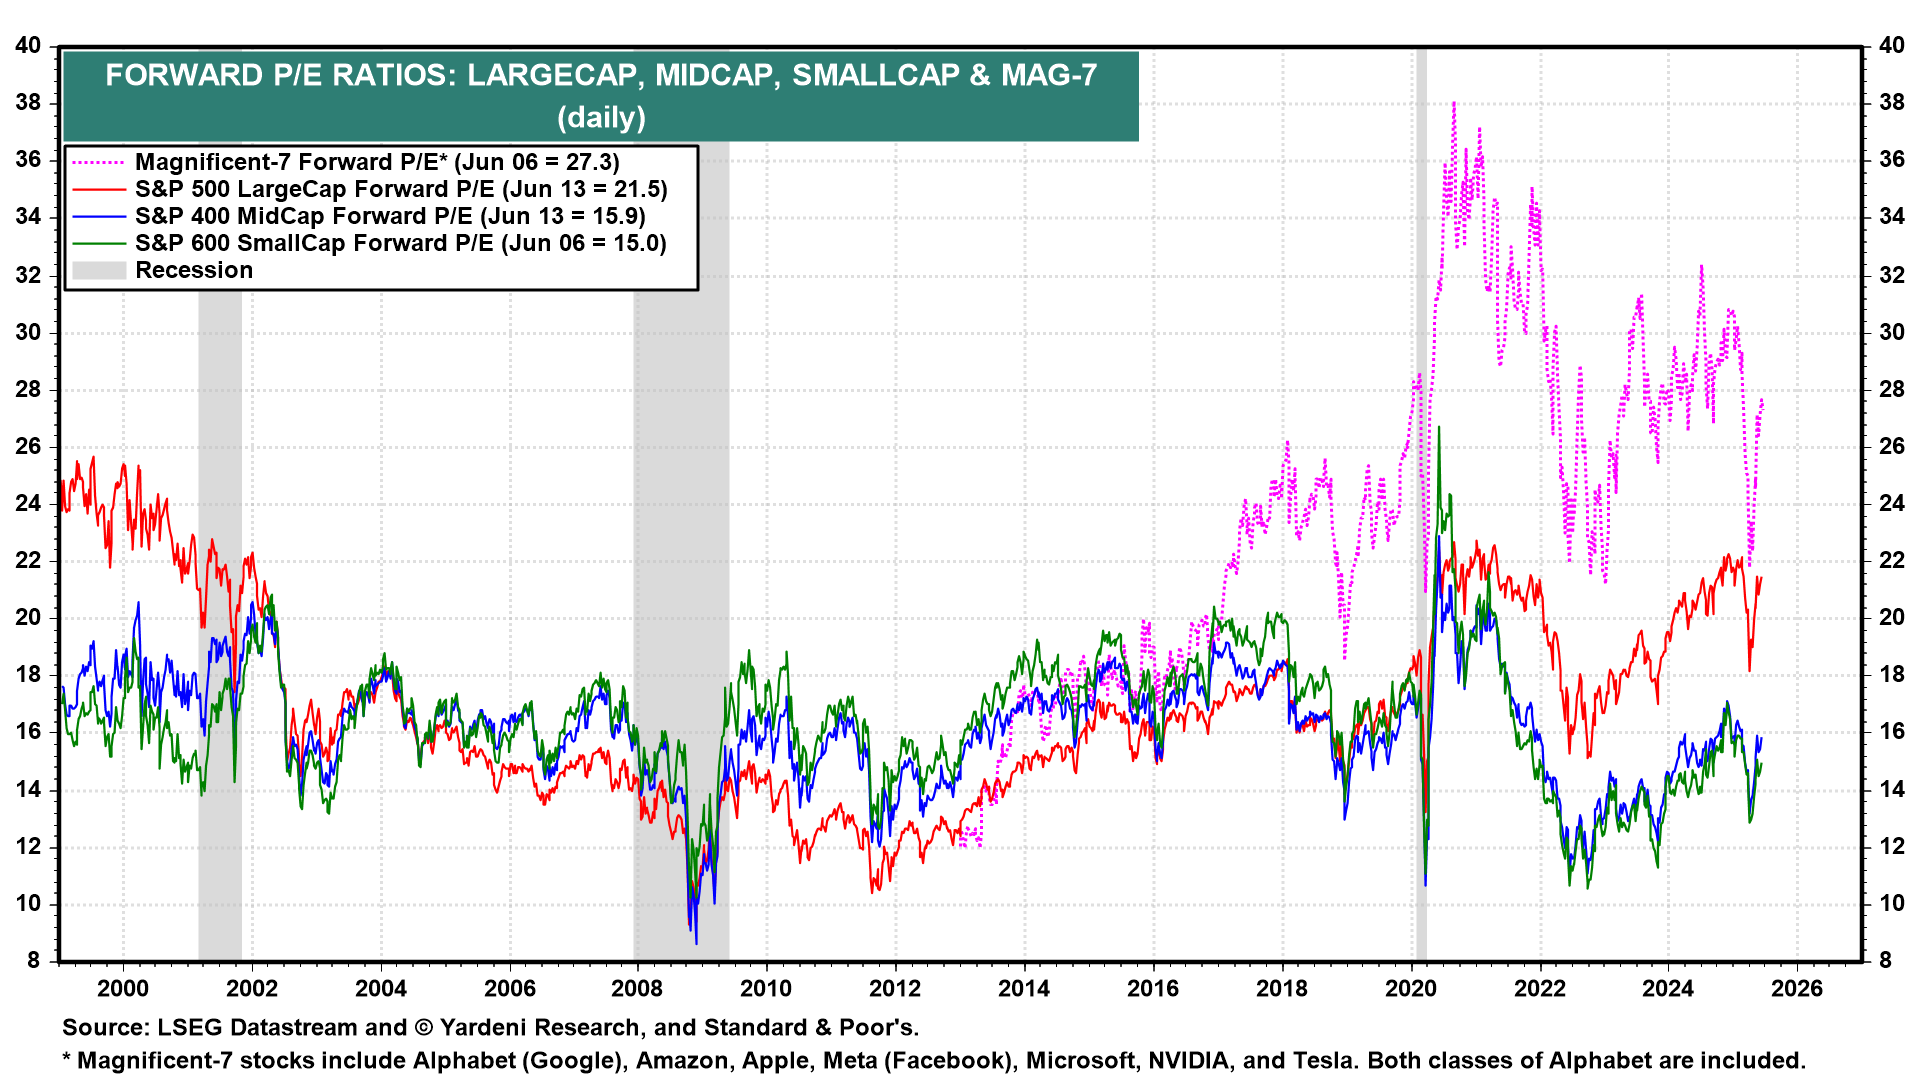
Valuations for large cap stocks (S&P 500) remain elevated compared to their 10 year average:
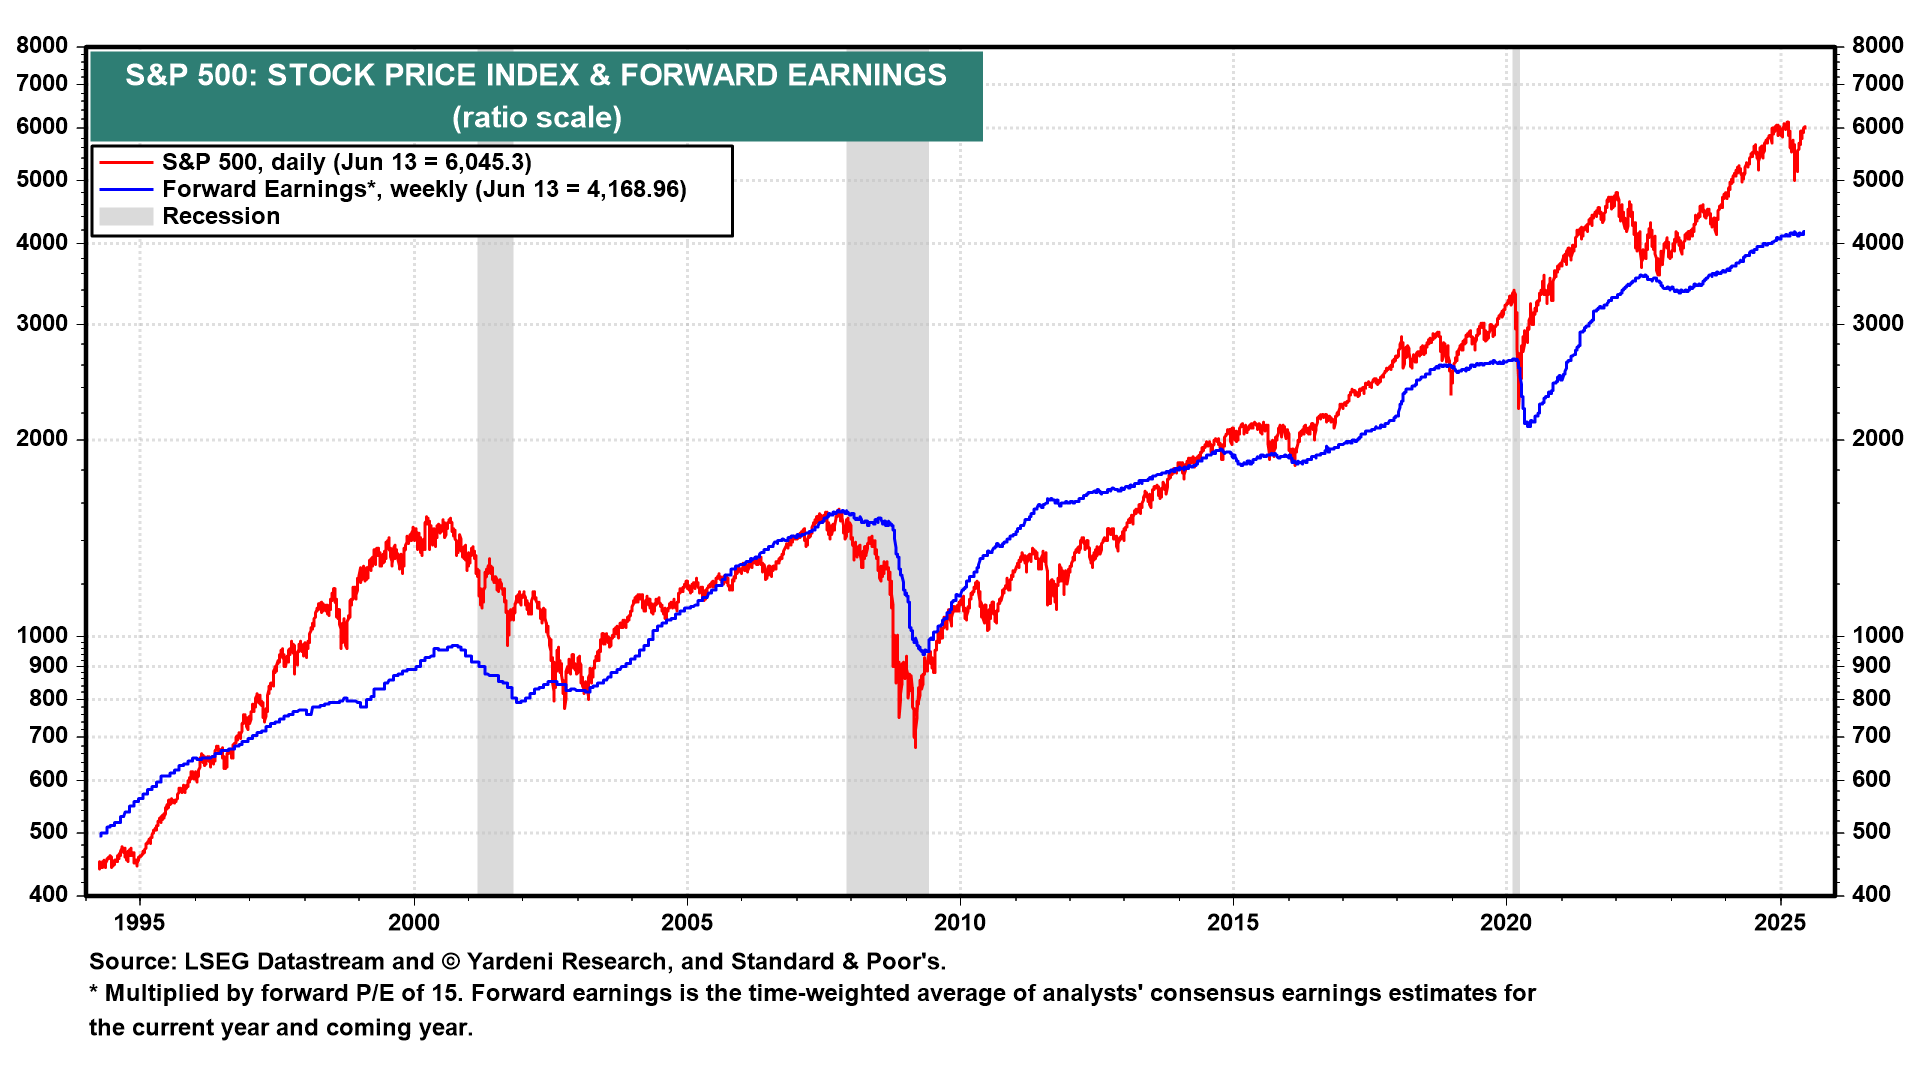
Here’s the S&P 500’s forward earnings expectations. In the long run, earnings and stock prices move in the same direction. Earnings are still growing right now.