Markets Report: the frothy Everything Rally
Everything is UP

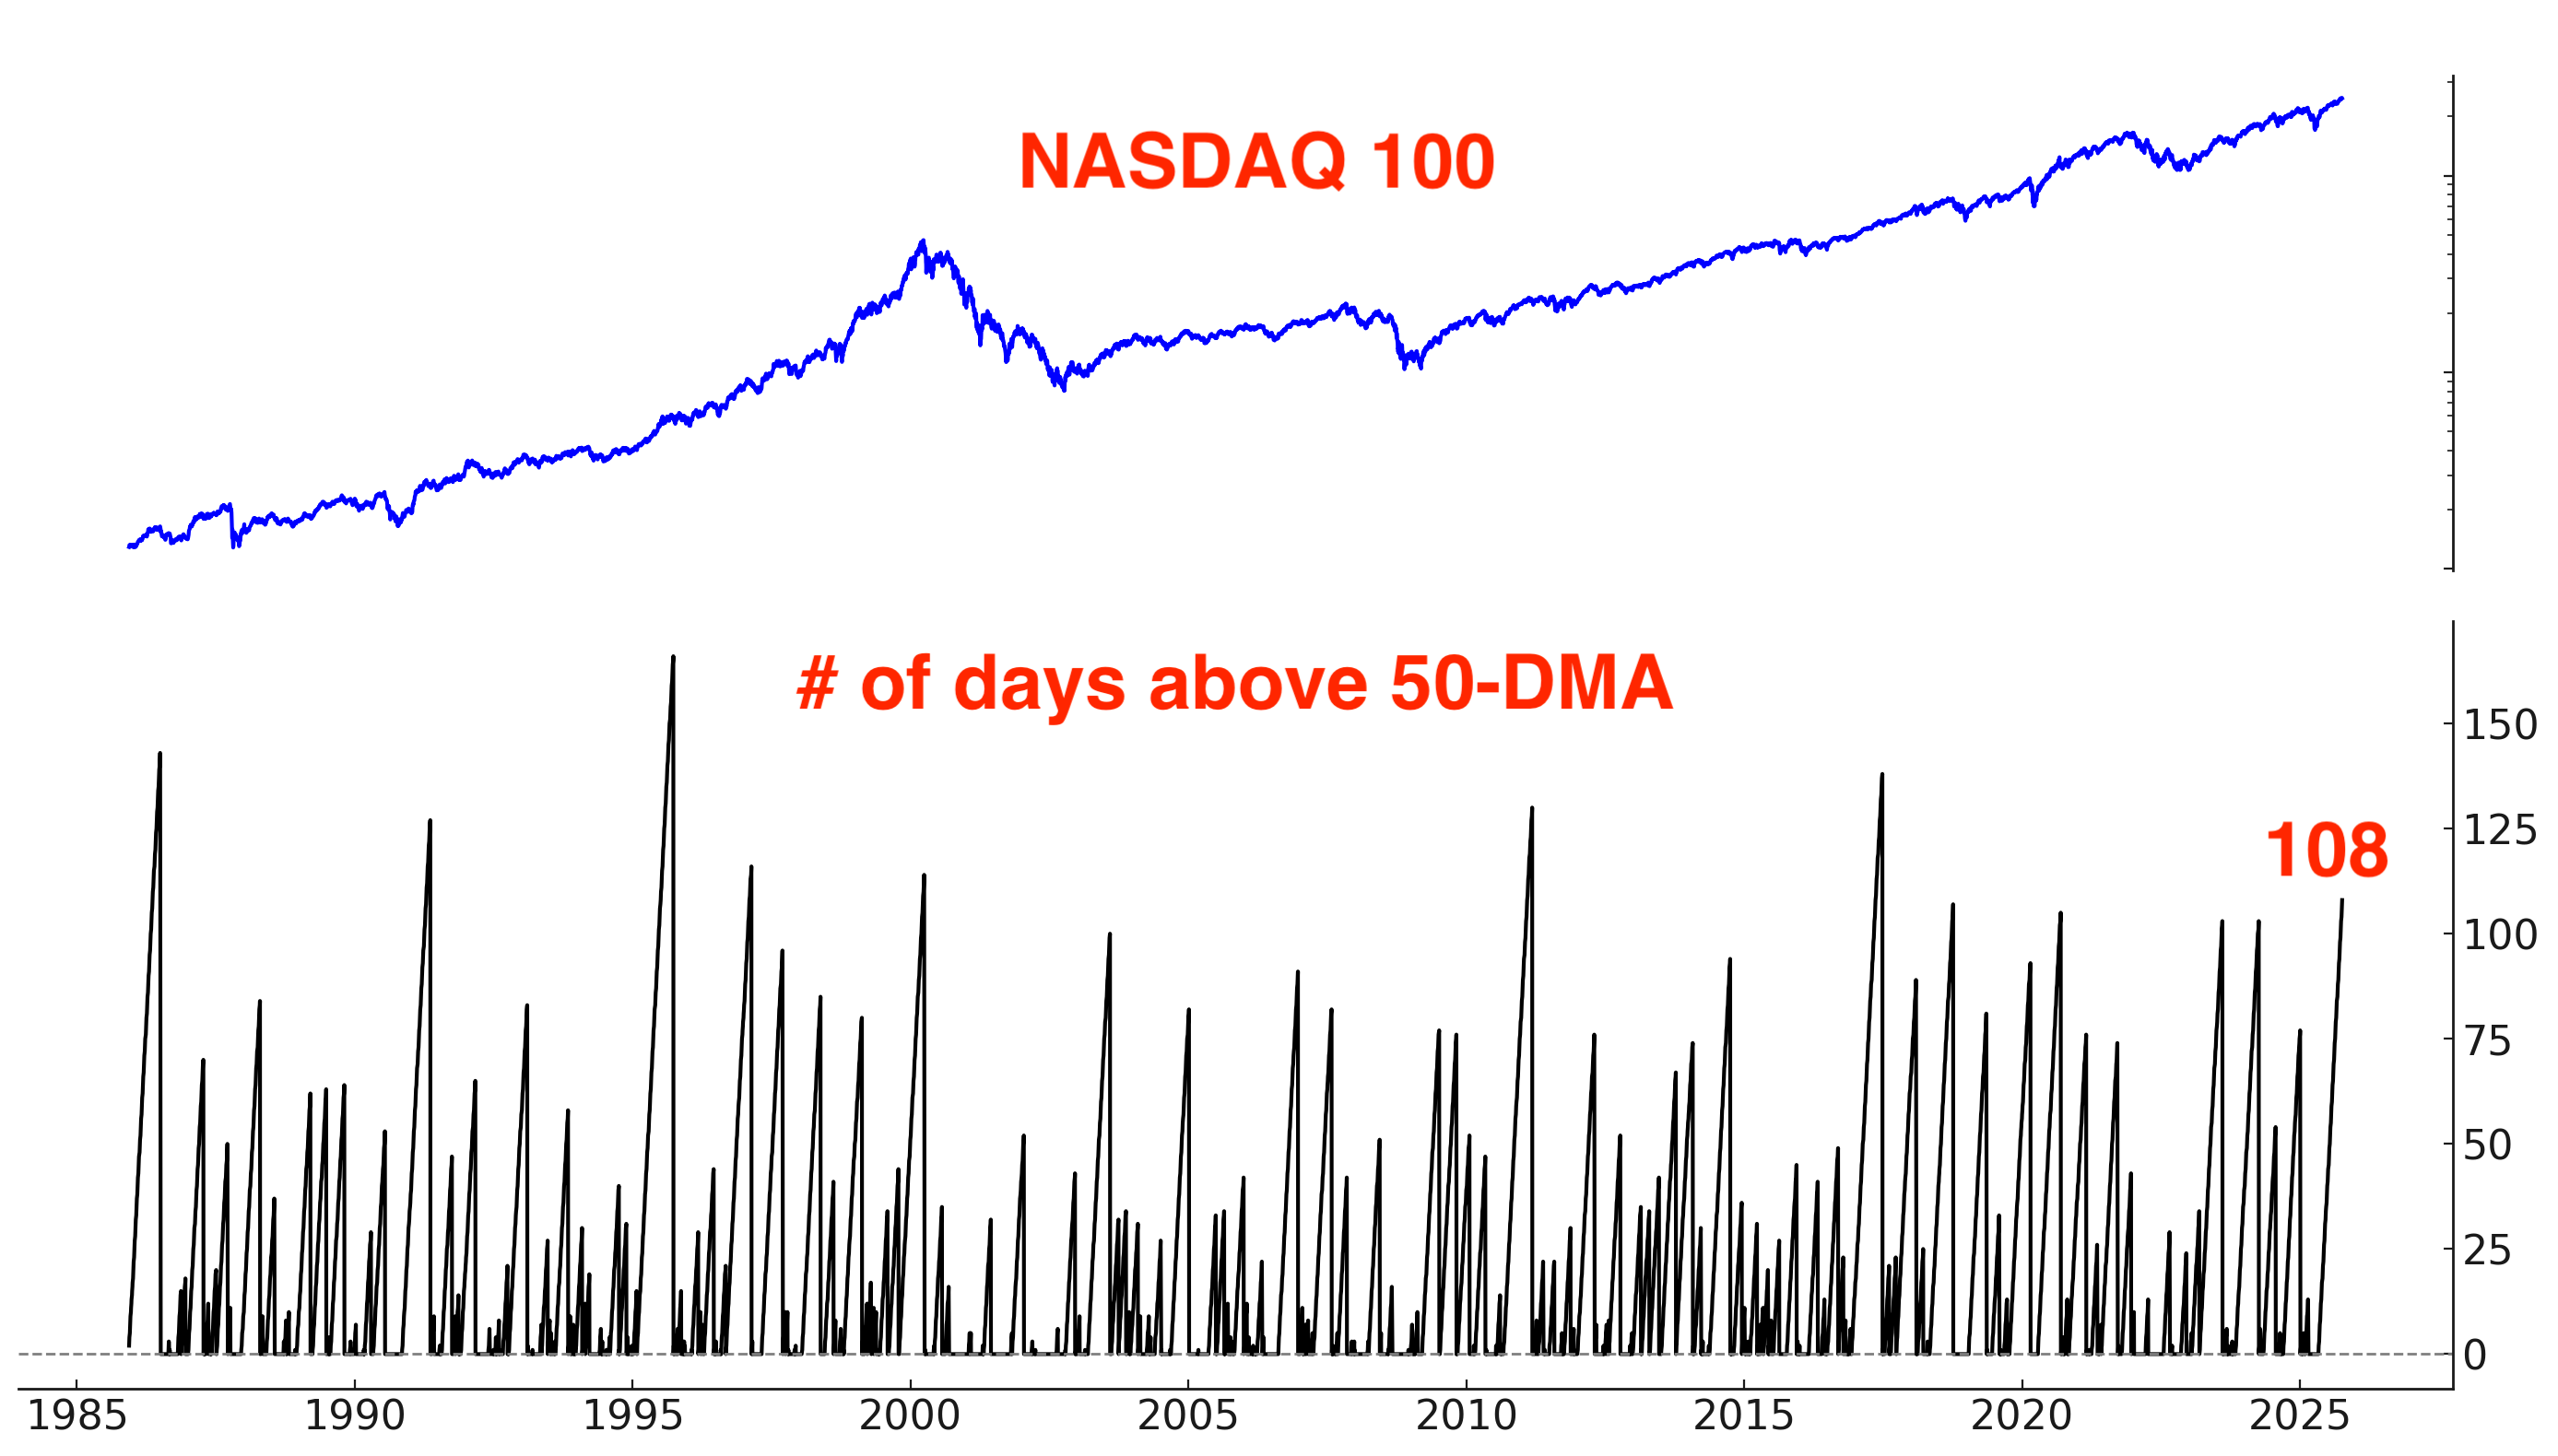
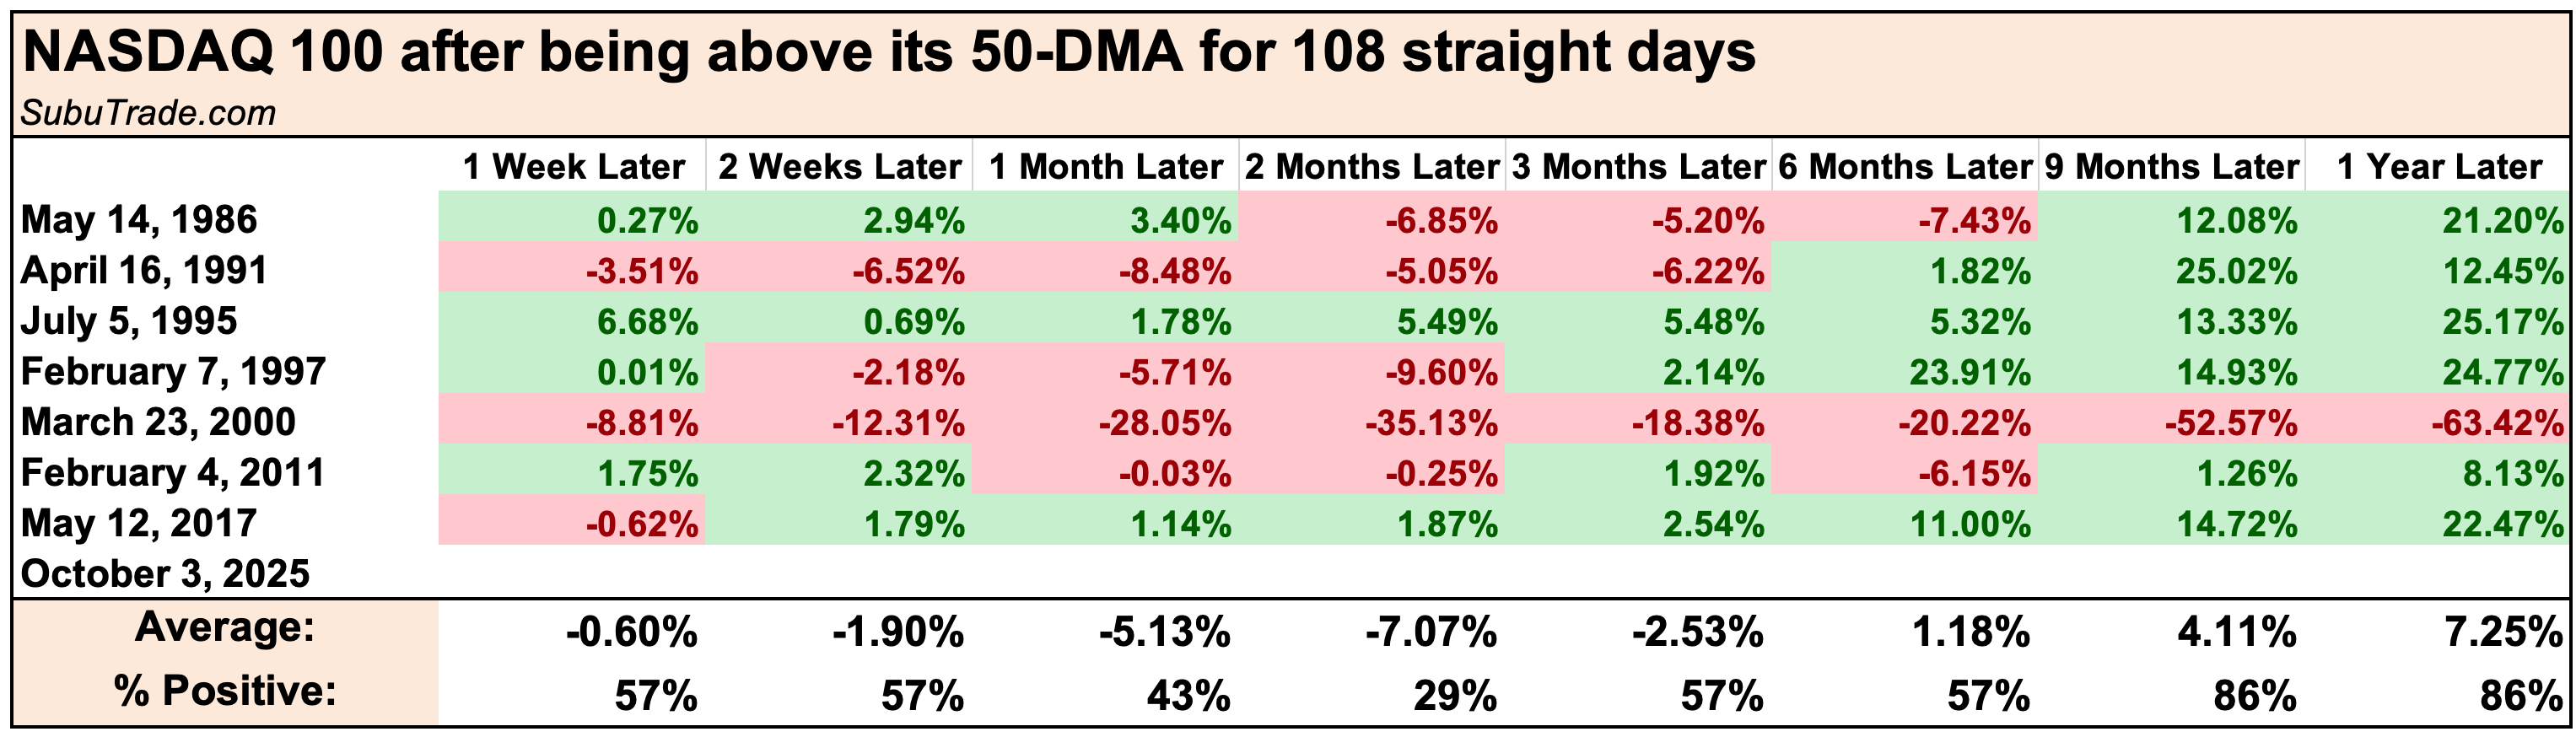
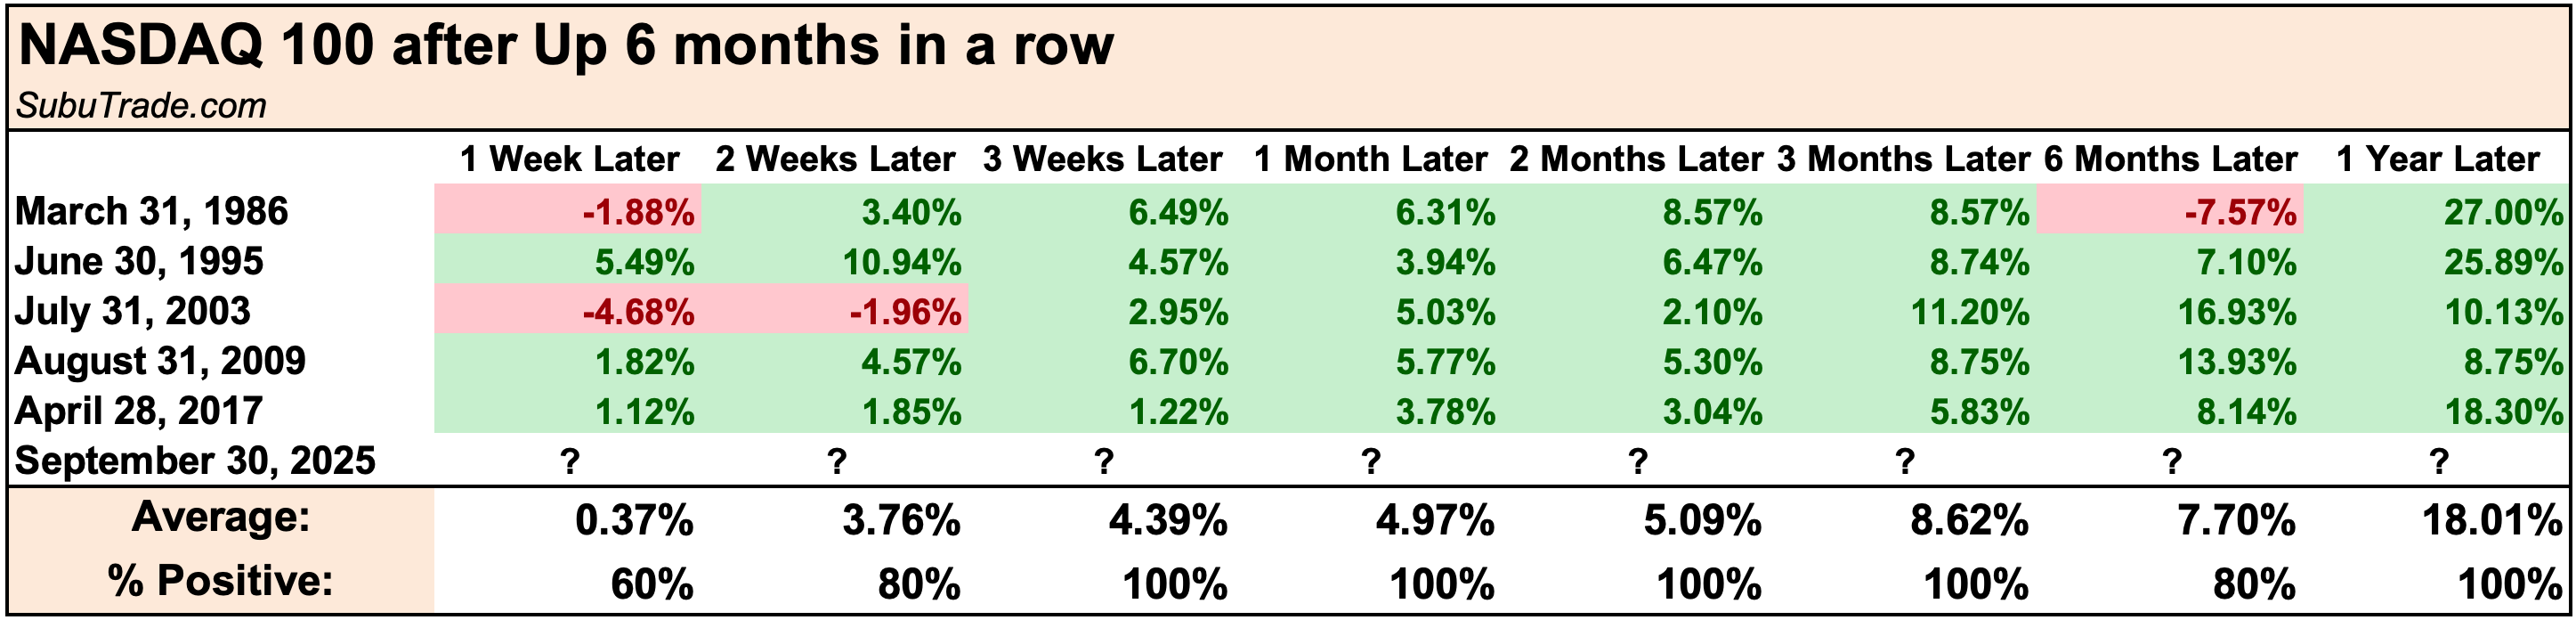
The Everything Rally continues. Stocks rally non-stop, gold and silver push higher relentlessly, and once-hated markets like Chinese equities grind higher. To put this rally into perspective: the NASDAQ 100 has traded above its 50 day moving average for 108 consecutive days; the longest streak since the 2017 melt-up. All good things come to an end (eventually):
U.S. Stocks
U.S. equities have bullish momentum supporting them. A non-stop rally with strong momentum usually does not fizzle out on its own. A pullback/correction may be imminent, but strong momentum usually leads to more gains for stocks over the next year:
Options
There are signs of froth in this rally. Options traders are wildly bullish.
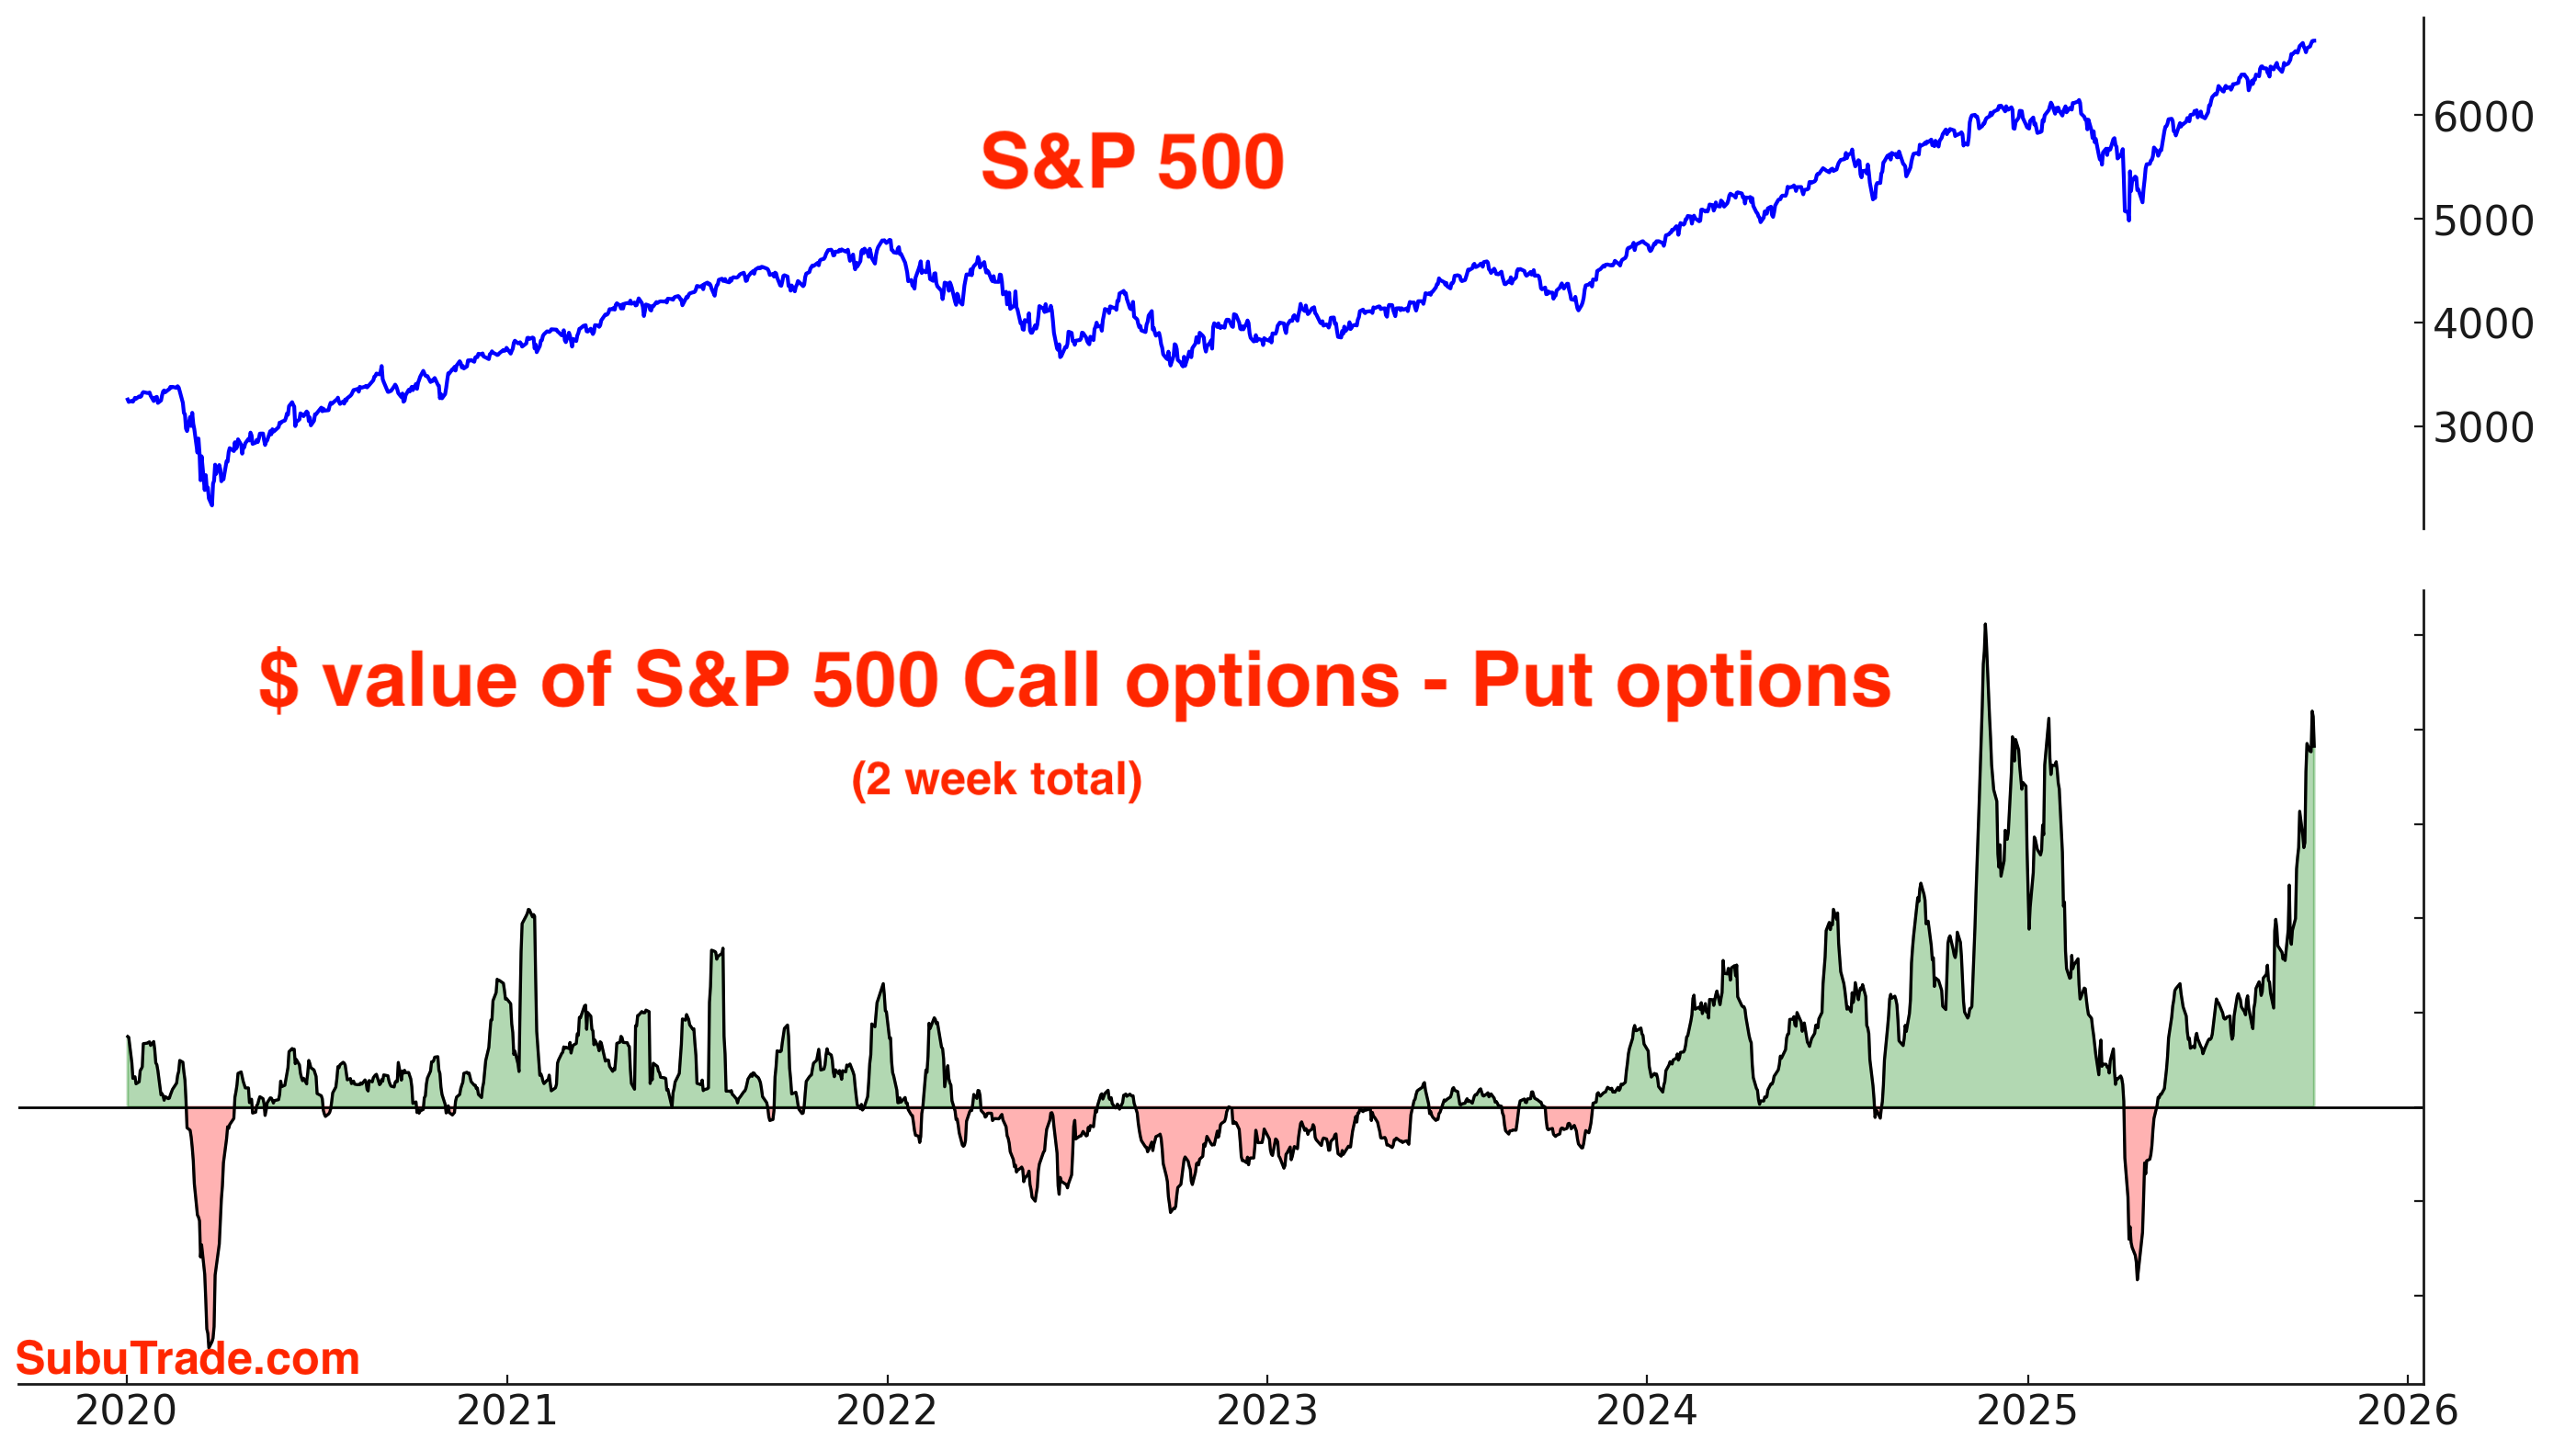
The $ value of S&P 500 Call volume - the $ value of S&P 500 Put volume is surging higher. The last time this happened was at the end of last year, before stocks plateaued ahead of this year’s crash in March/April.
This does not imply that another crash is likely; stocks arguably would not have crashed in March/April if Trump had not surprised markets with his tariffs. But this does imply that the market going forward will be more volatile, with pullbacks/corrections making a return:
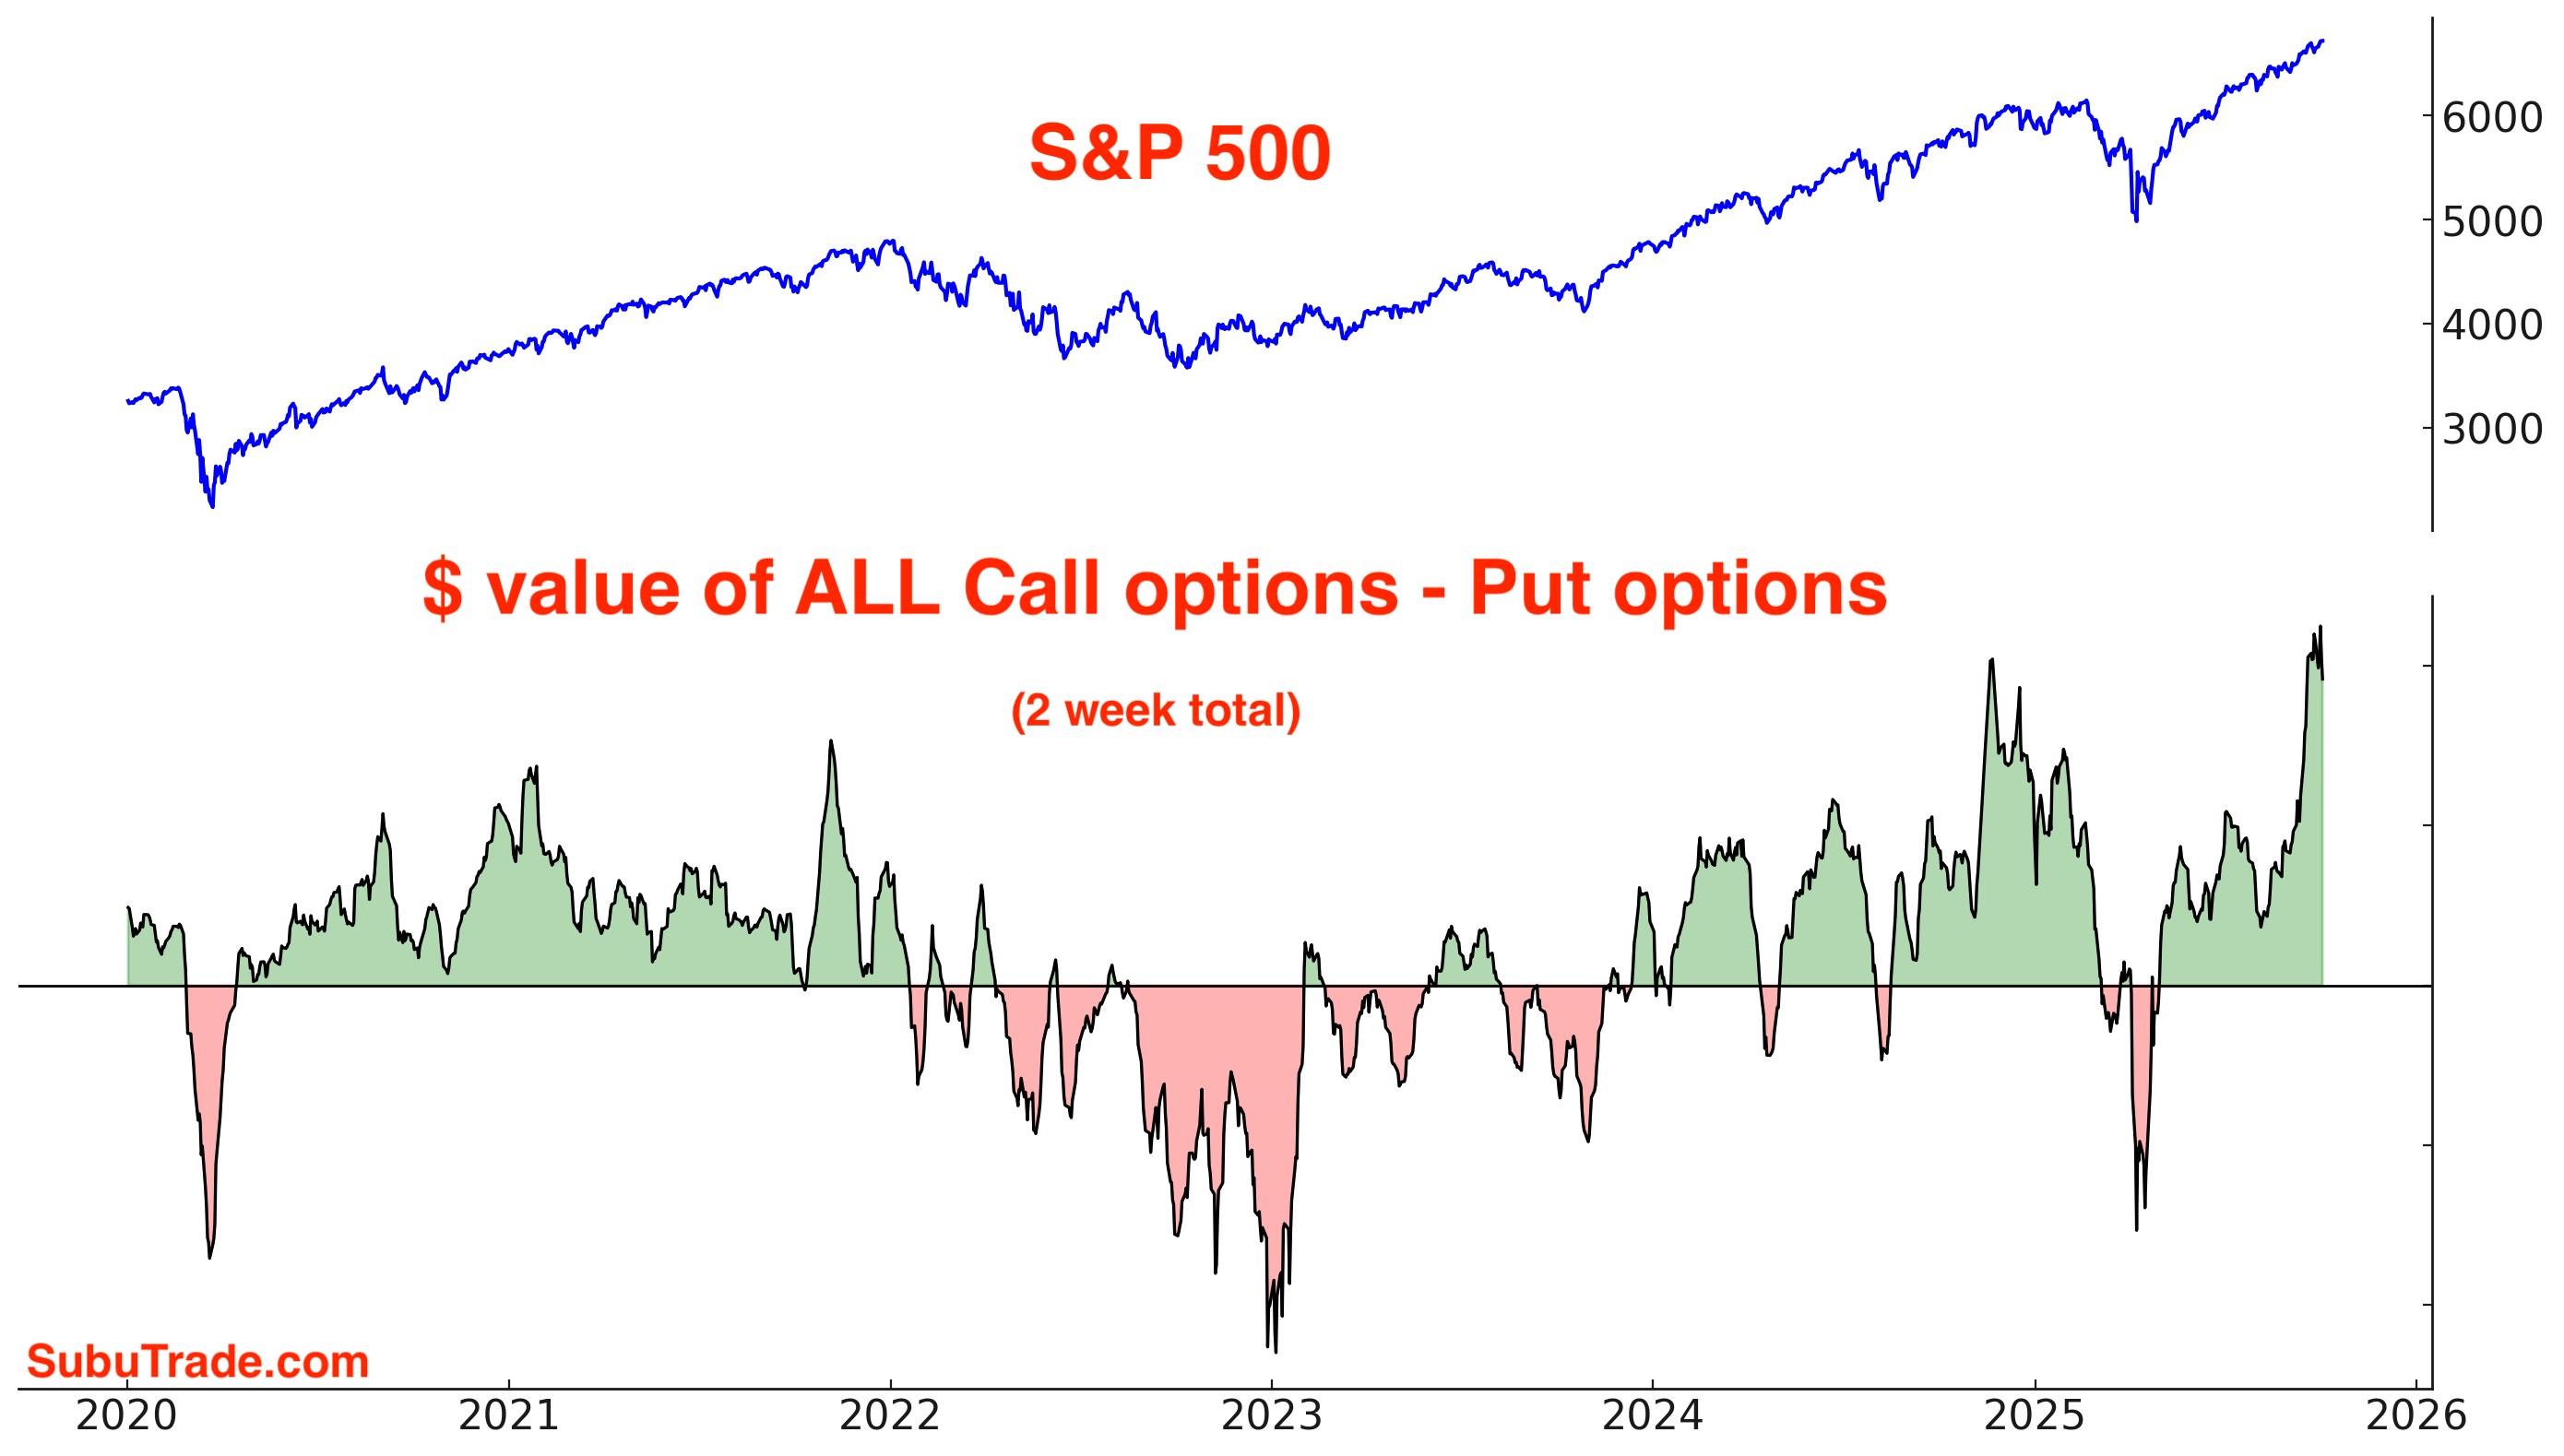
The $ value of ALL call options - put options is at an all-time high. This is concerning for stocks:
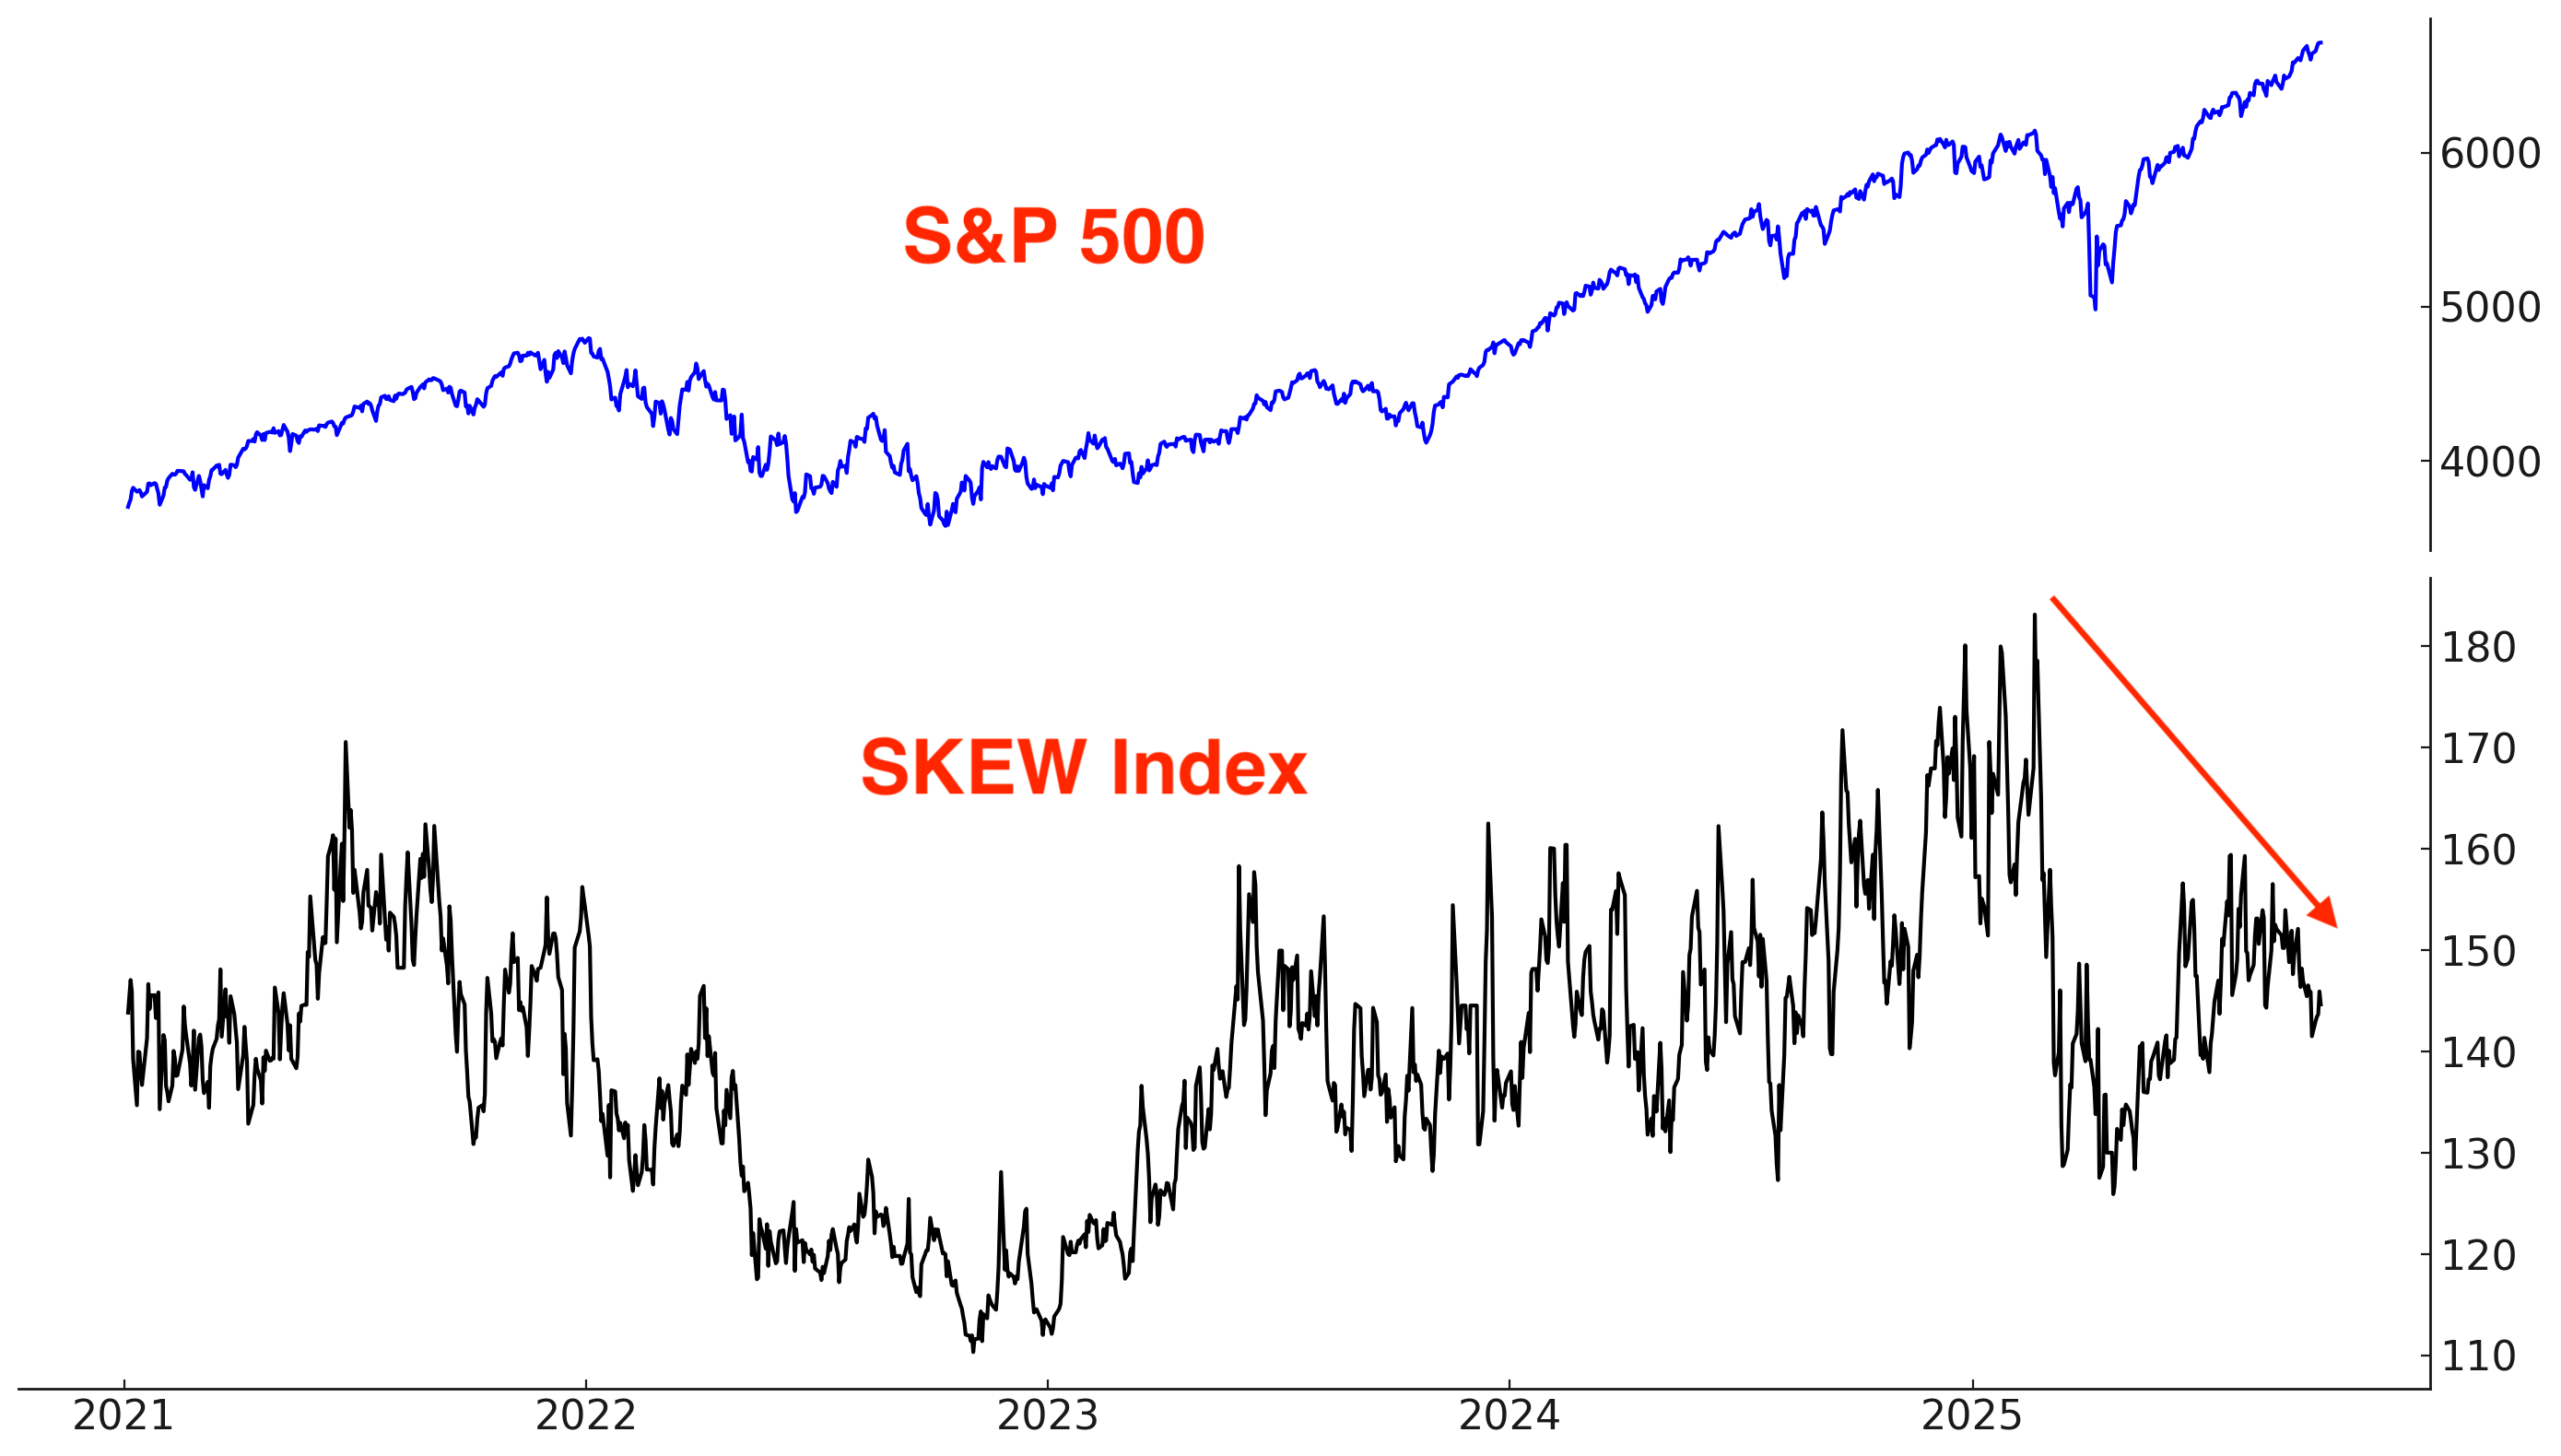
The SKEW Index, which reflects perceived tail risk in the options market — or the probability of extreme downside moves — remains muted. This suggests that any stock market pullback right now will not turn into a major crash.
Sentiment Indicators
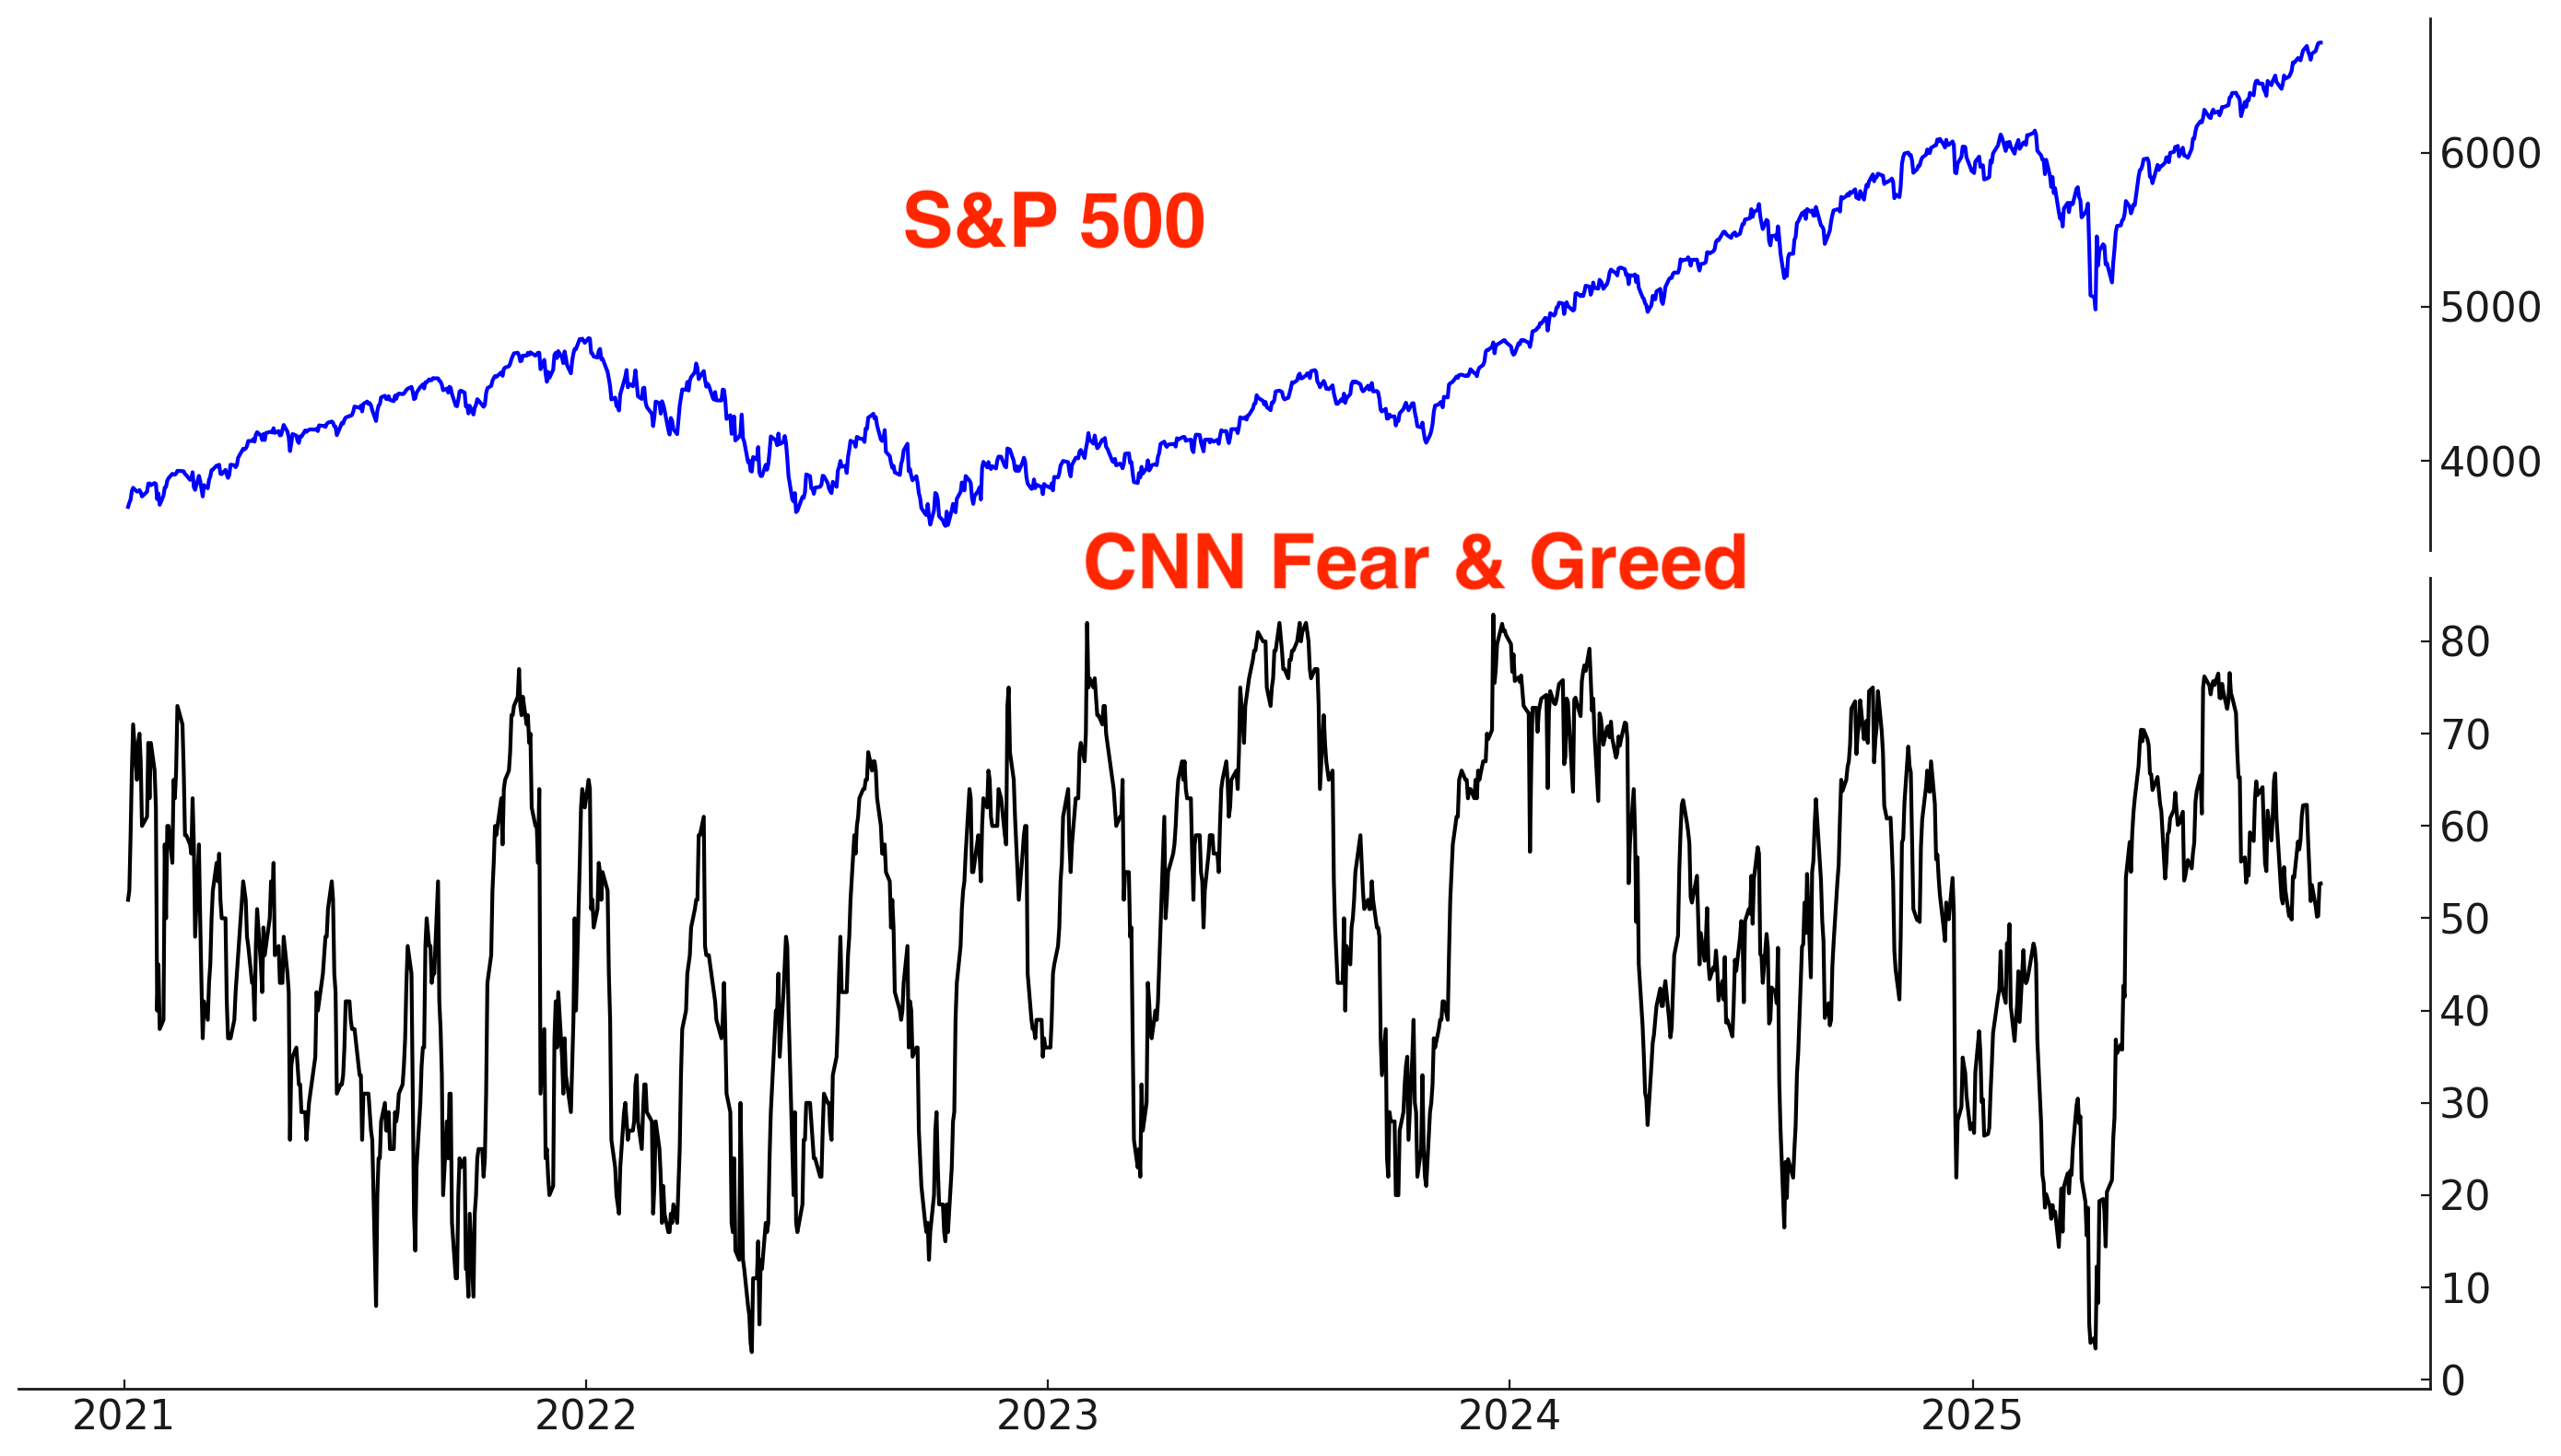
The CNN Fear & Greed Index leans neutral:
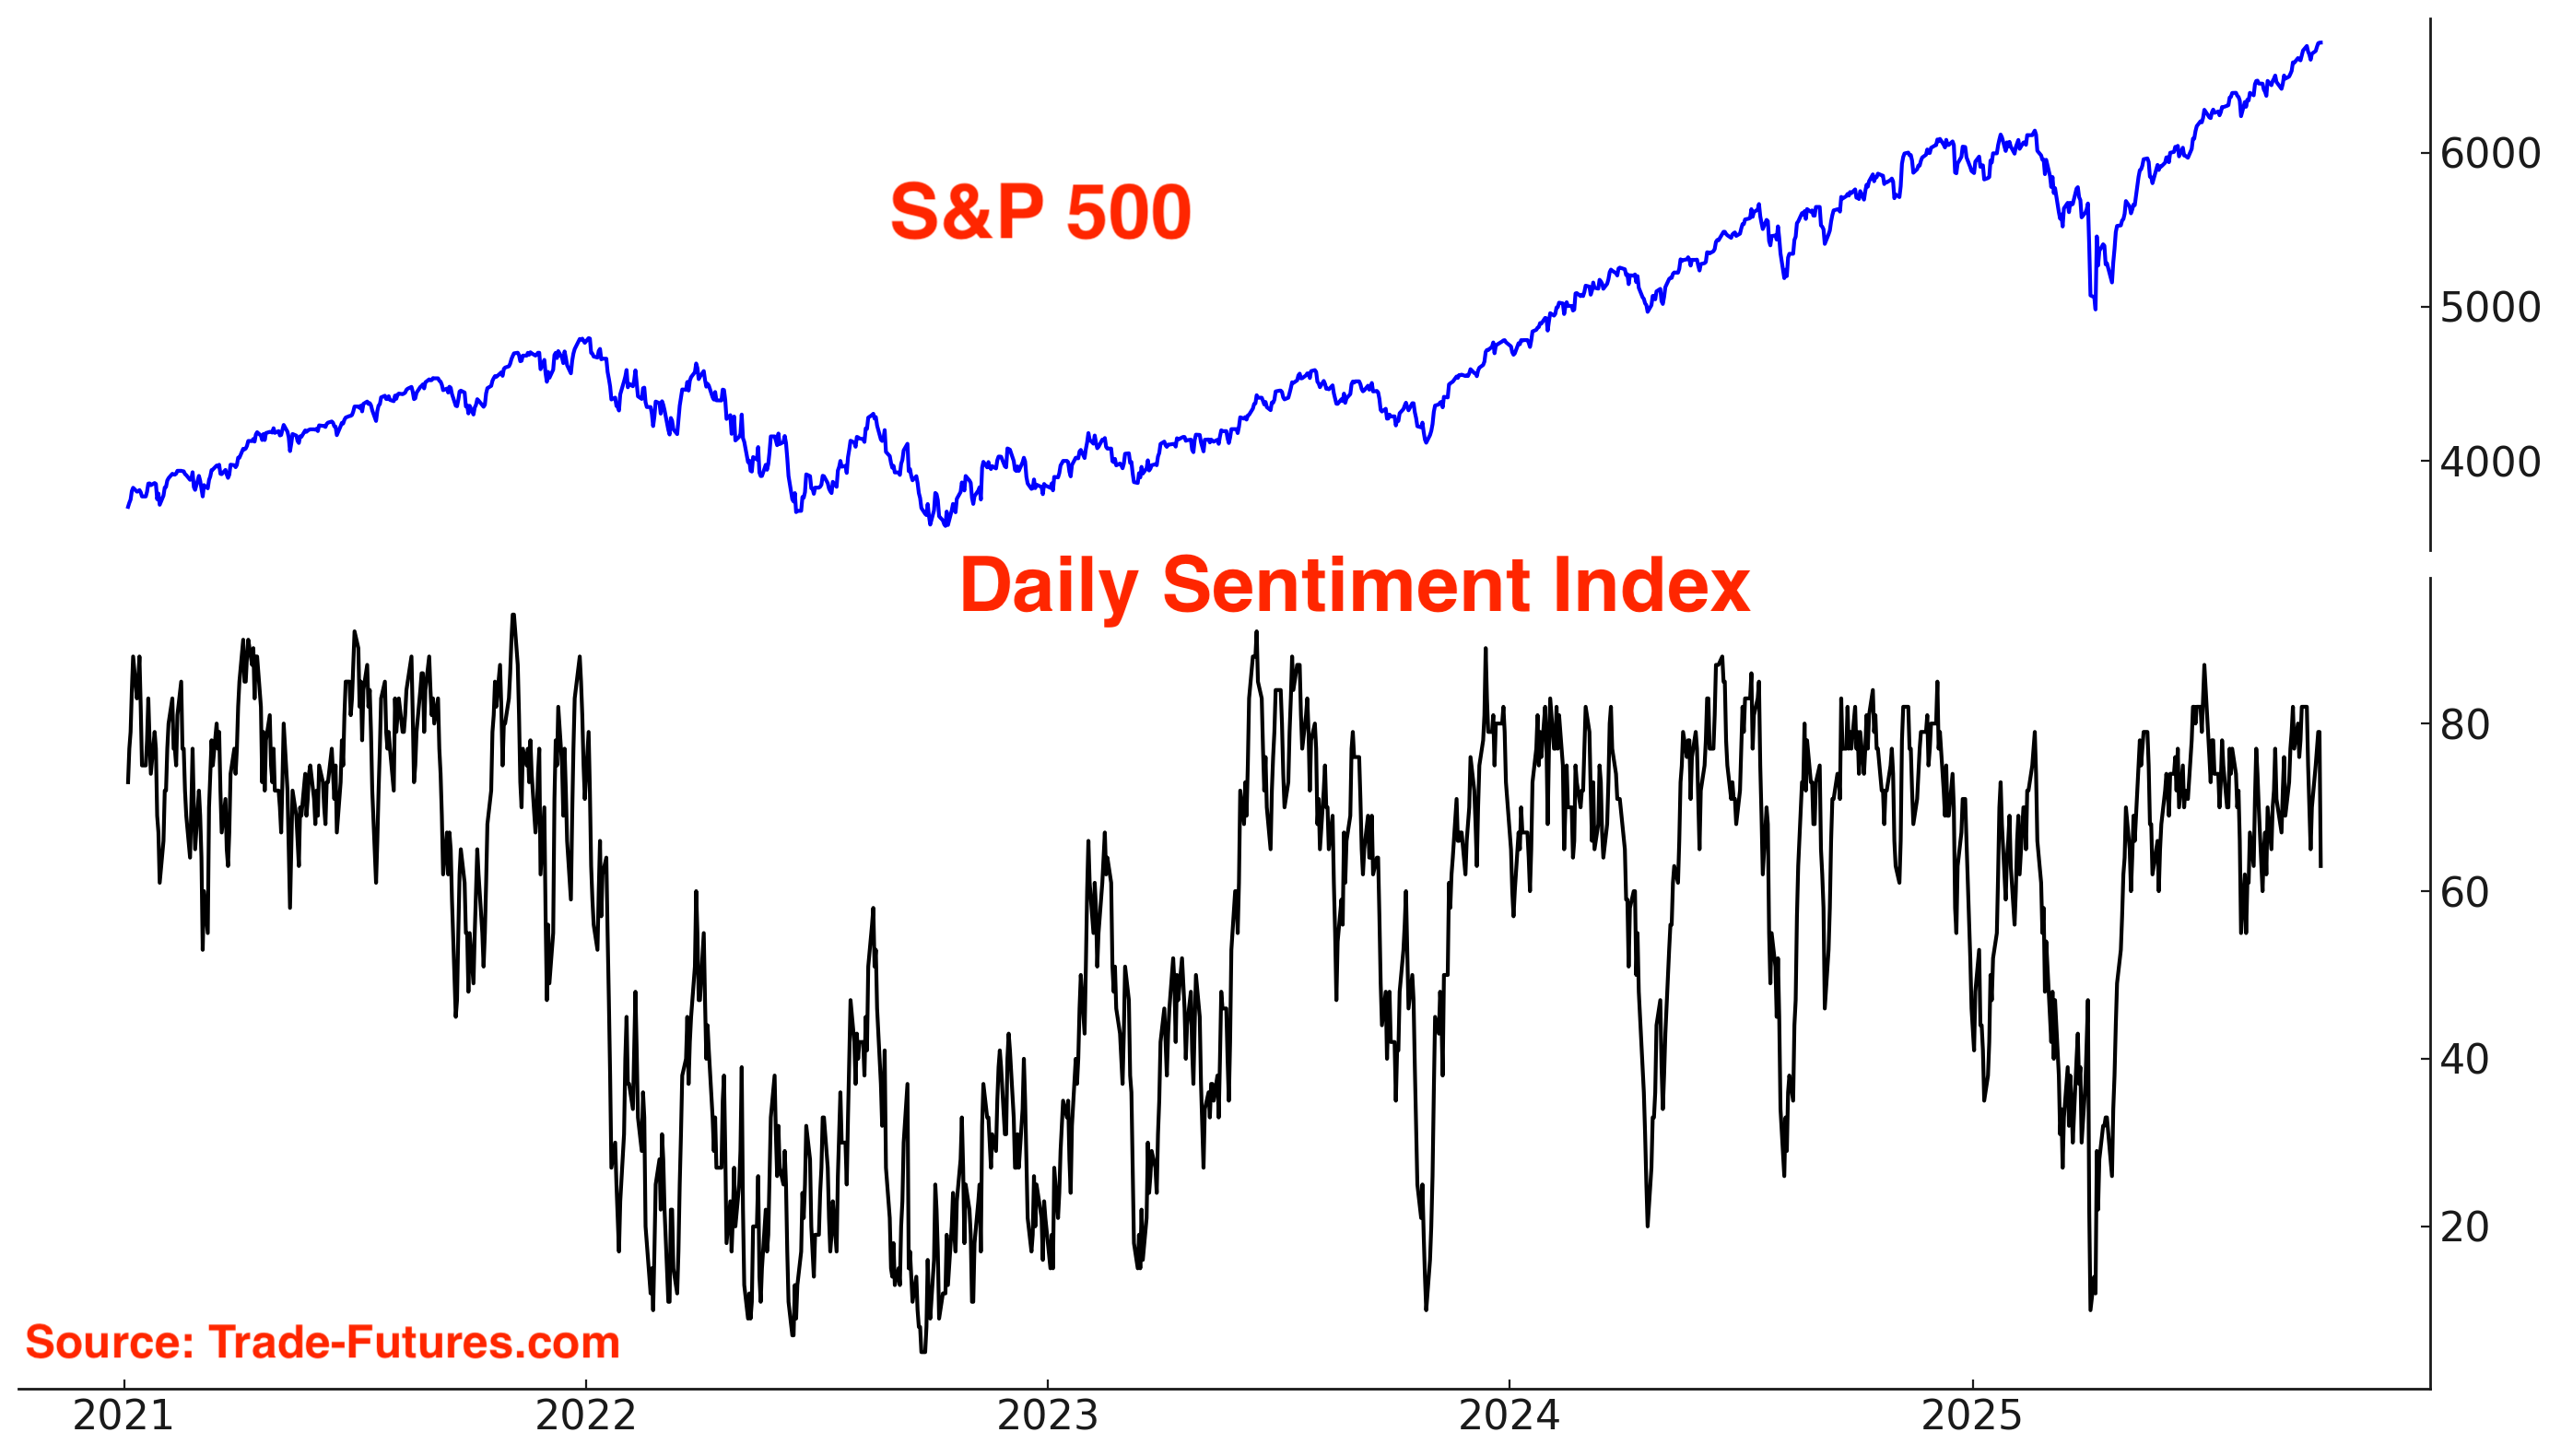
S&P 500’s Daily Sentiment Index leans bullish:
Sentiment Surveys
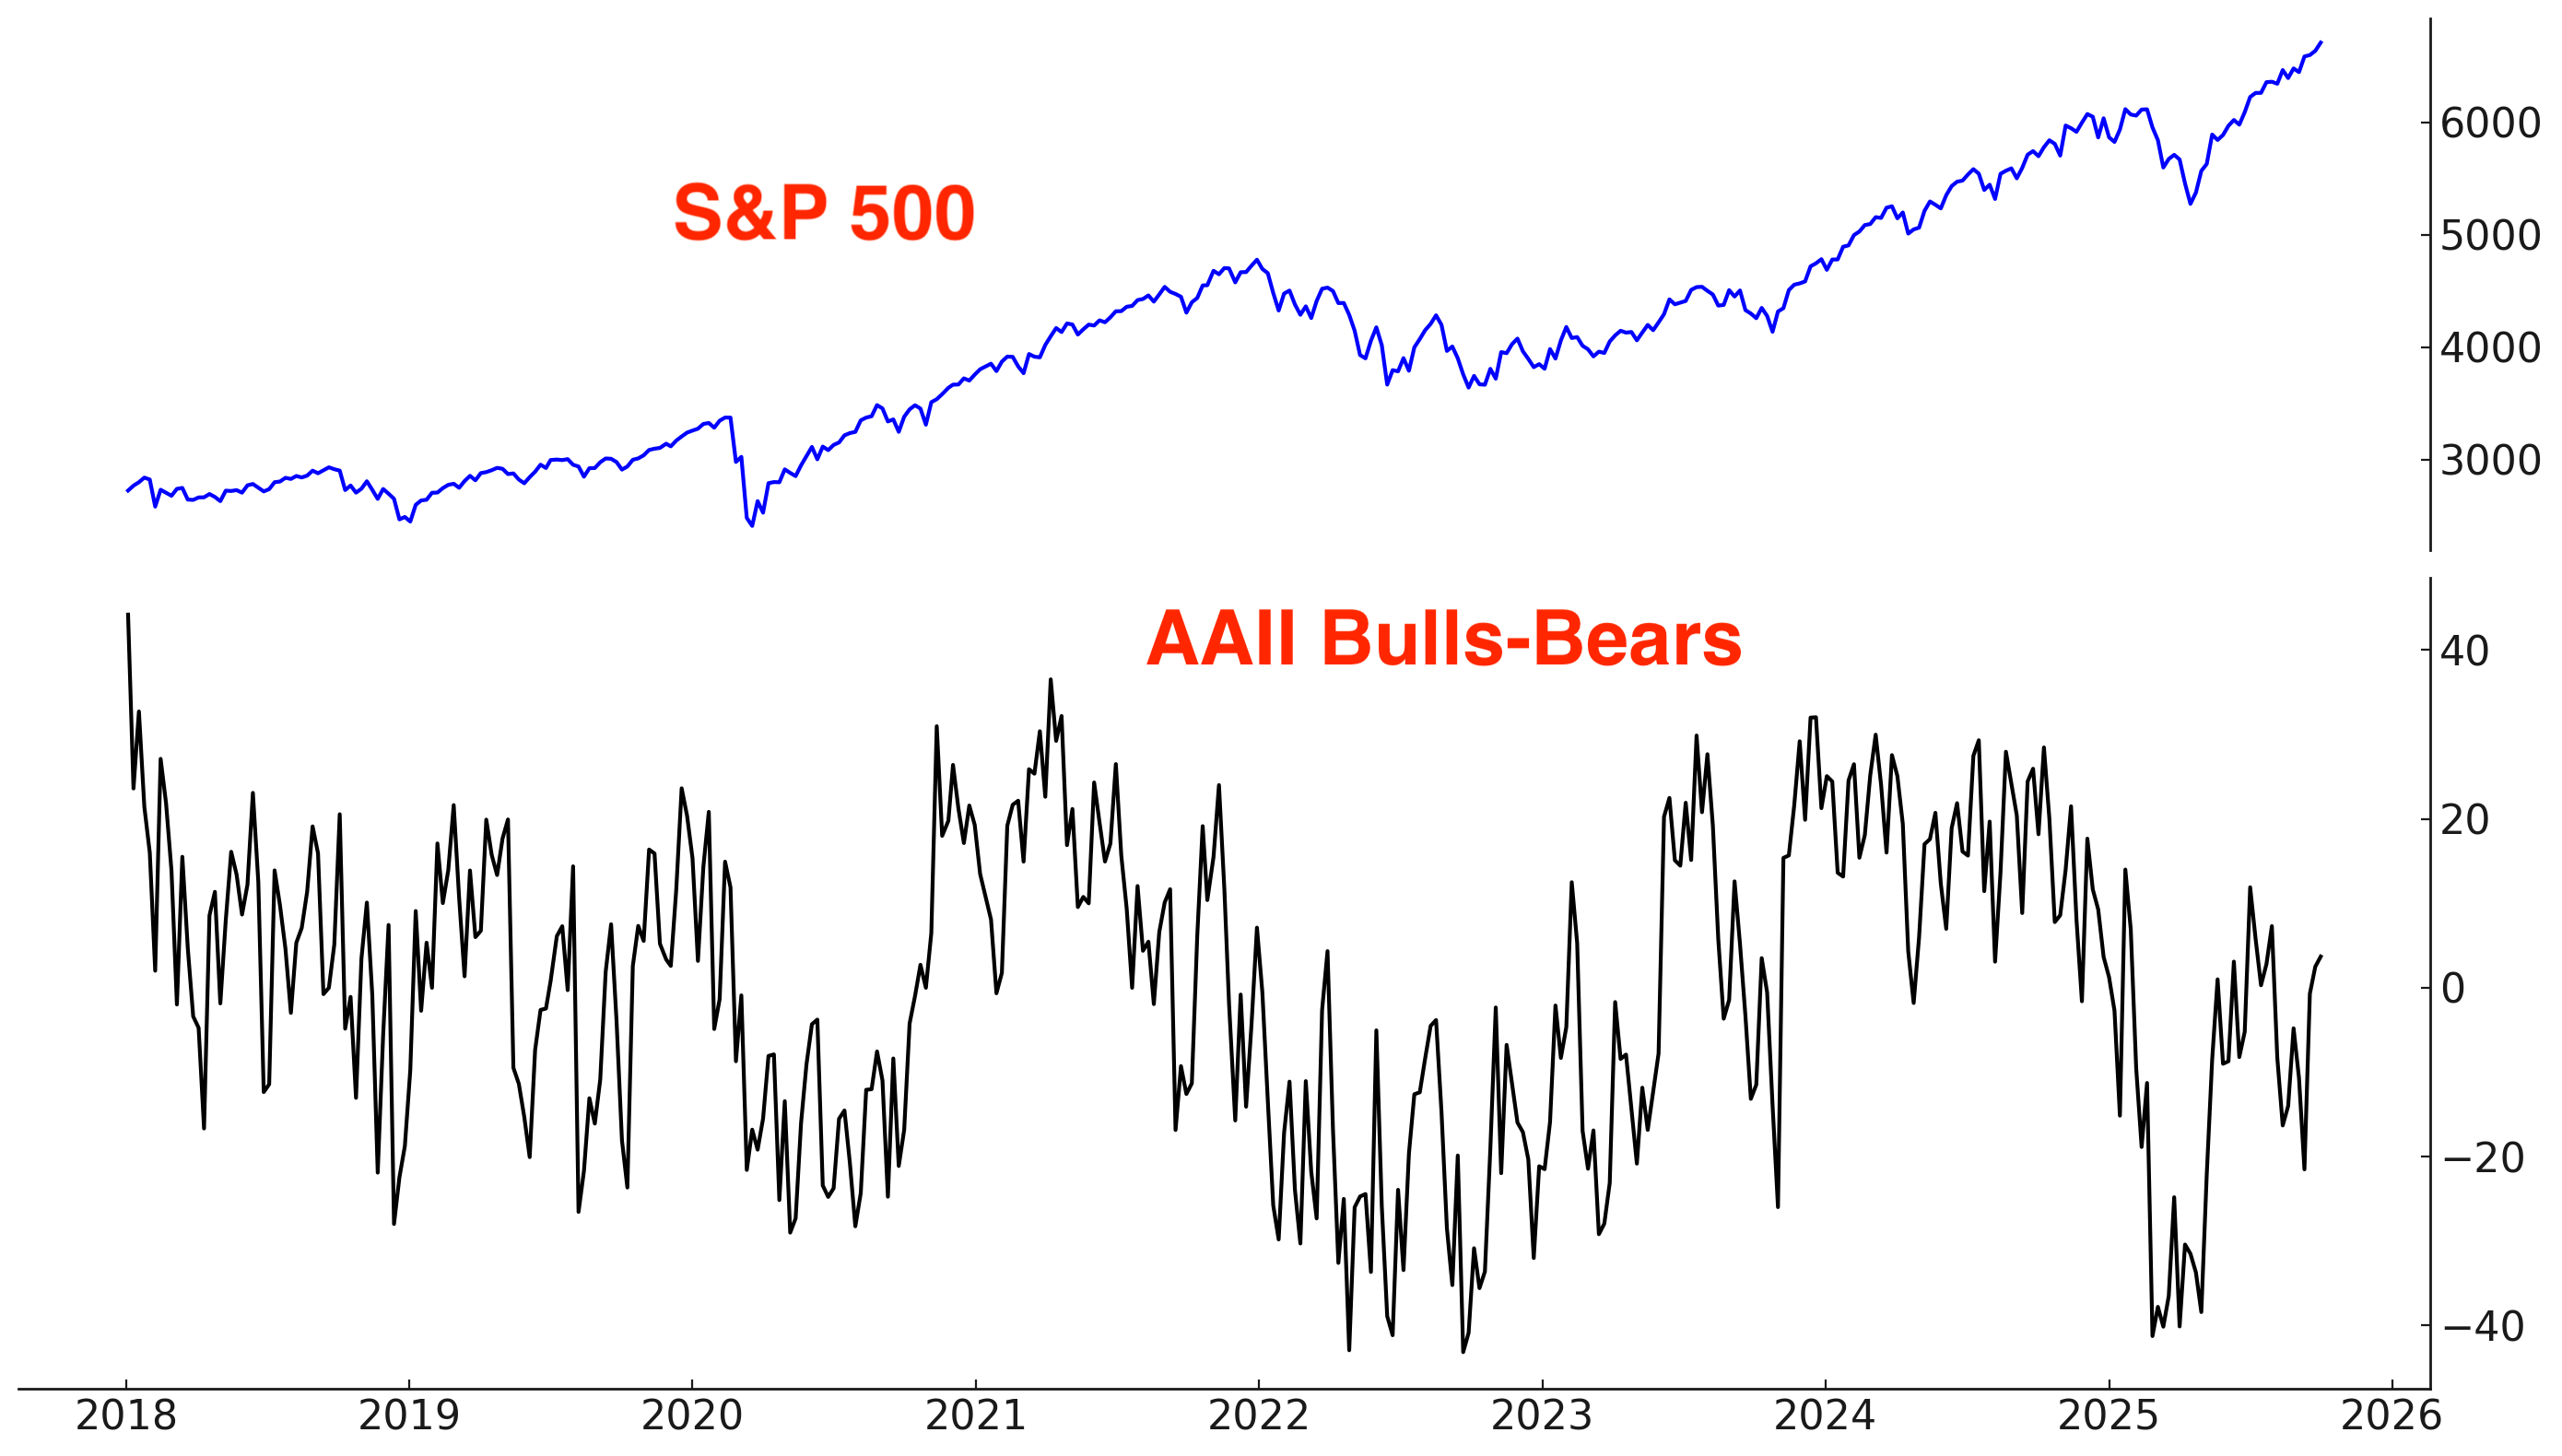
Sentiment according to the AAII survey is neutral. The AAII sentiment survey has been consistently less bullish than other sentiment surveys during this rally:
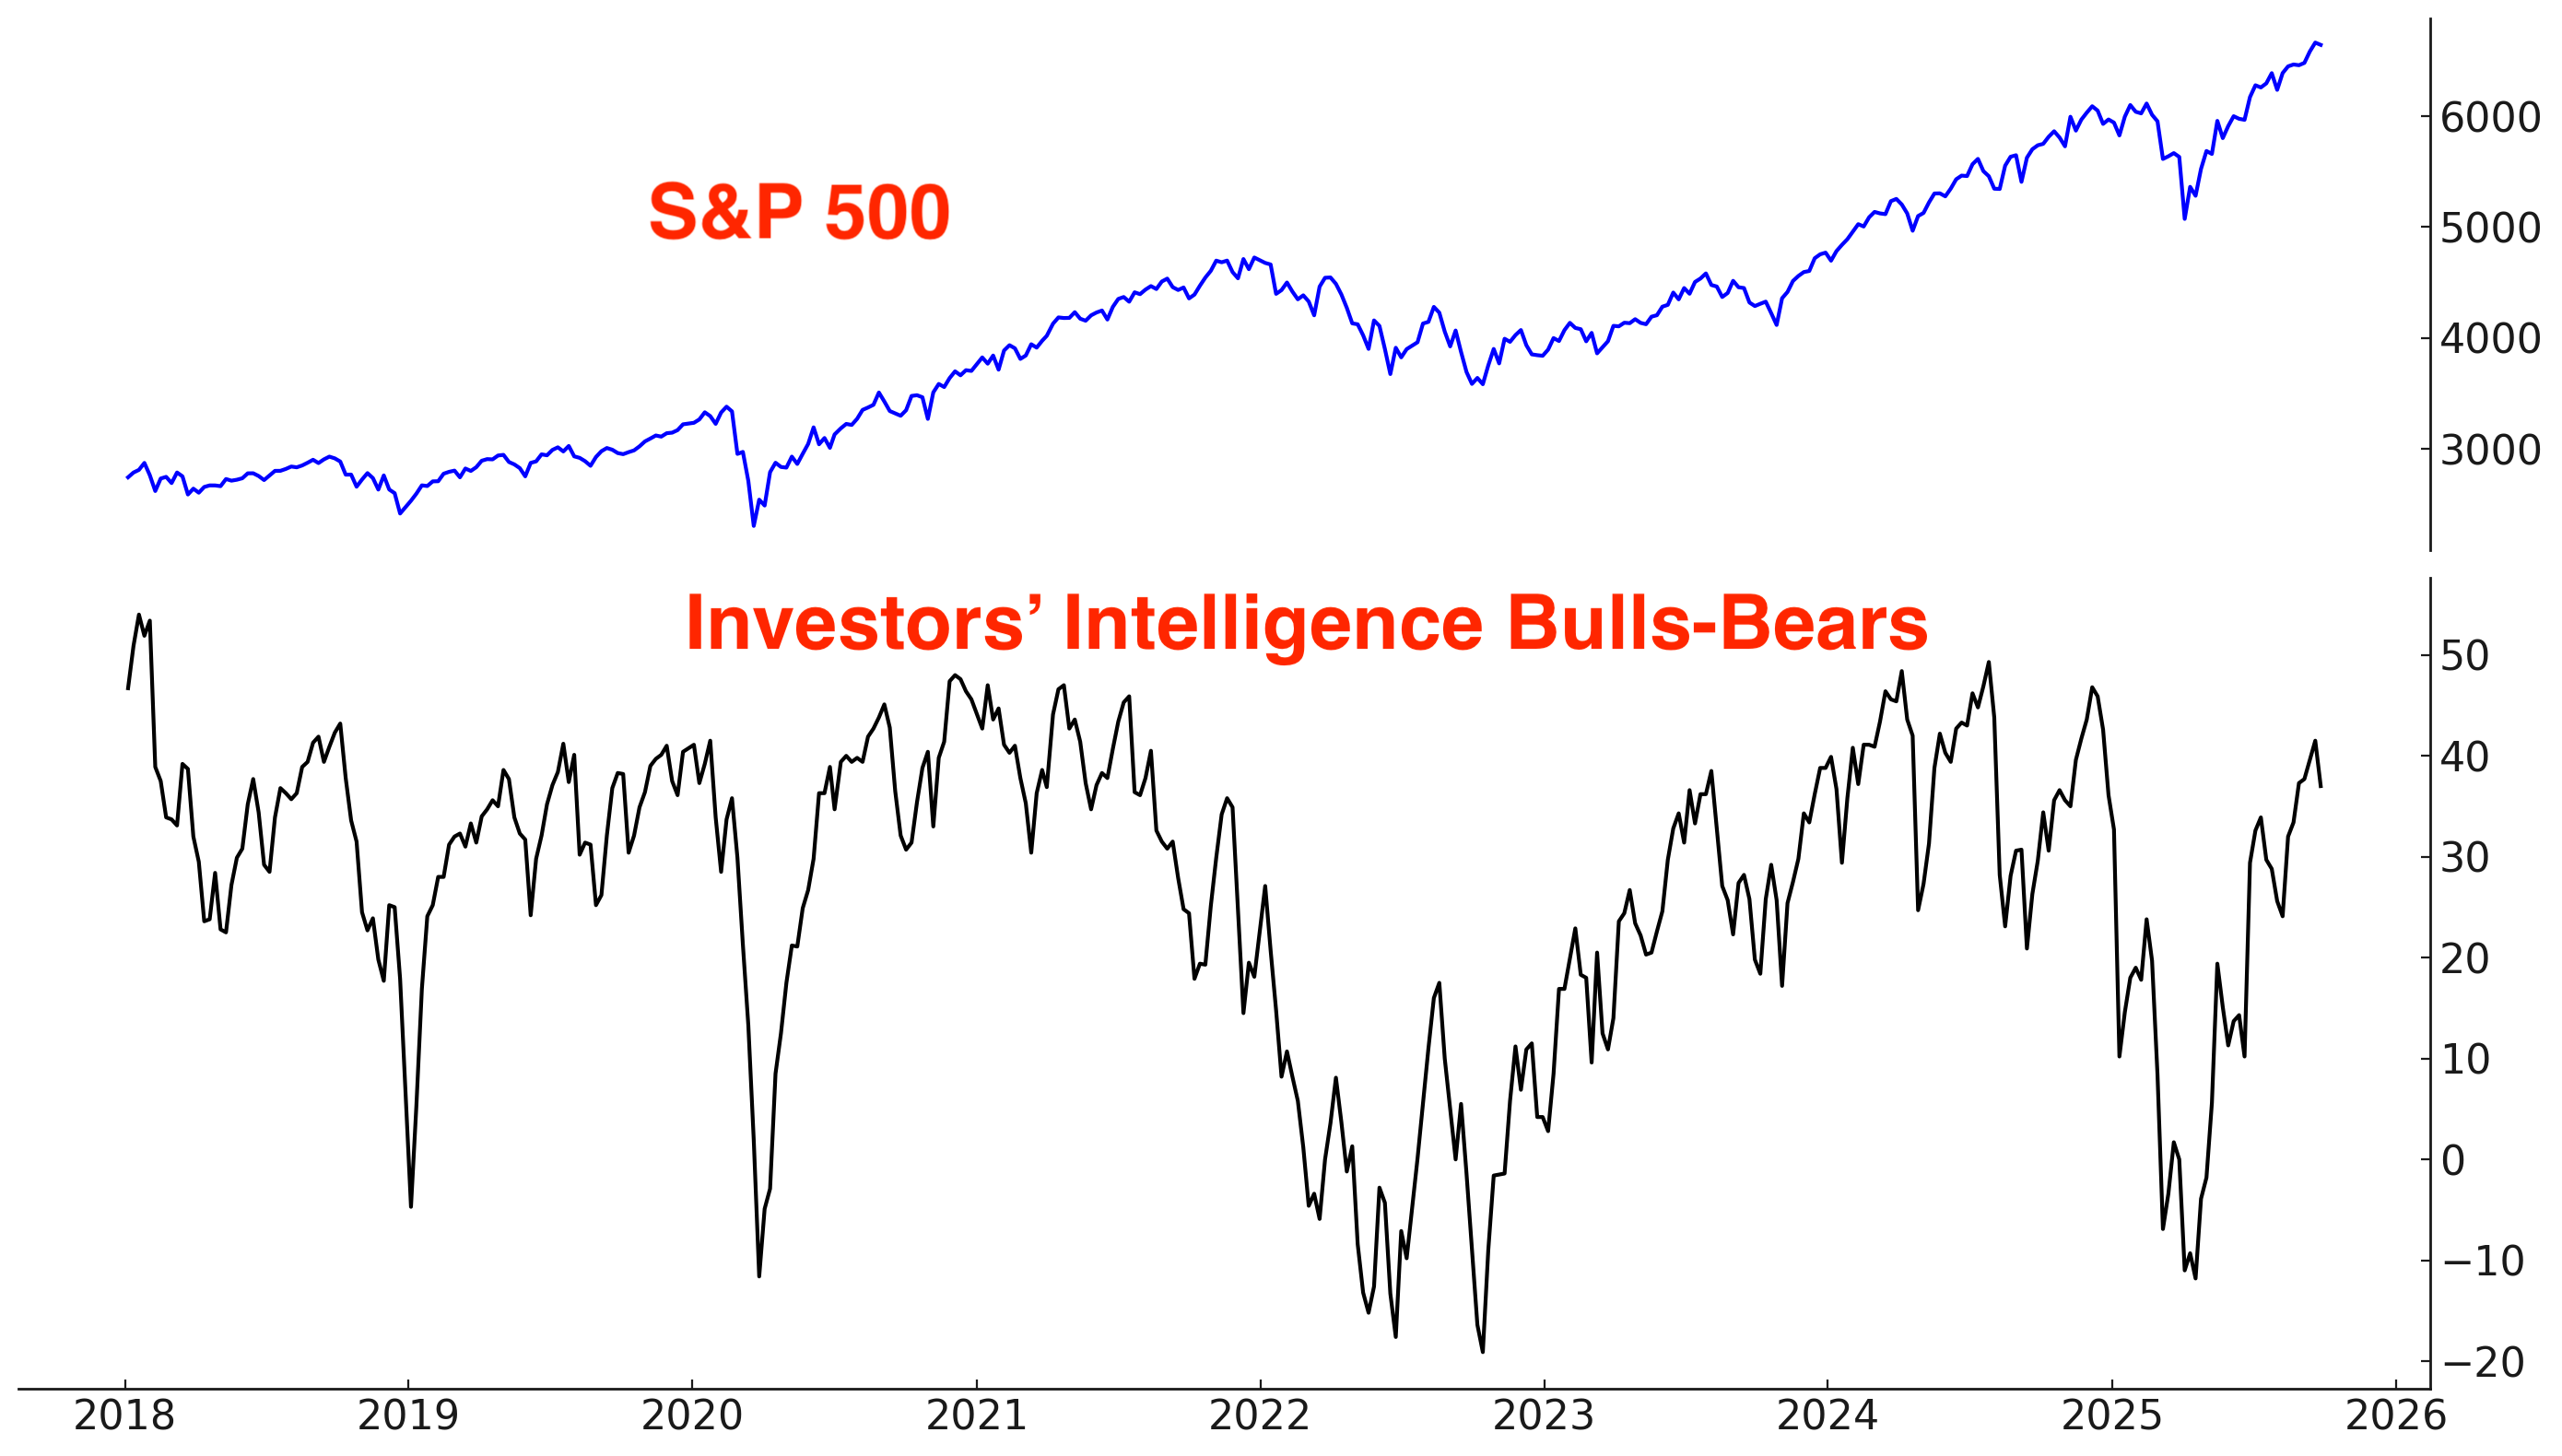
According to the Investors Intelligence report, newsletter writers lean bullish:
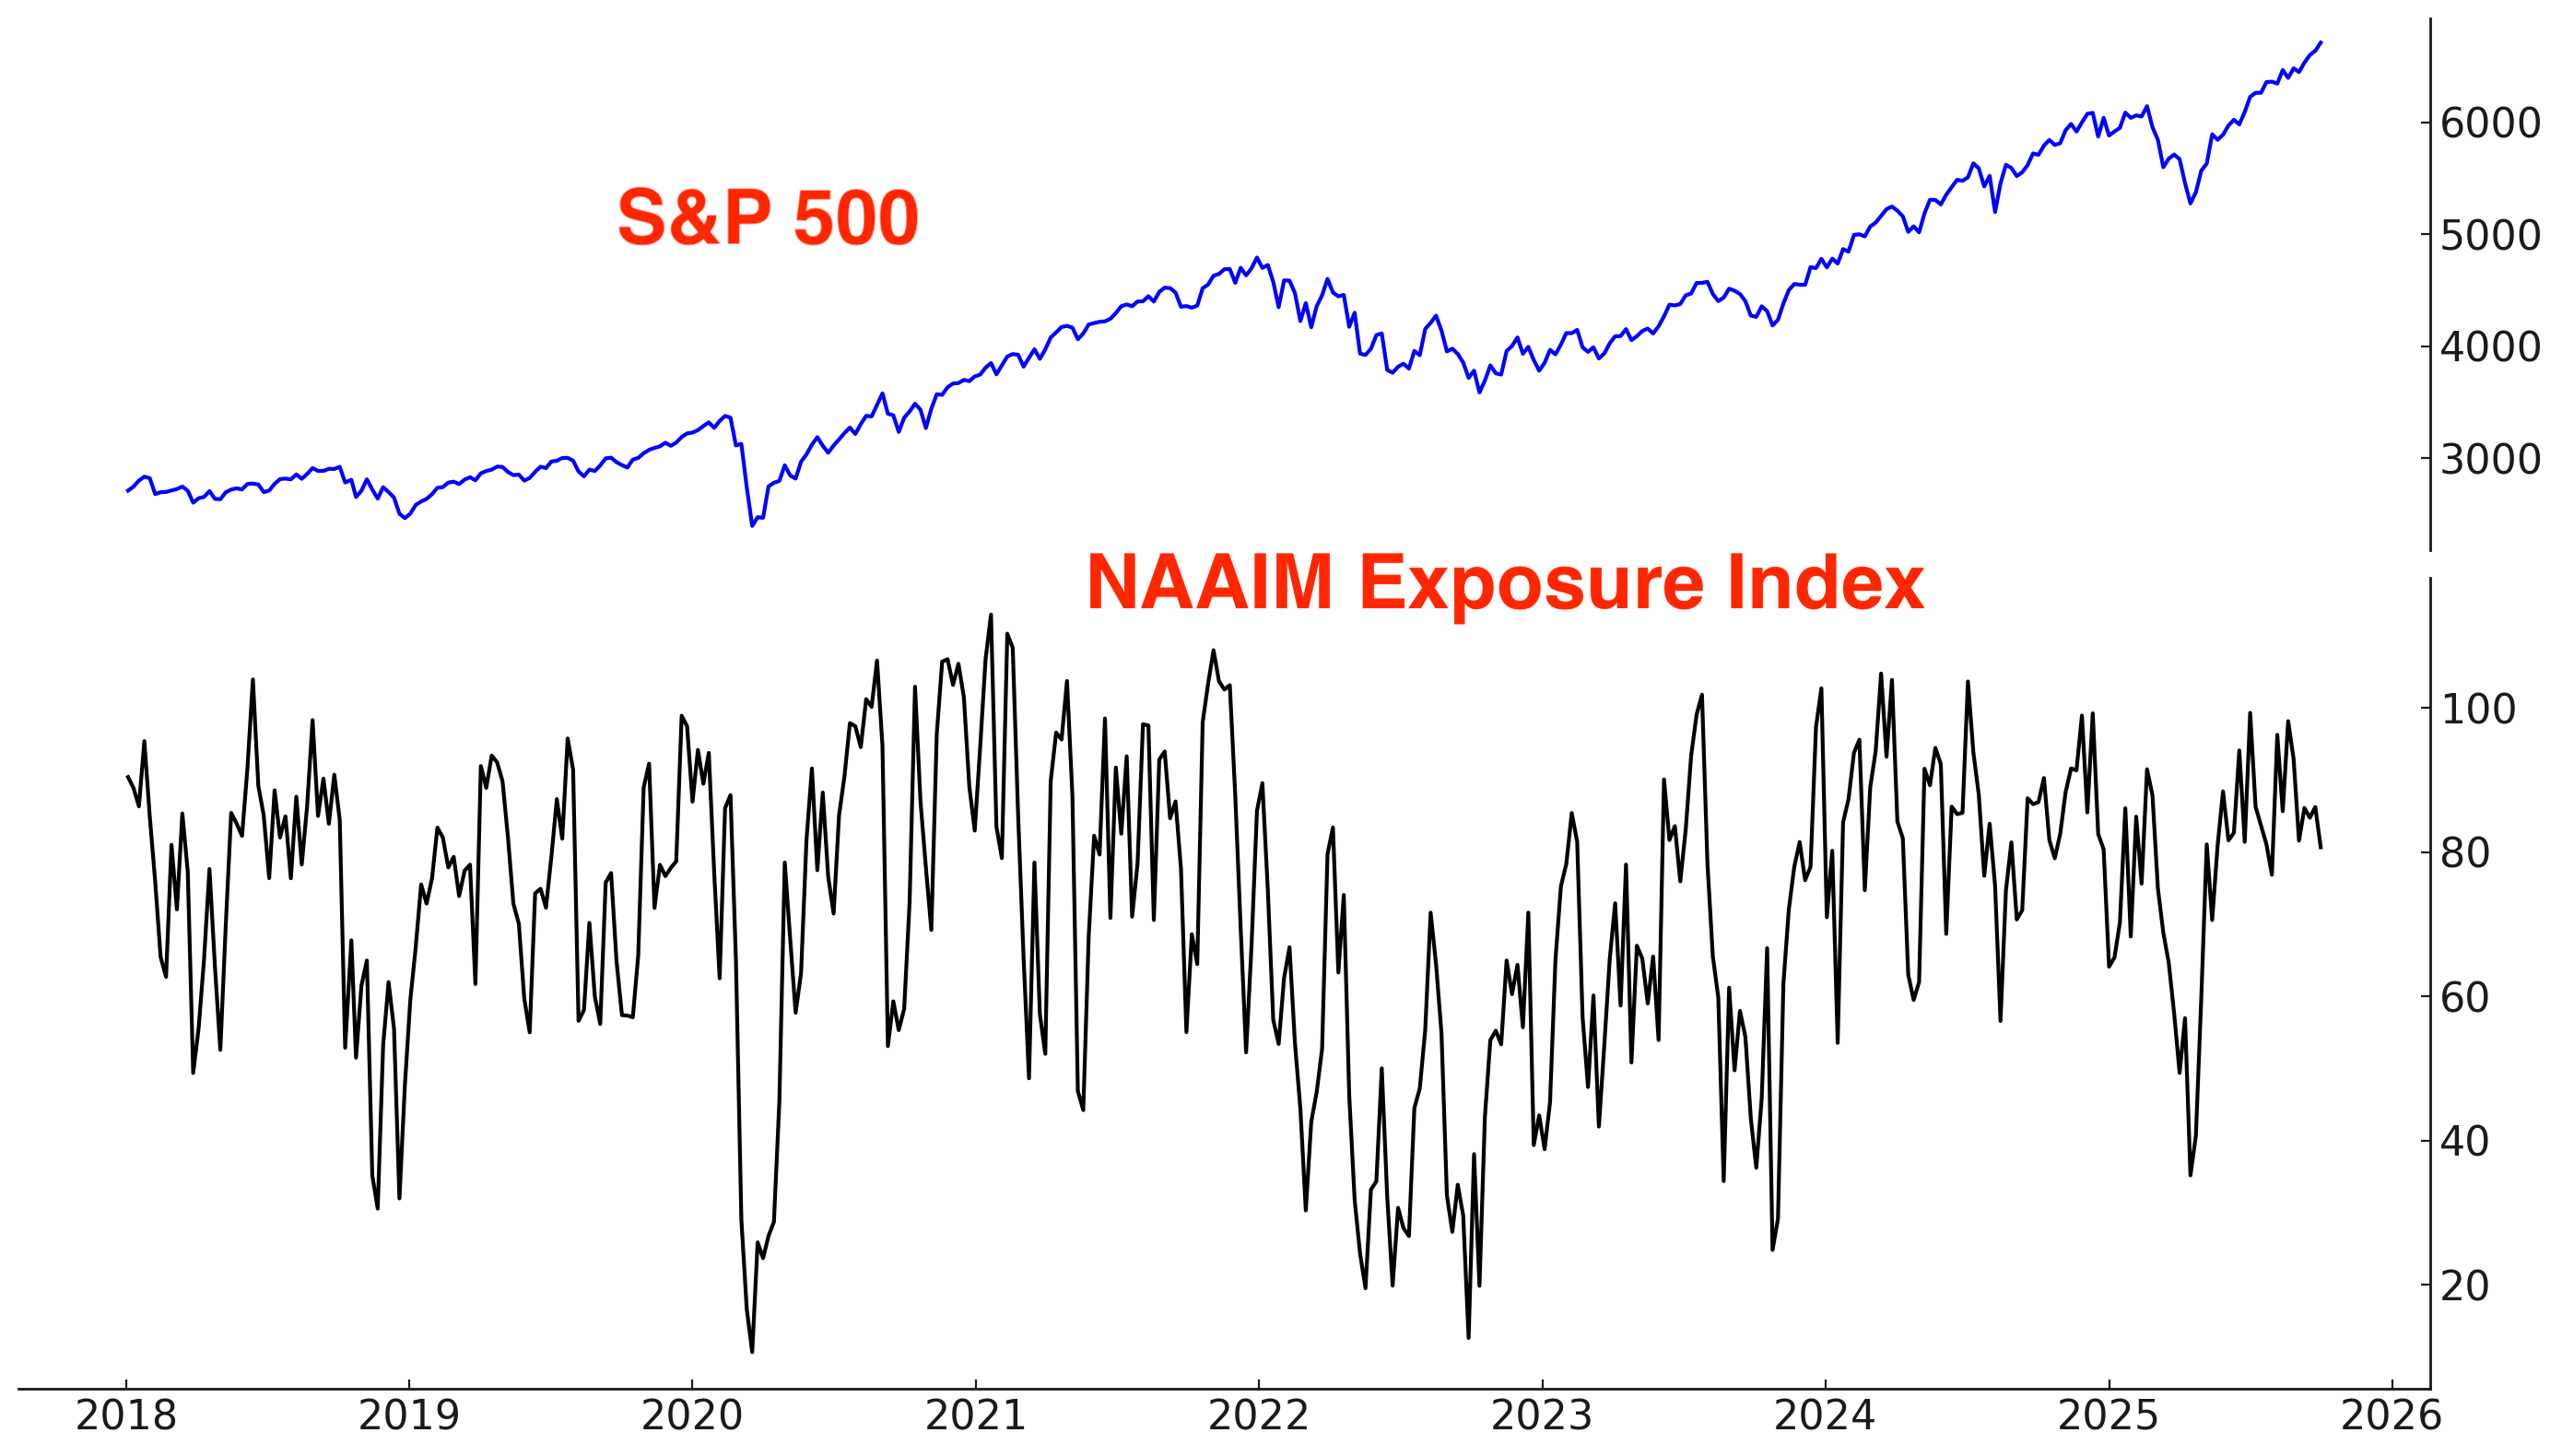
According to the NAAIM Exposure Index, active investment managers are bullish:
Corporate Insiders
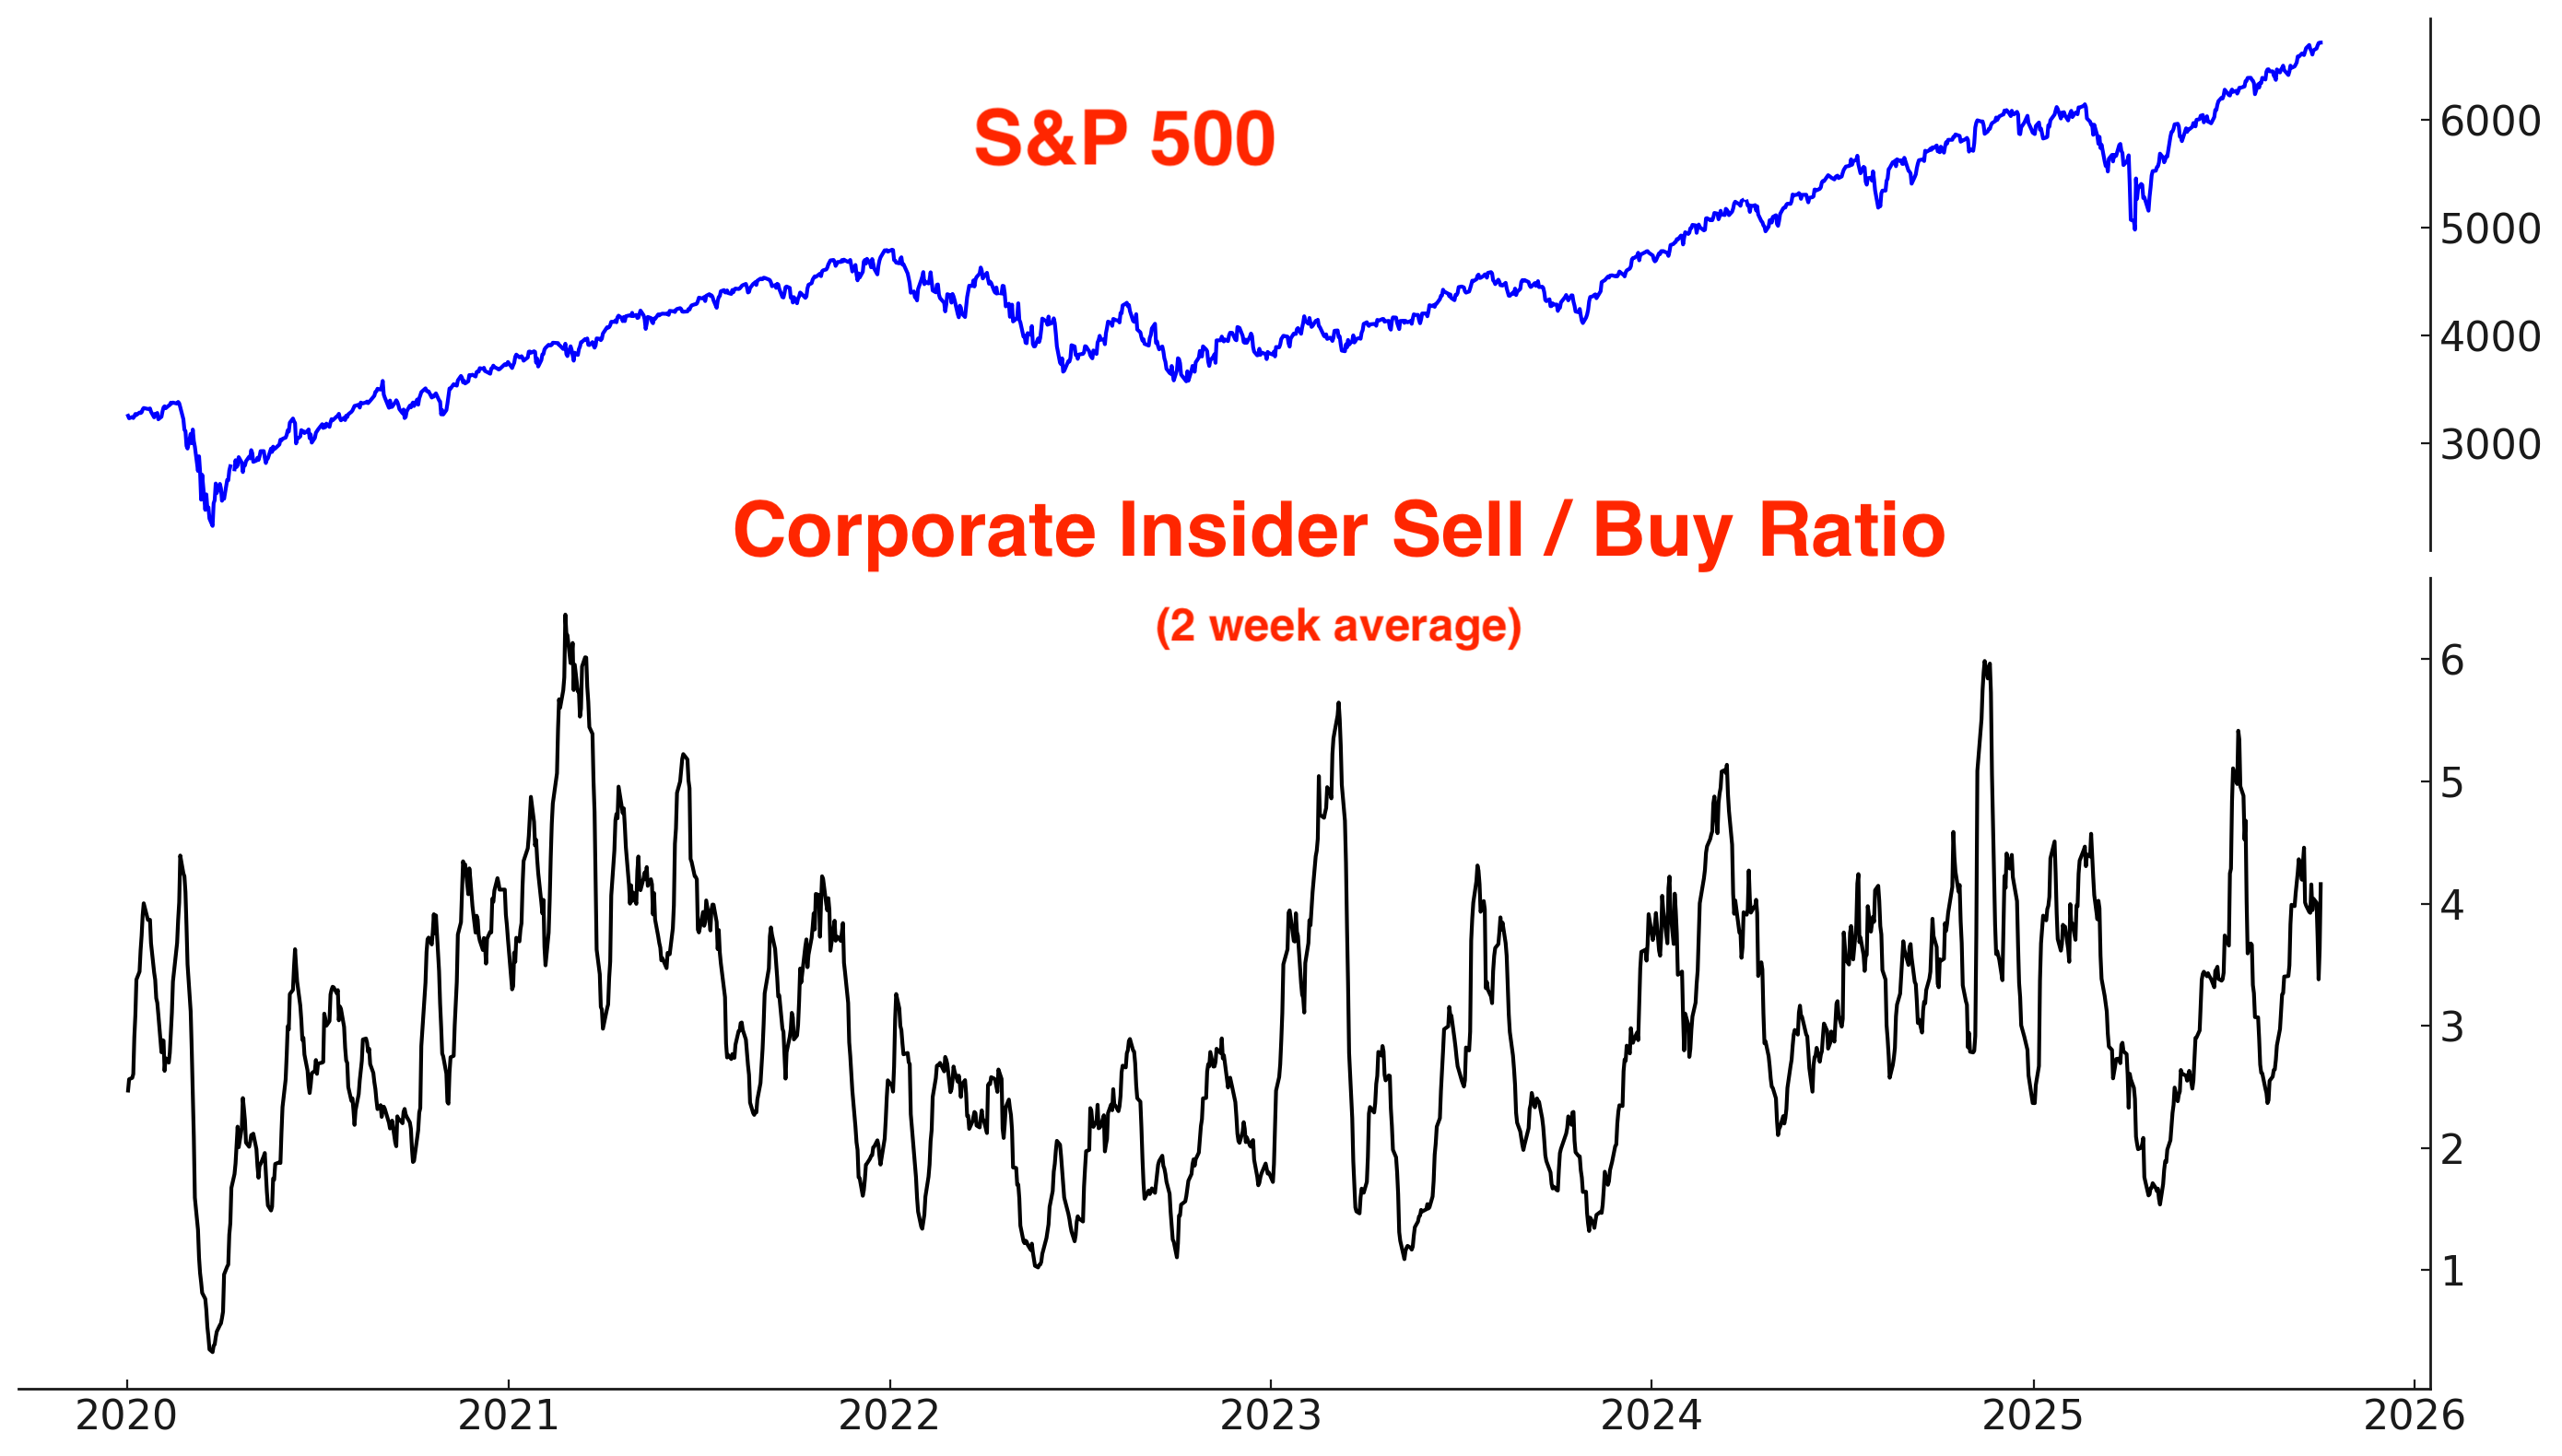
The Corporate Insider Sell/Buy ratio is in neutral territory - neither bullish nor bearish.
Fund Flows
*Fund flows aren’t automatically contrarian. It depends on what type of trader is buying/selling and why. Some ETFs are traded by mean-reversion traders, while other ETFs are traded by trend followers. Moreover, many ETFs are small relative to the underlying market, so fund flows don’t always reflect broad sentiment towards that market.
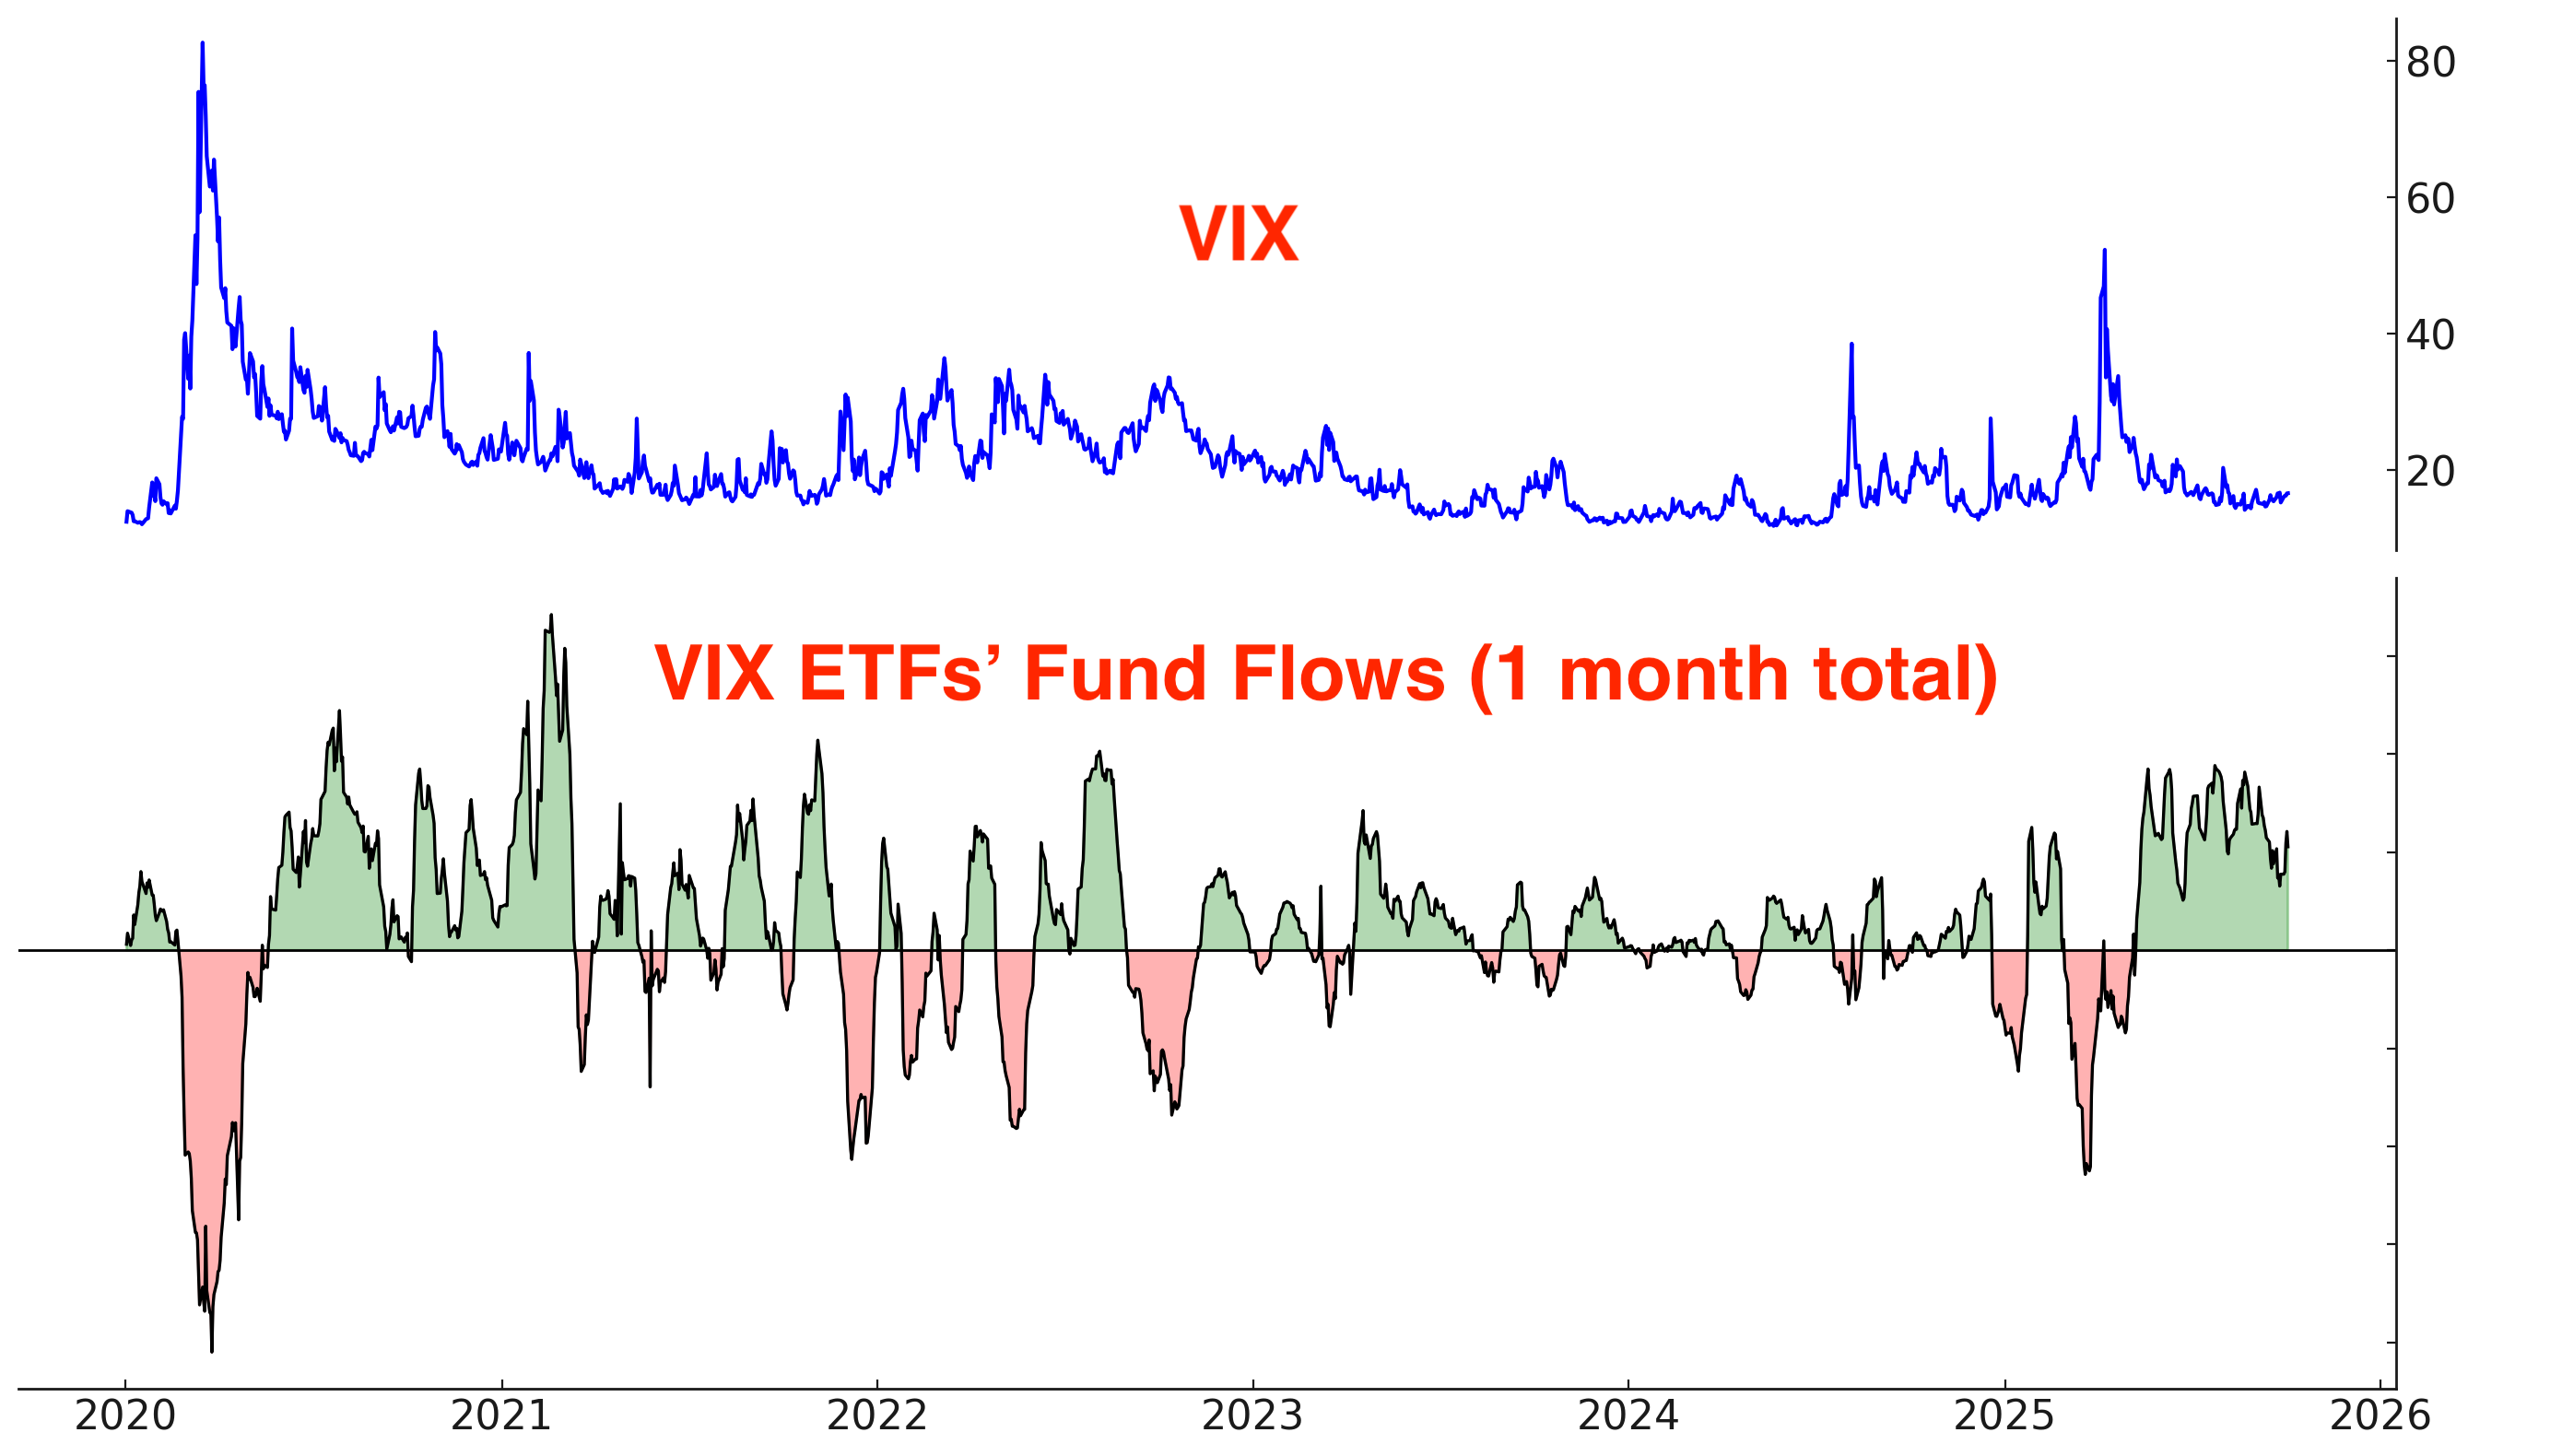
VIX ETFs are traded by mean-reversion traders; they buy when VIX is low and sell (take profits) when VIX is high.
VIX ETFs have seen non-stop inflows over the past few months. These traders are betting on stocks to pullback and VIX to jump:
Breadth
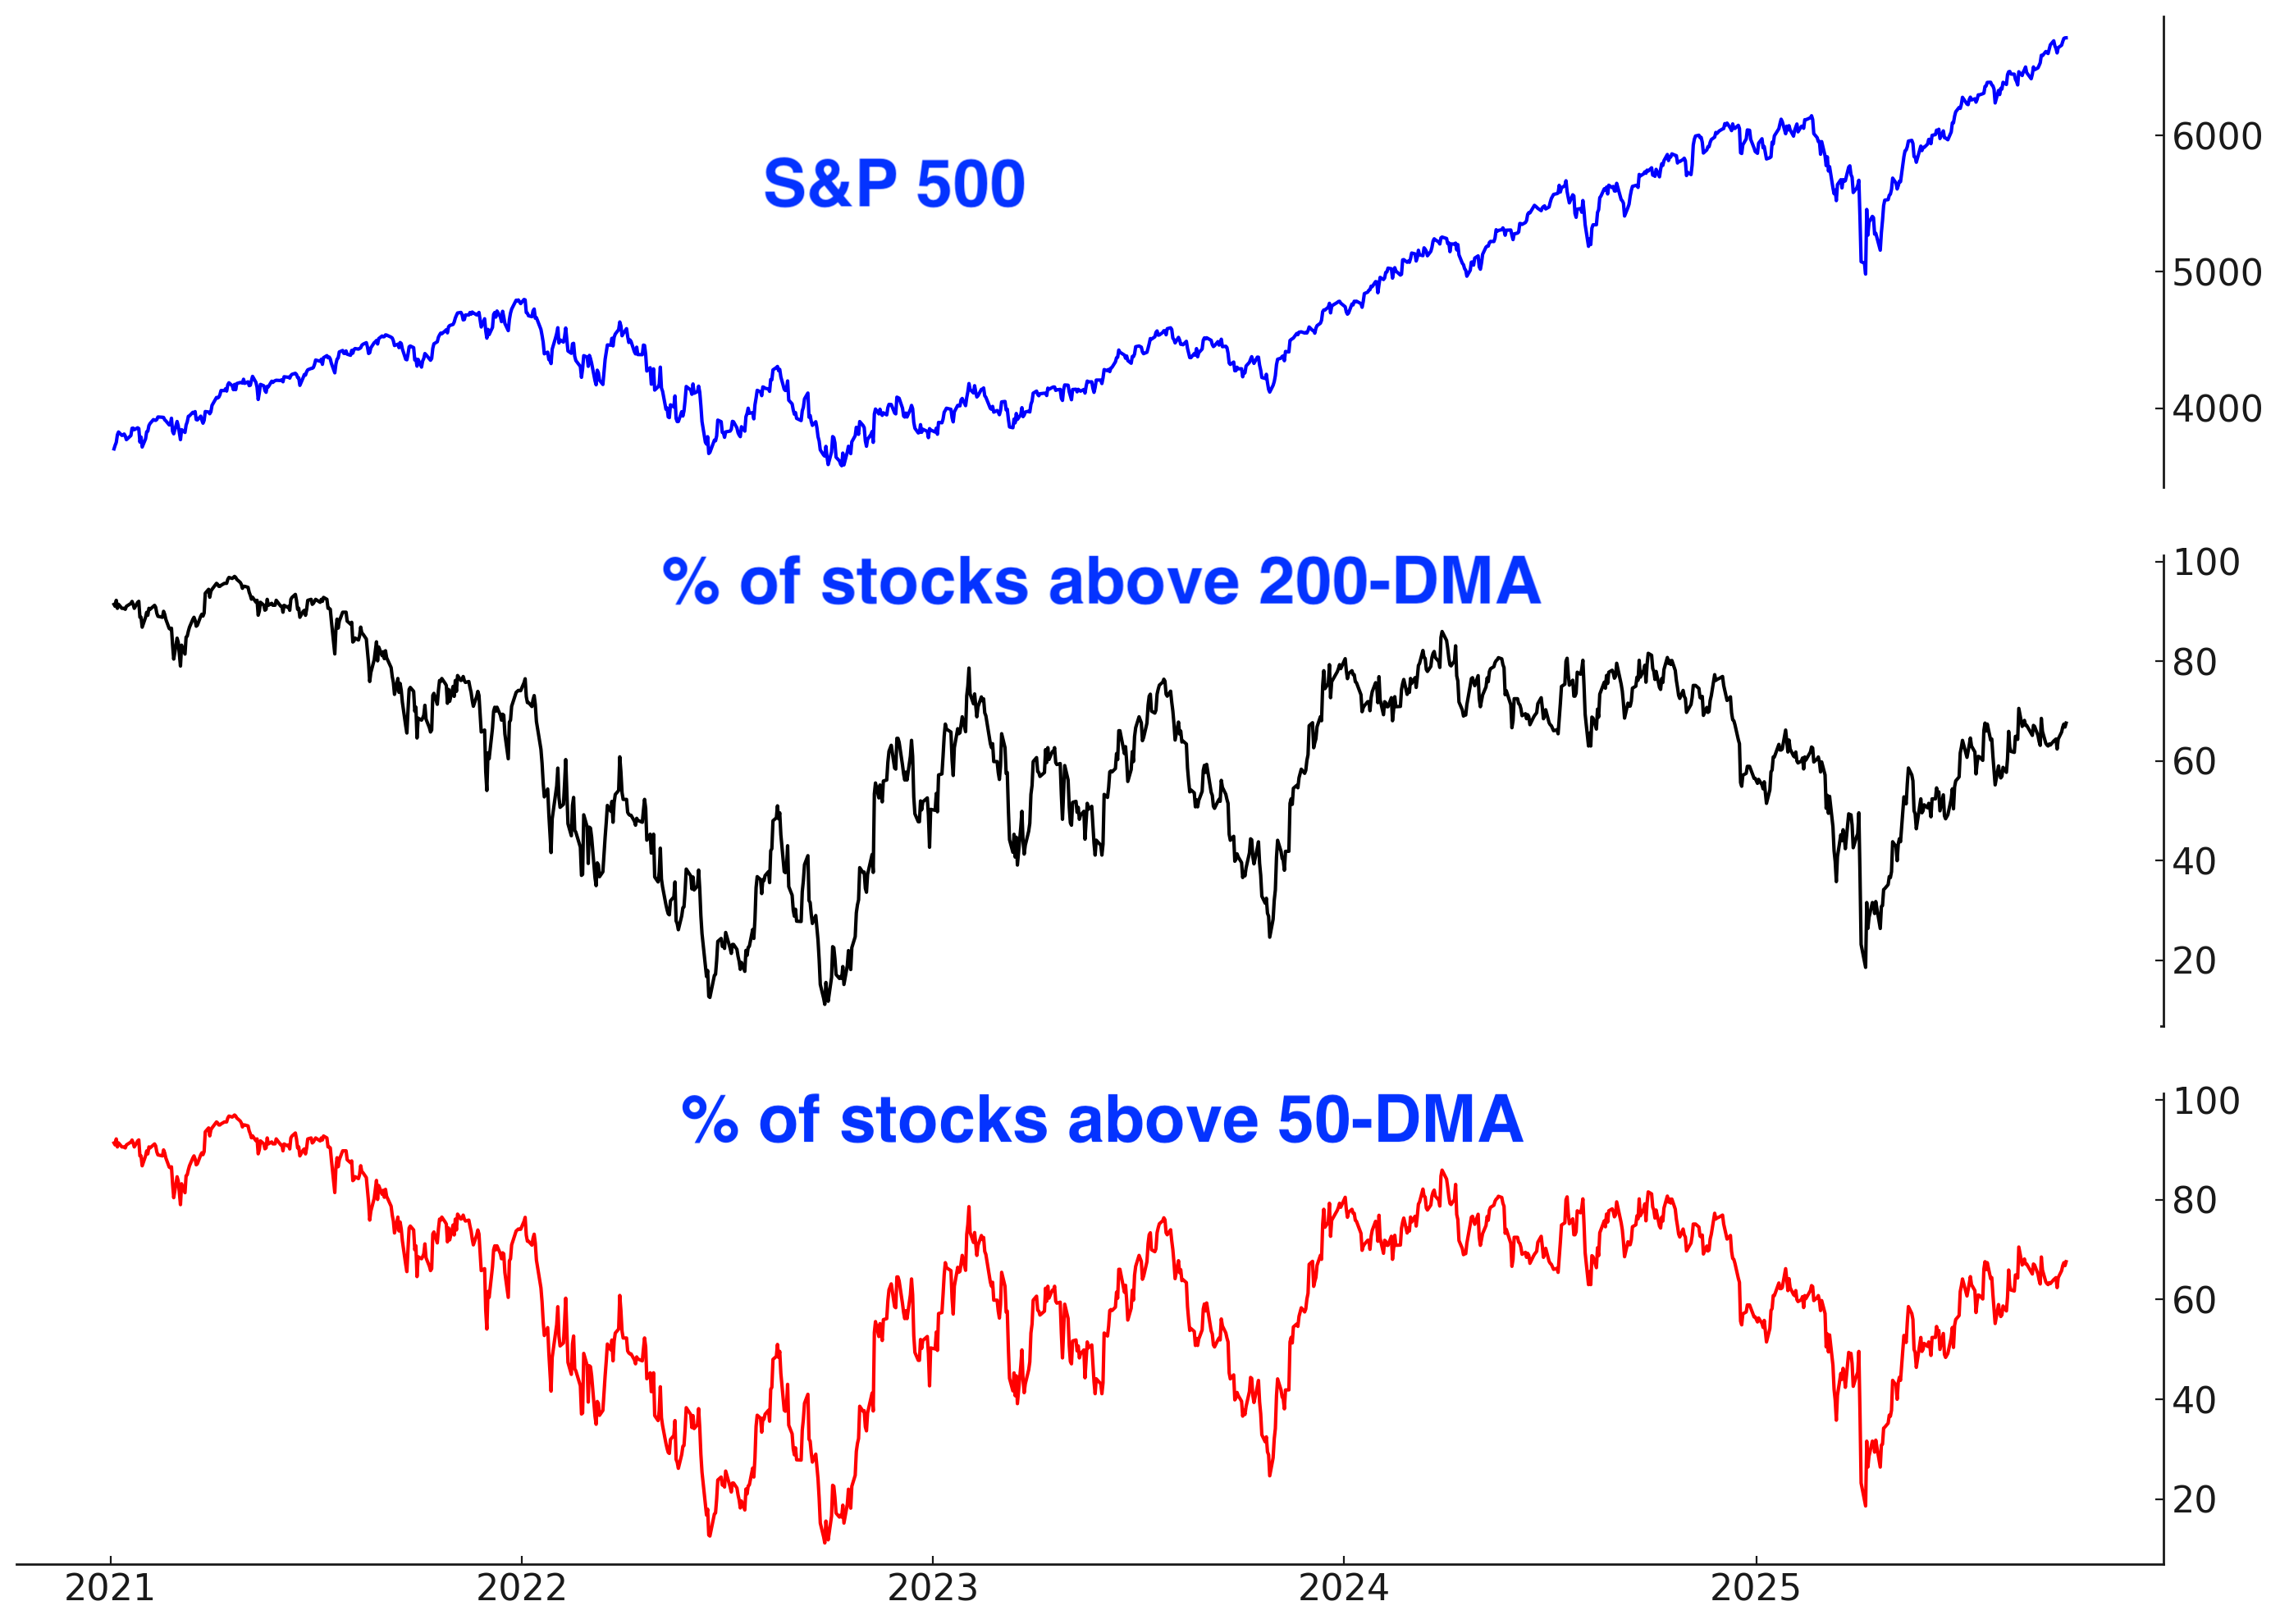
Here are the % of S&P 500 stocks above their 200 and 50 day moving averages: nothing abnormal.
Trend
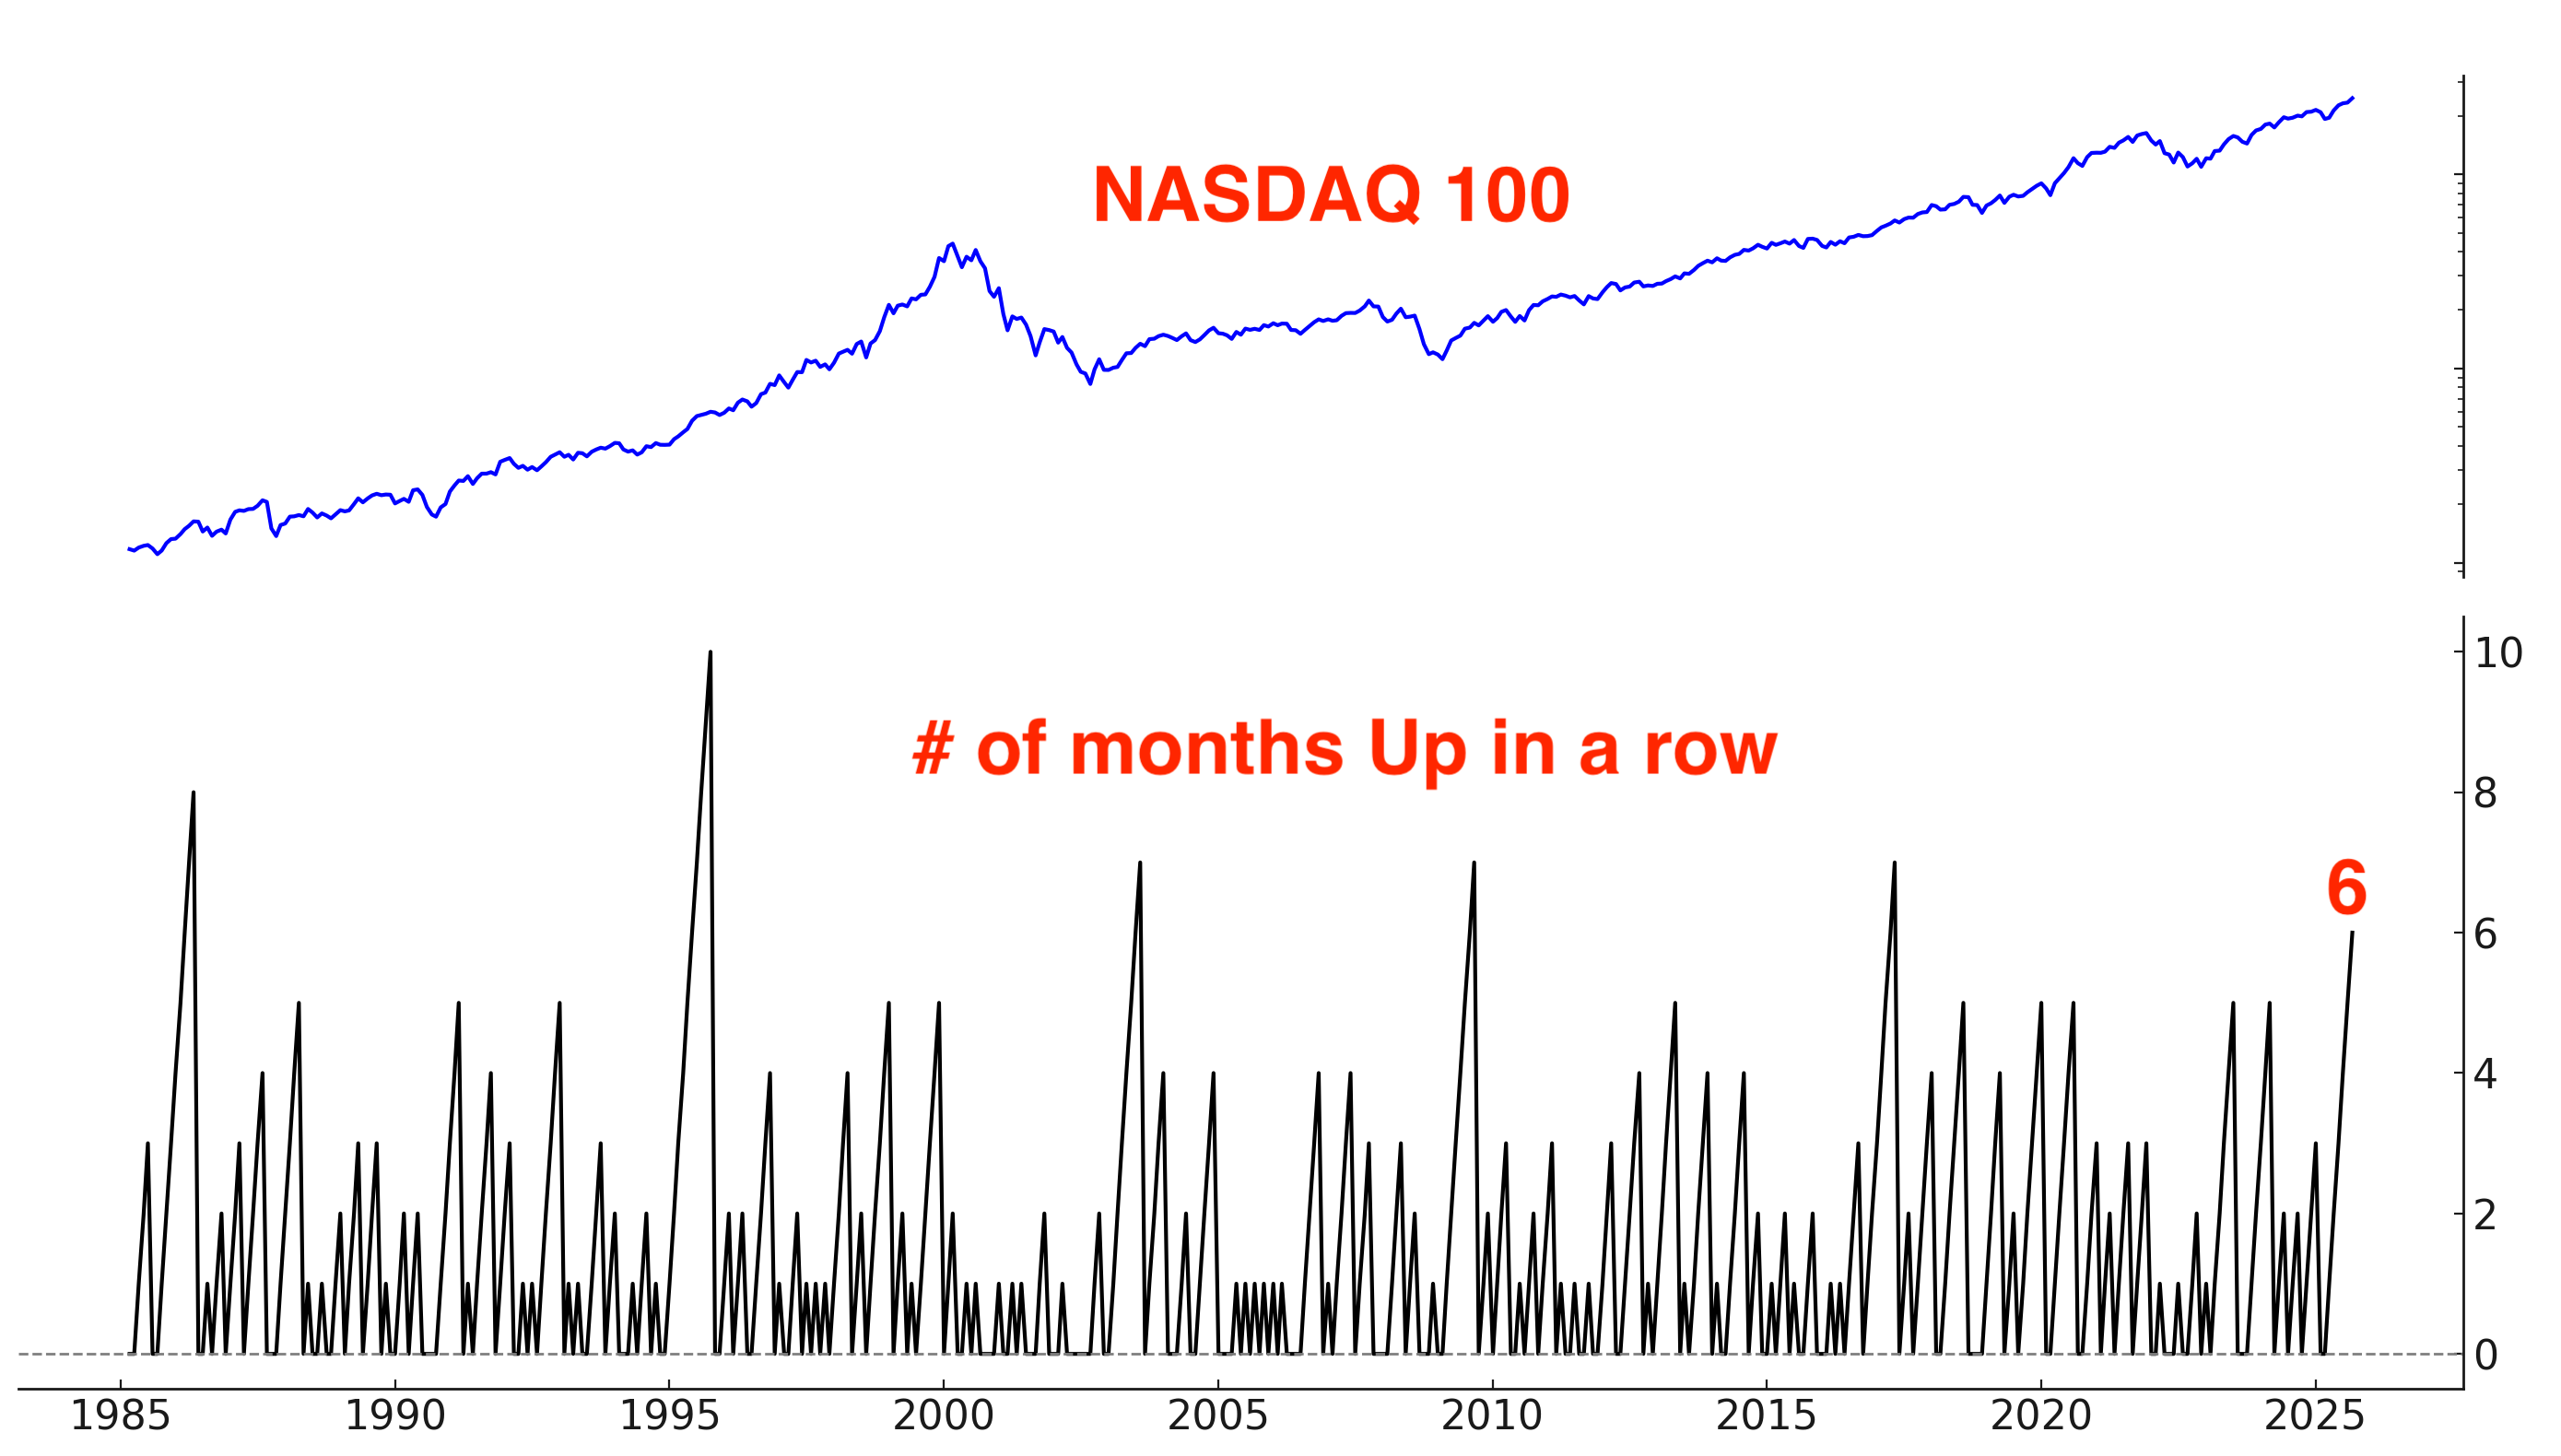
The trend is your friend, until it ends. Stocks are still trending higher:
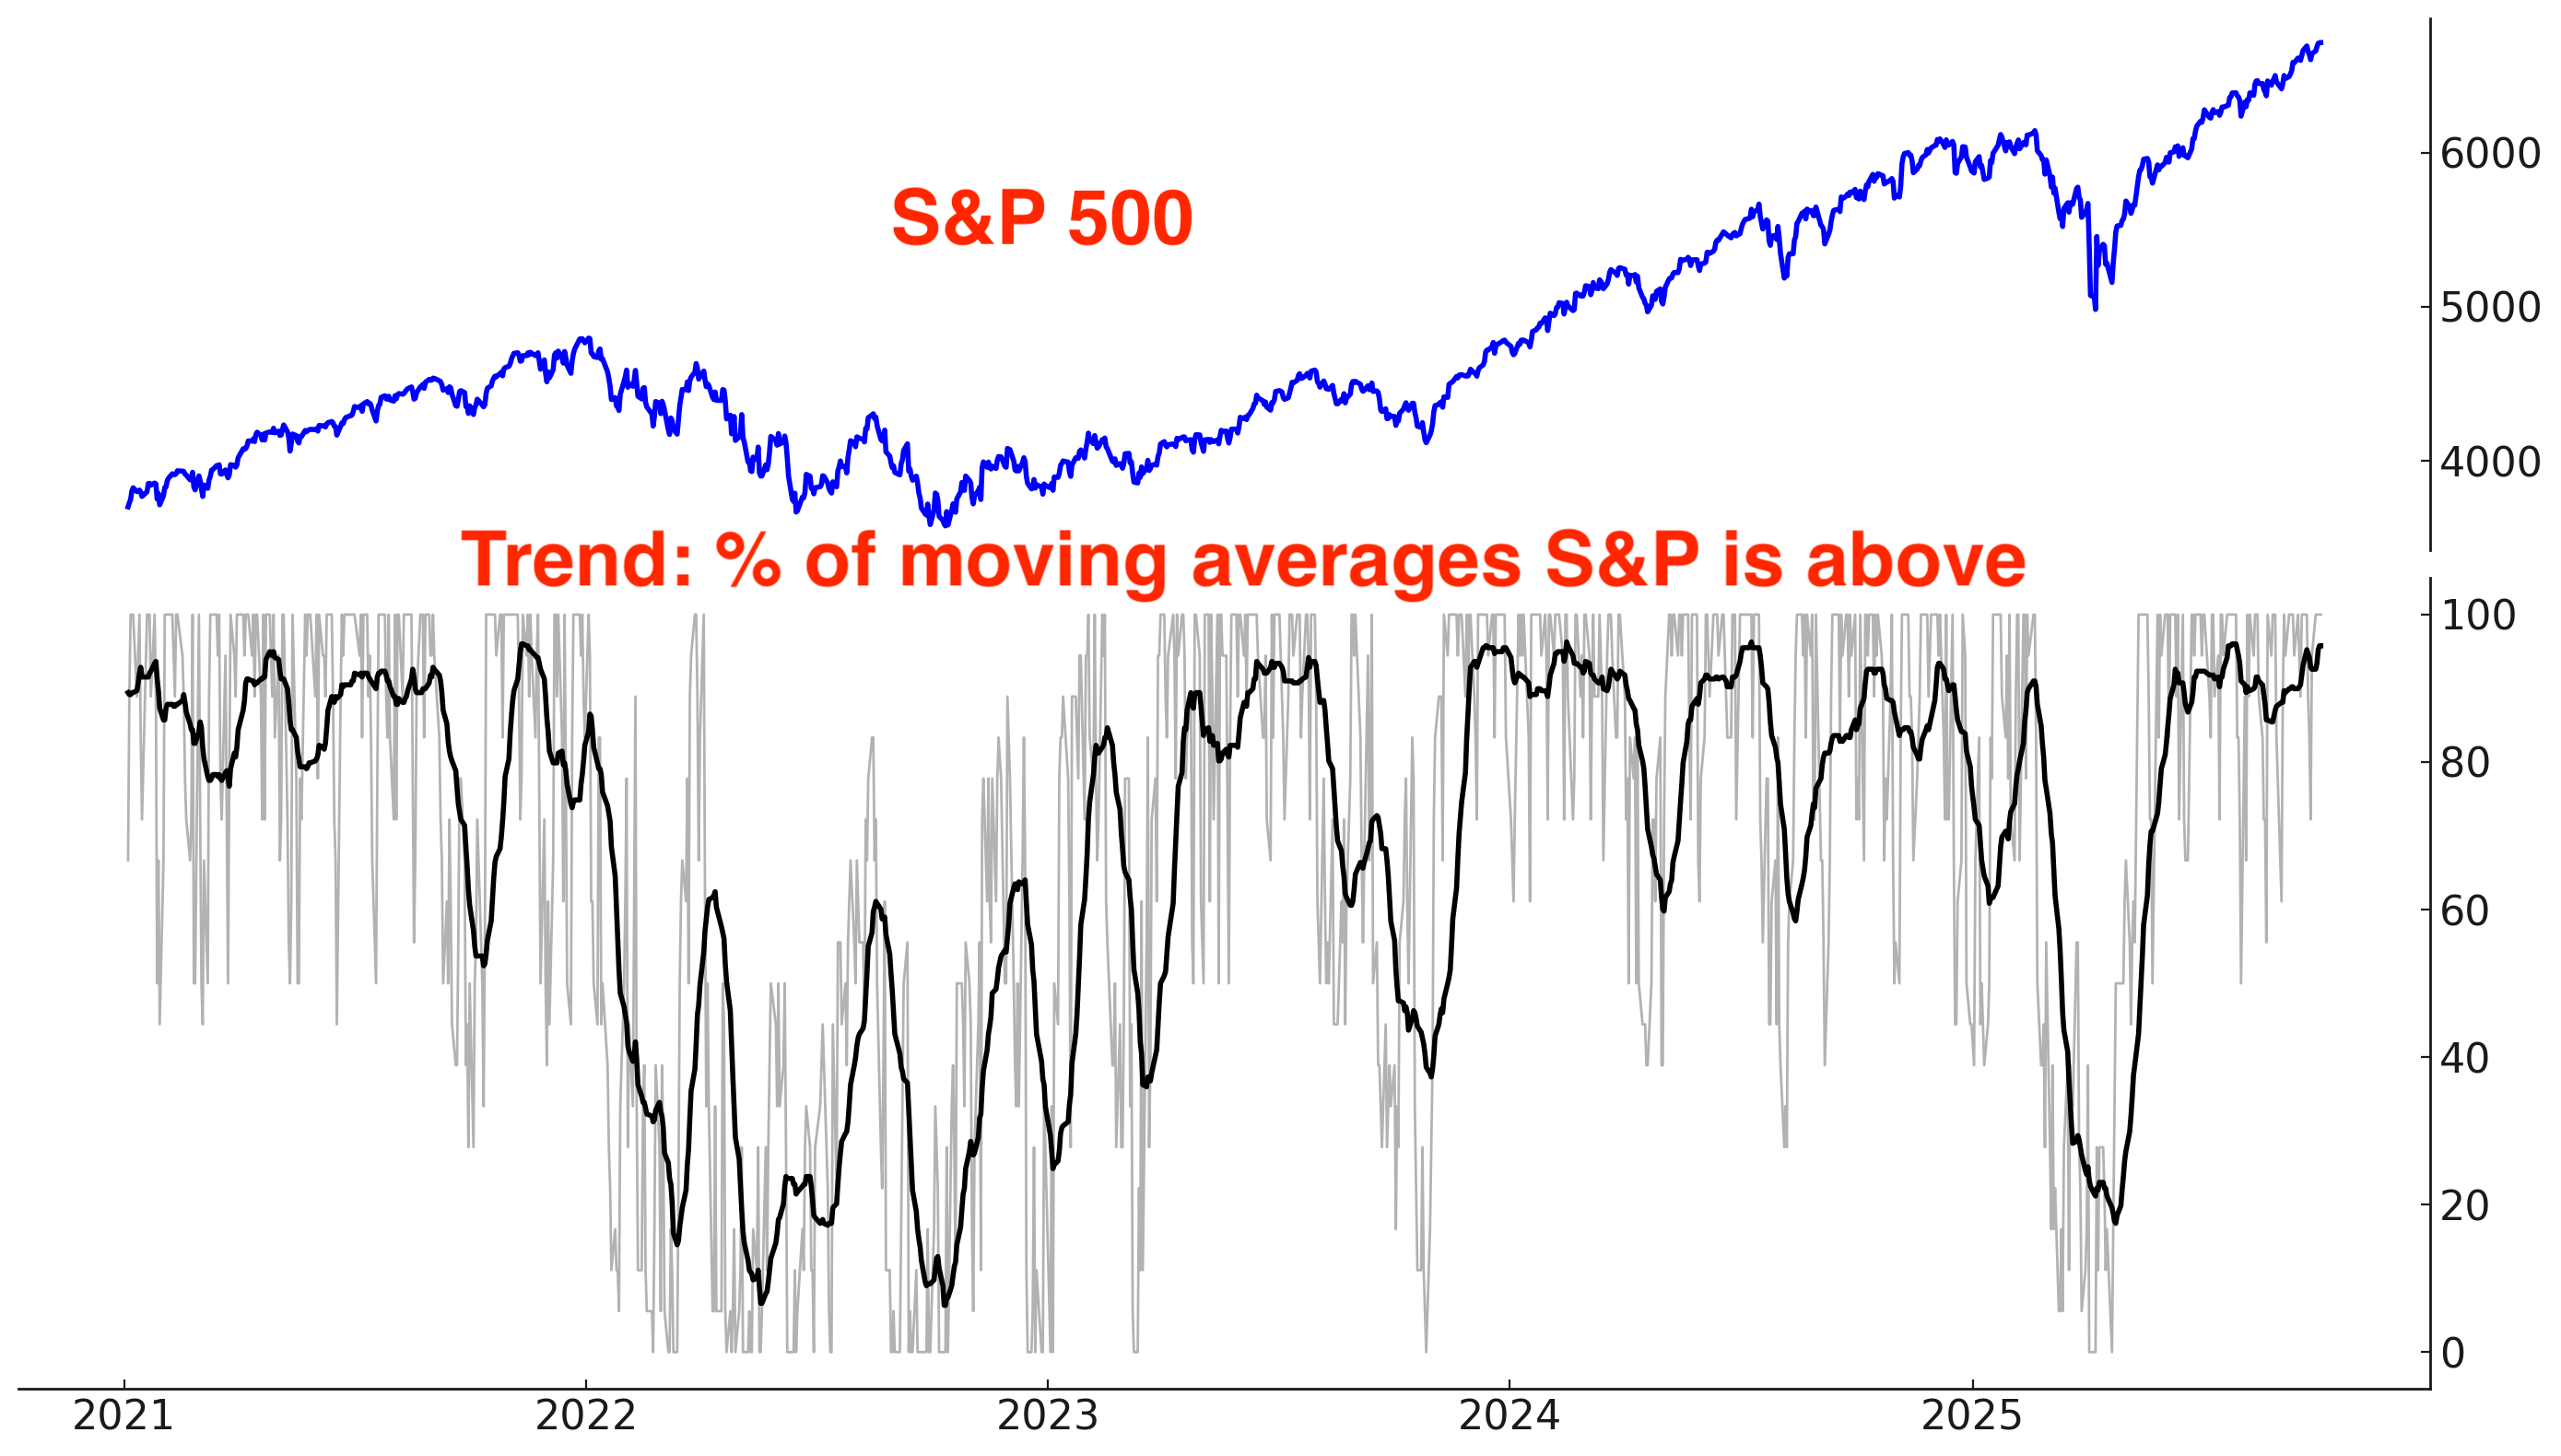
Why does trend matter? Because at least from a trend following perspective, it’s better to buy when the market is trending Up (e.g. above its 200-DMA) than when the market is trending Down (e.g. below its 200-DMA).
*There is nothing “special” about the 200 day moving average, except the fact that it’s popular. It is not significantly different from the 195, 190, 185, 180, 205, 210, 215, or 220 moving averages.
Long above vs. below the S&P 500’s 200 day moving average:

Long above vs. below the S&P 500’s 50 day moving average:

Long above vs. below the S&P 500’s 20 day moving average:

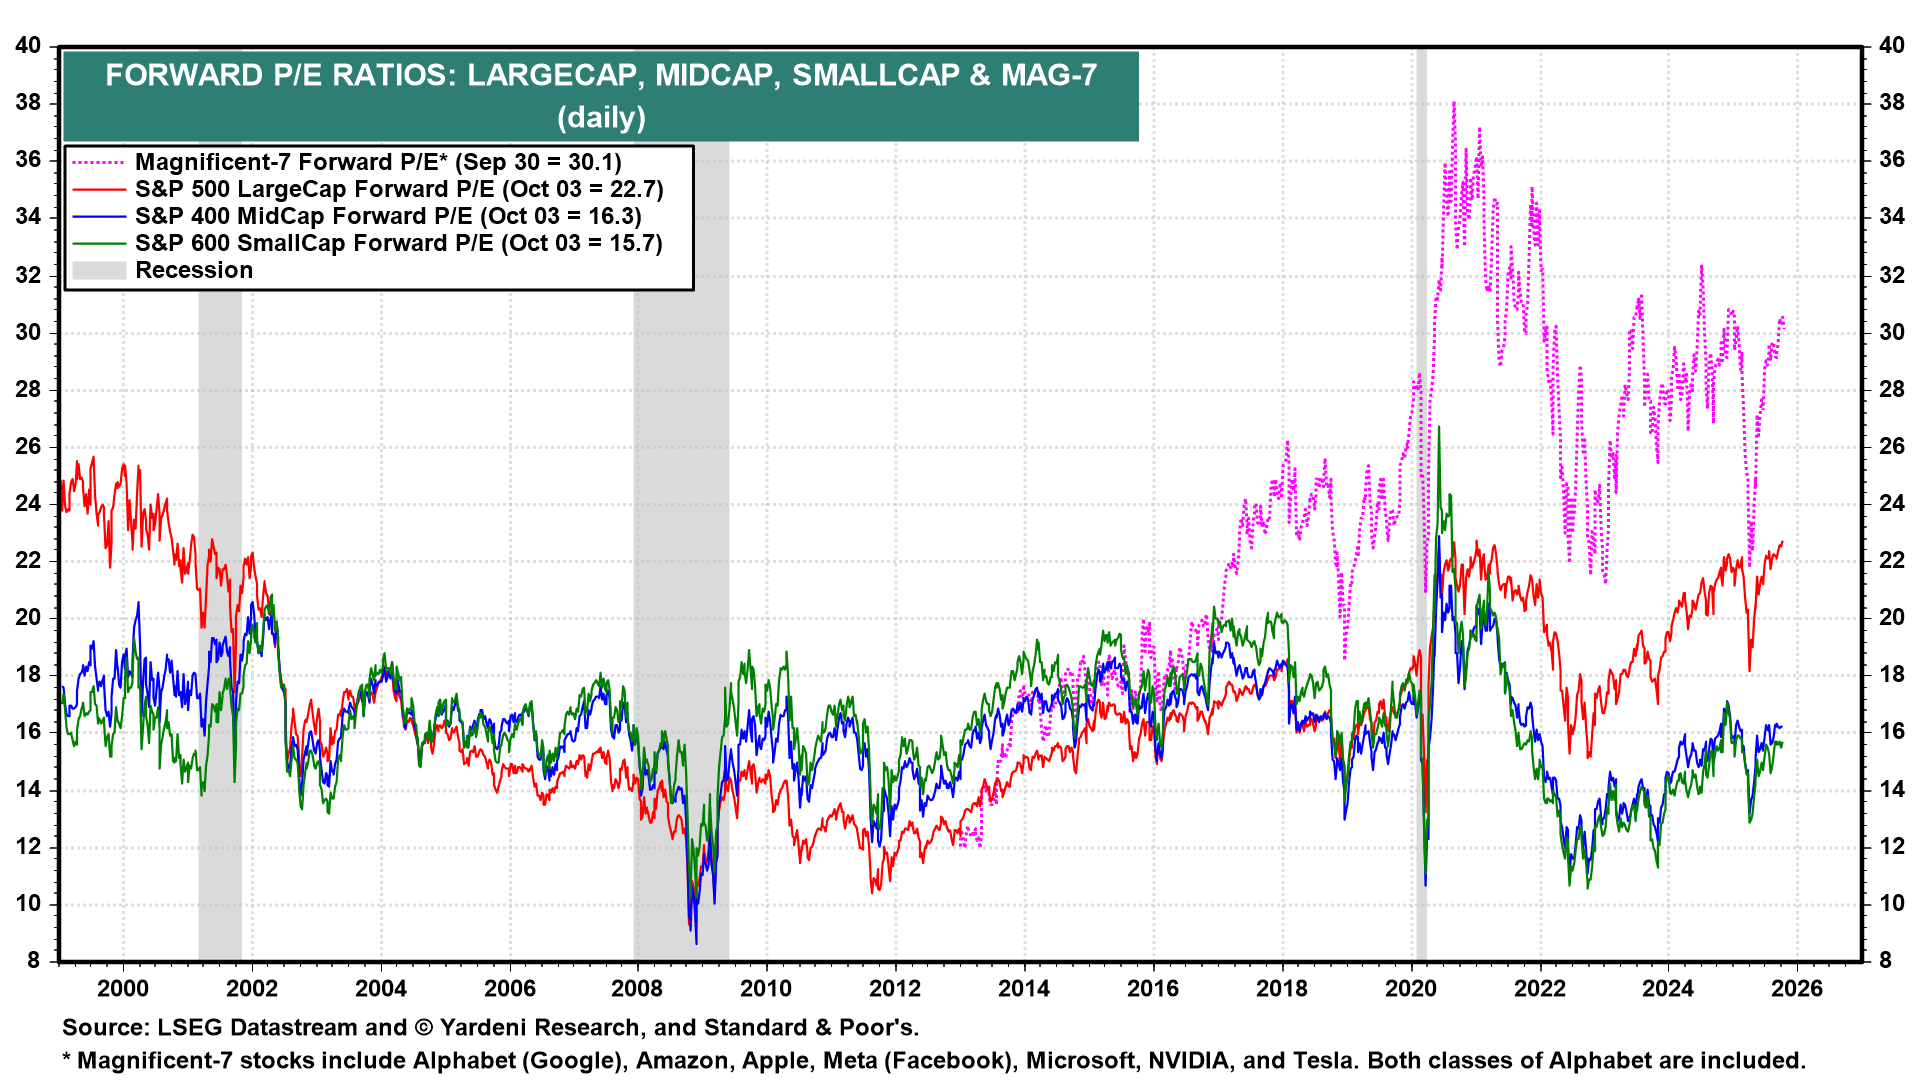
Earnings & Valuations
Some traders say that valuations and fundamentals are useless, and that “only price matters”. While this is true for day traders (valuations have zero impact on the market’s short term direction), fundamentals matter for traders and investors with longer term horizons.
Valuations for large cap stocks (S&P 500) remain elevated compared to their 10 year average:
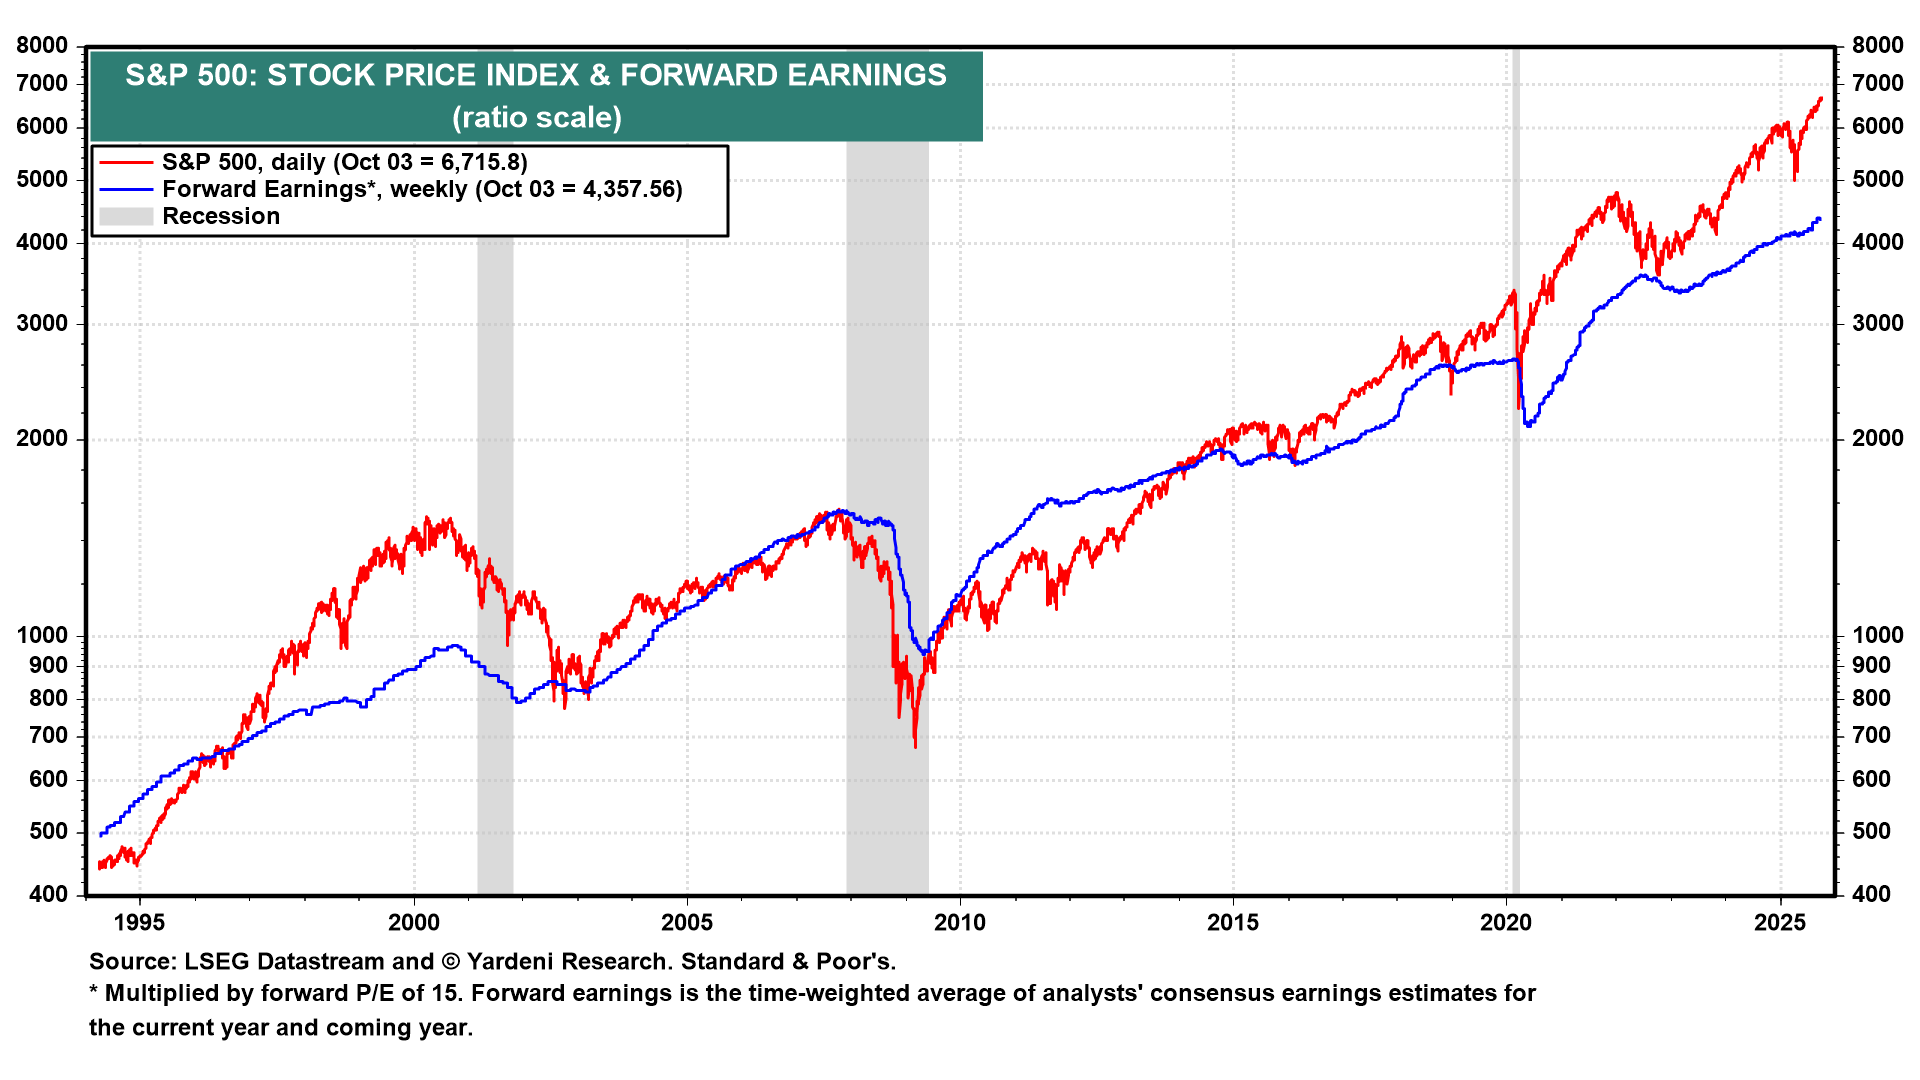
Here’s the S&P 500’s forward earnings expectations. In the long run, earnings and stock prices move in the same direction. Earnings are still growing right now.