Markets Report: new highs and strong breadth signal
Stocks continue to make new highs.

Another week, more all time highs. Tuesday and Wednesday saw 80% of S&P 500 stocks go Up:
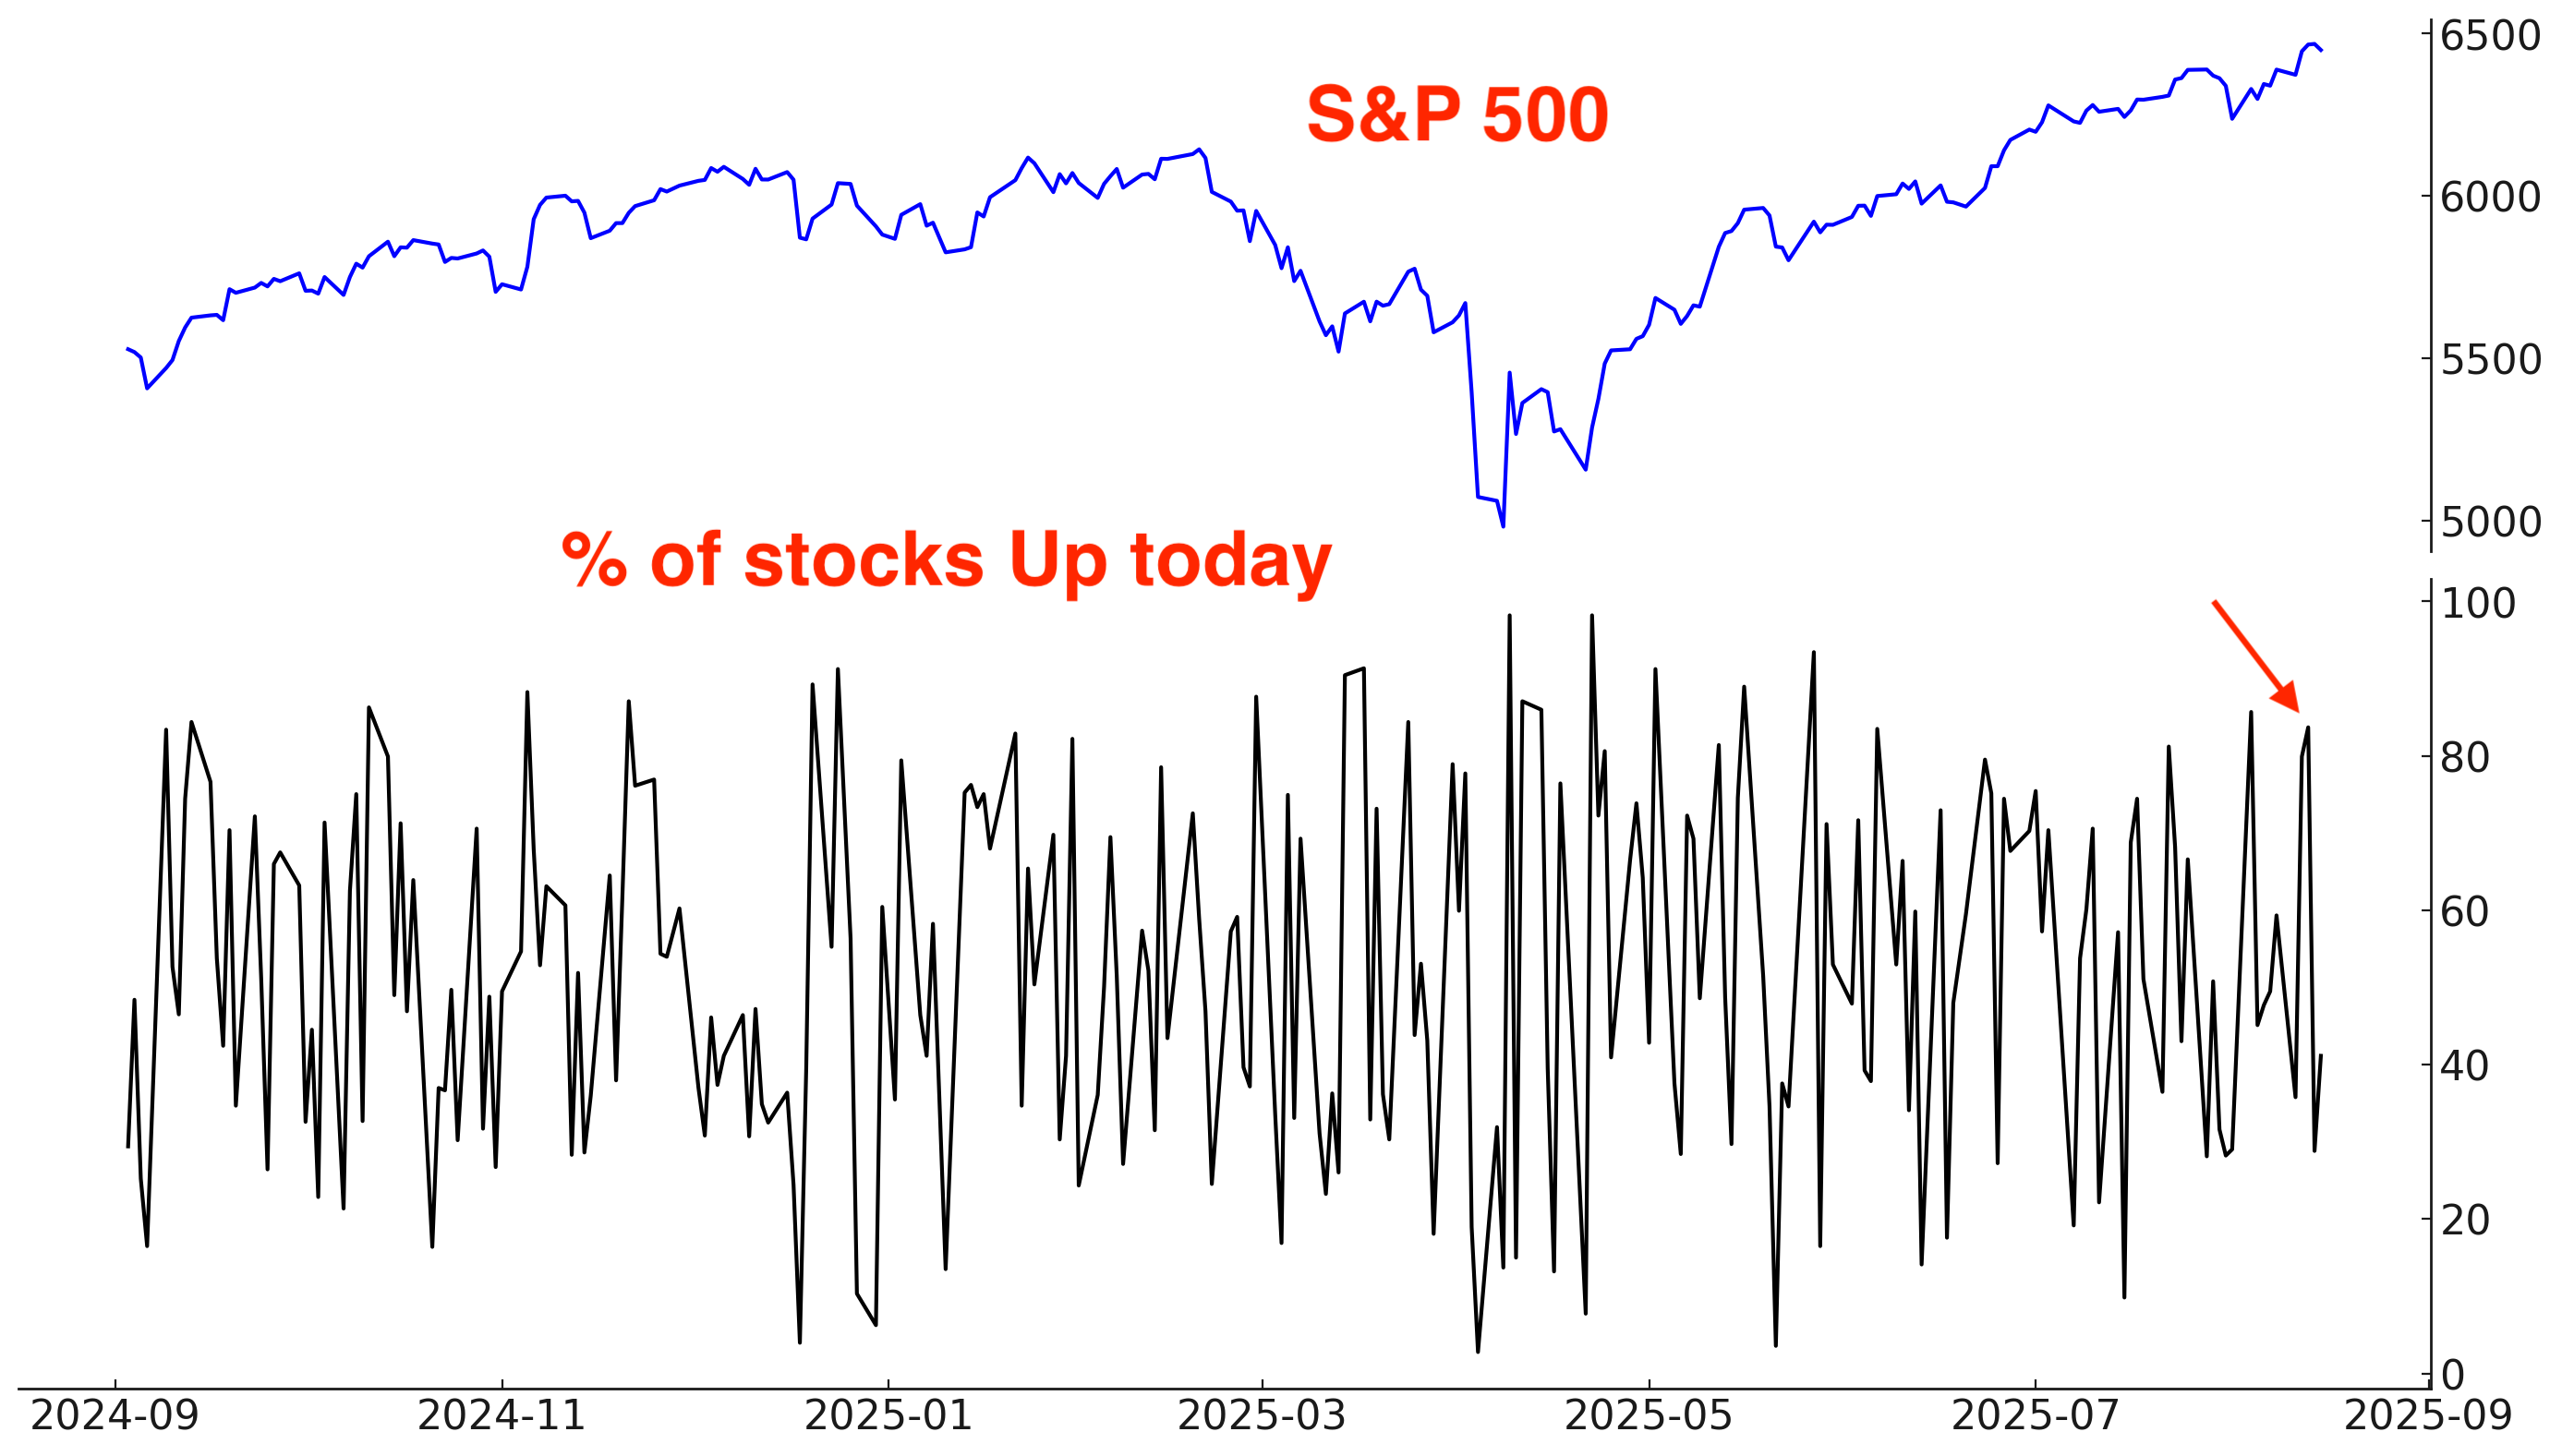
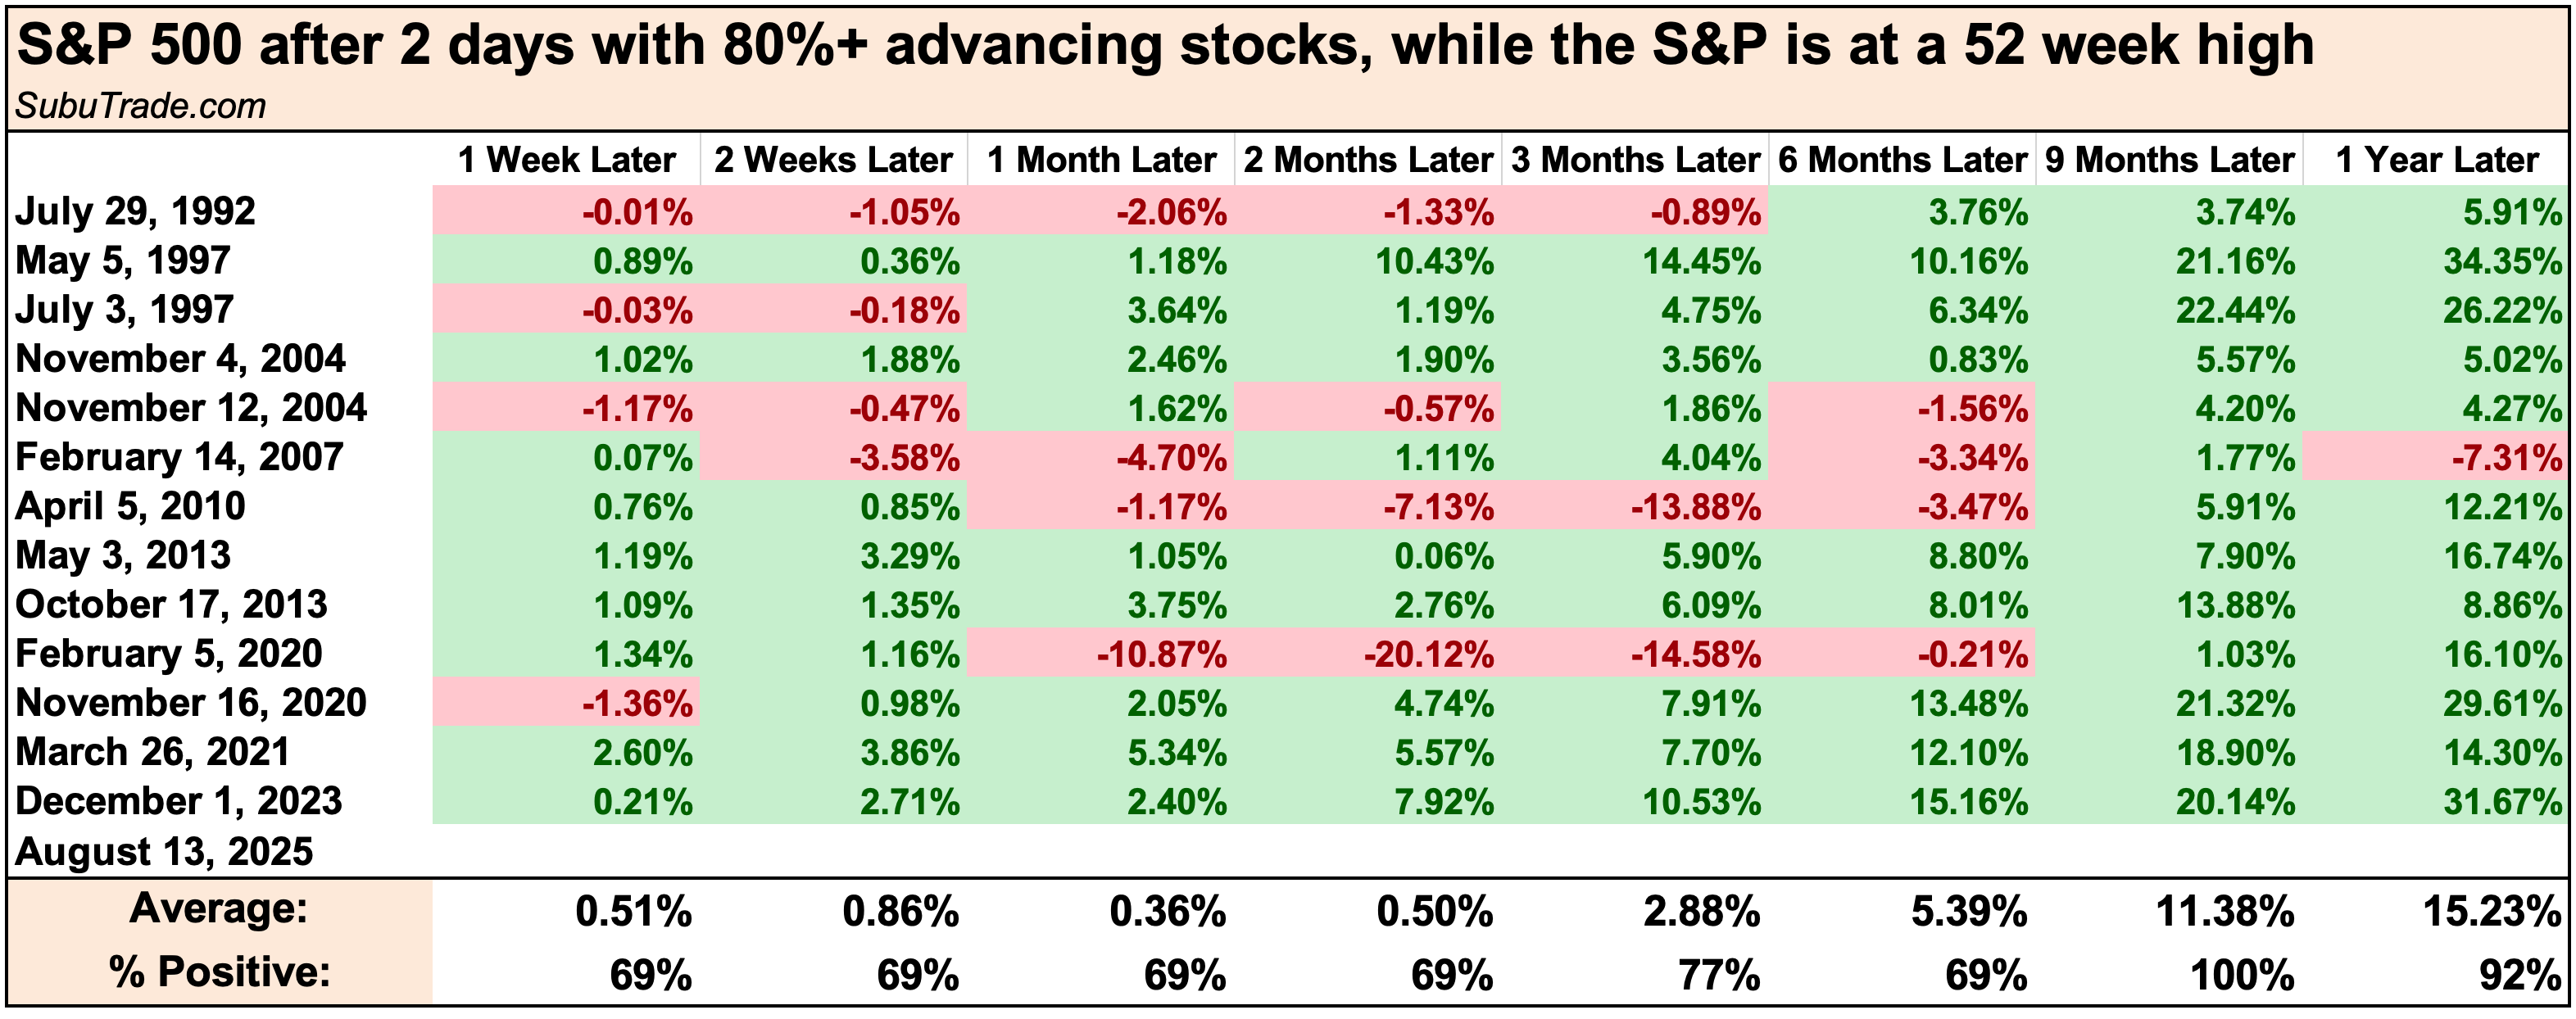
This sign of strength is uncommon when the S&P is making new all-time highs. “Two 80% Up days” are more common after a market crash, when the market surges and recovers. Historically, this was consistently bullish for stocks over the next 9 months:
U.S. Stocks
COT Report (Commitments of Traders)
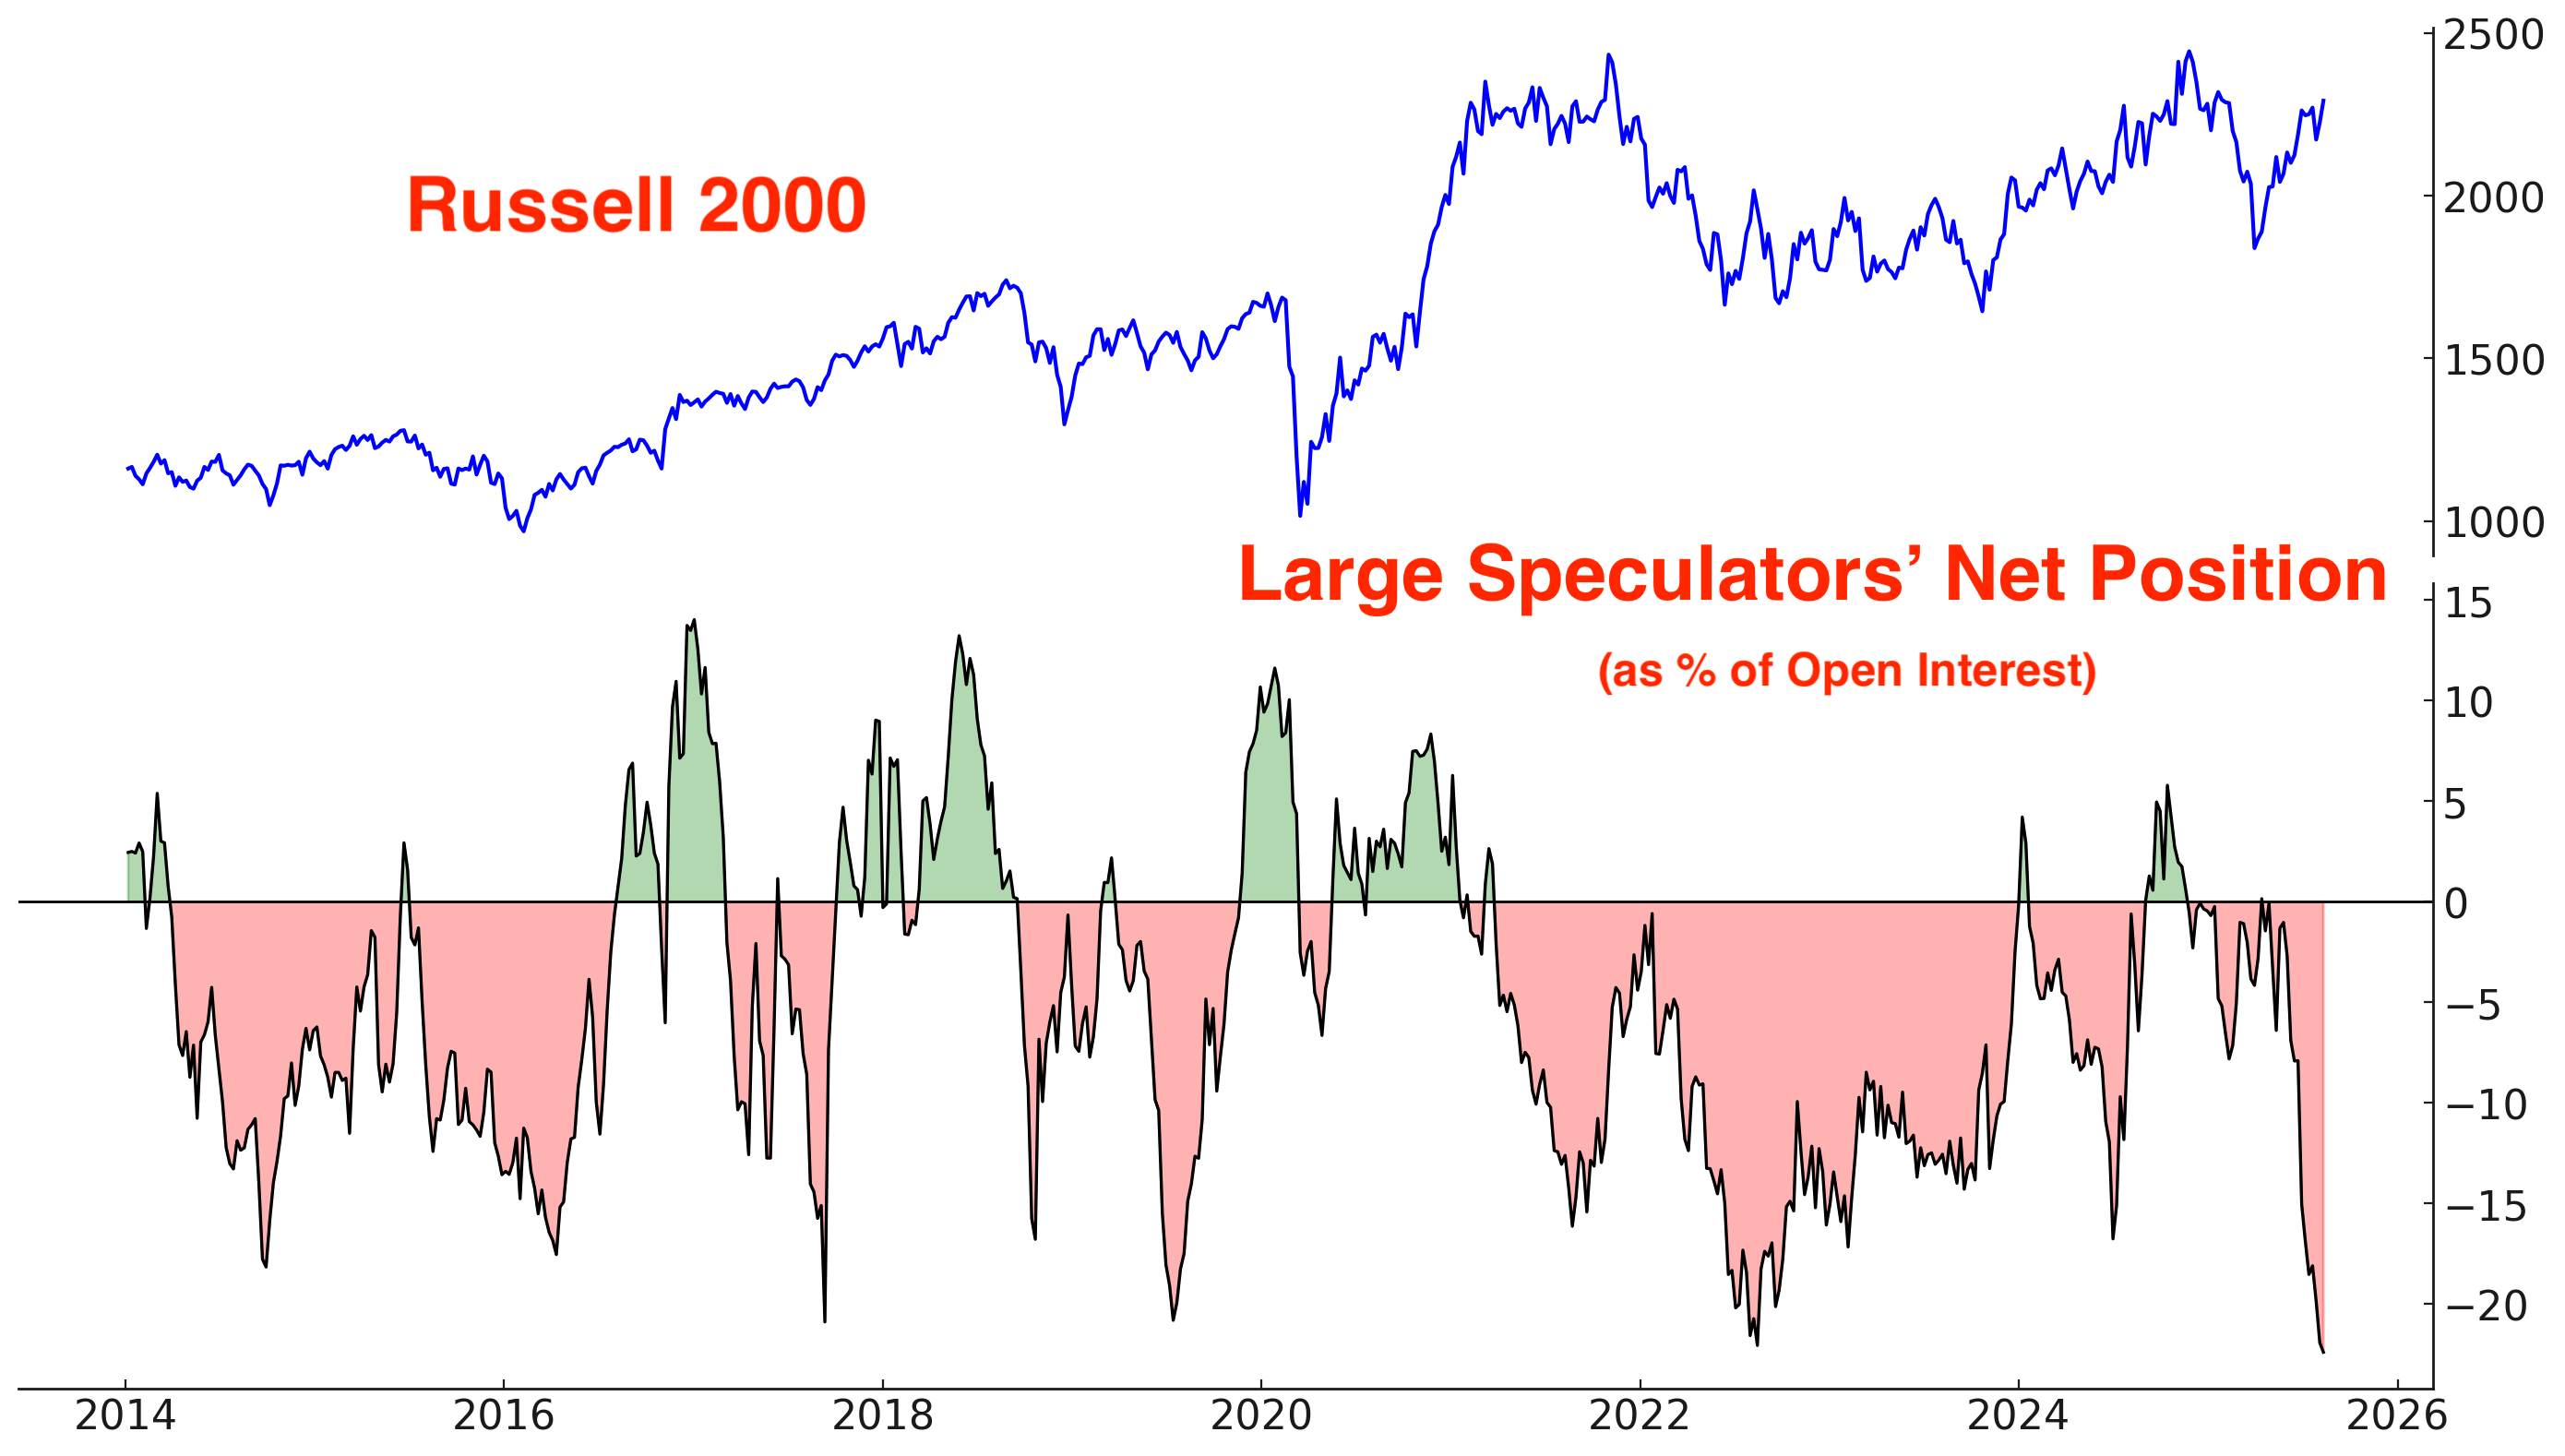
Small caps jumped this week, while Large Speculators/Hedge Funds remain historically short Russell 2000 futures. The jump in smaller stocks on Tuesday and Wednesday helped broaden market breadth:
Sentiment Indicators
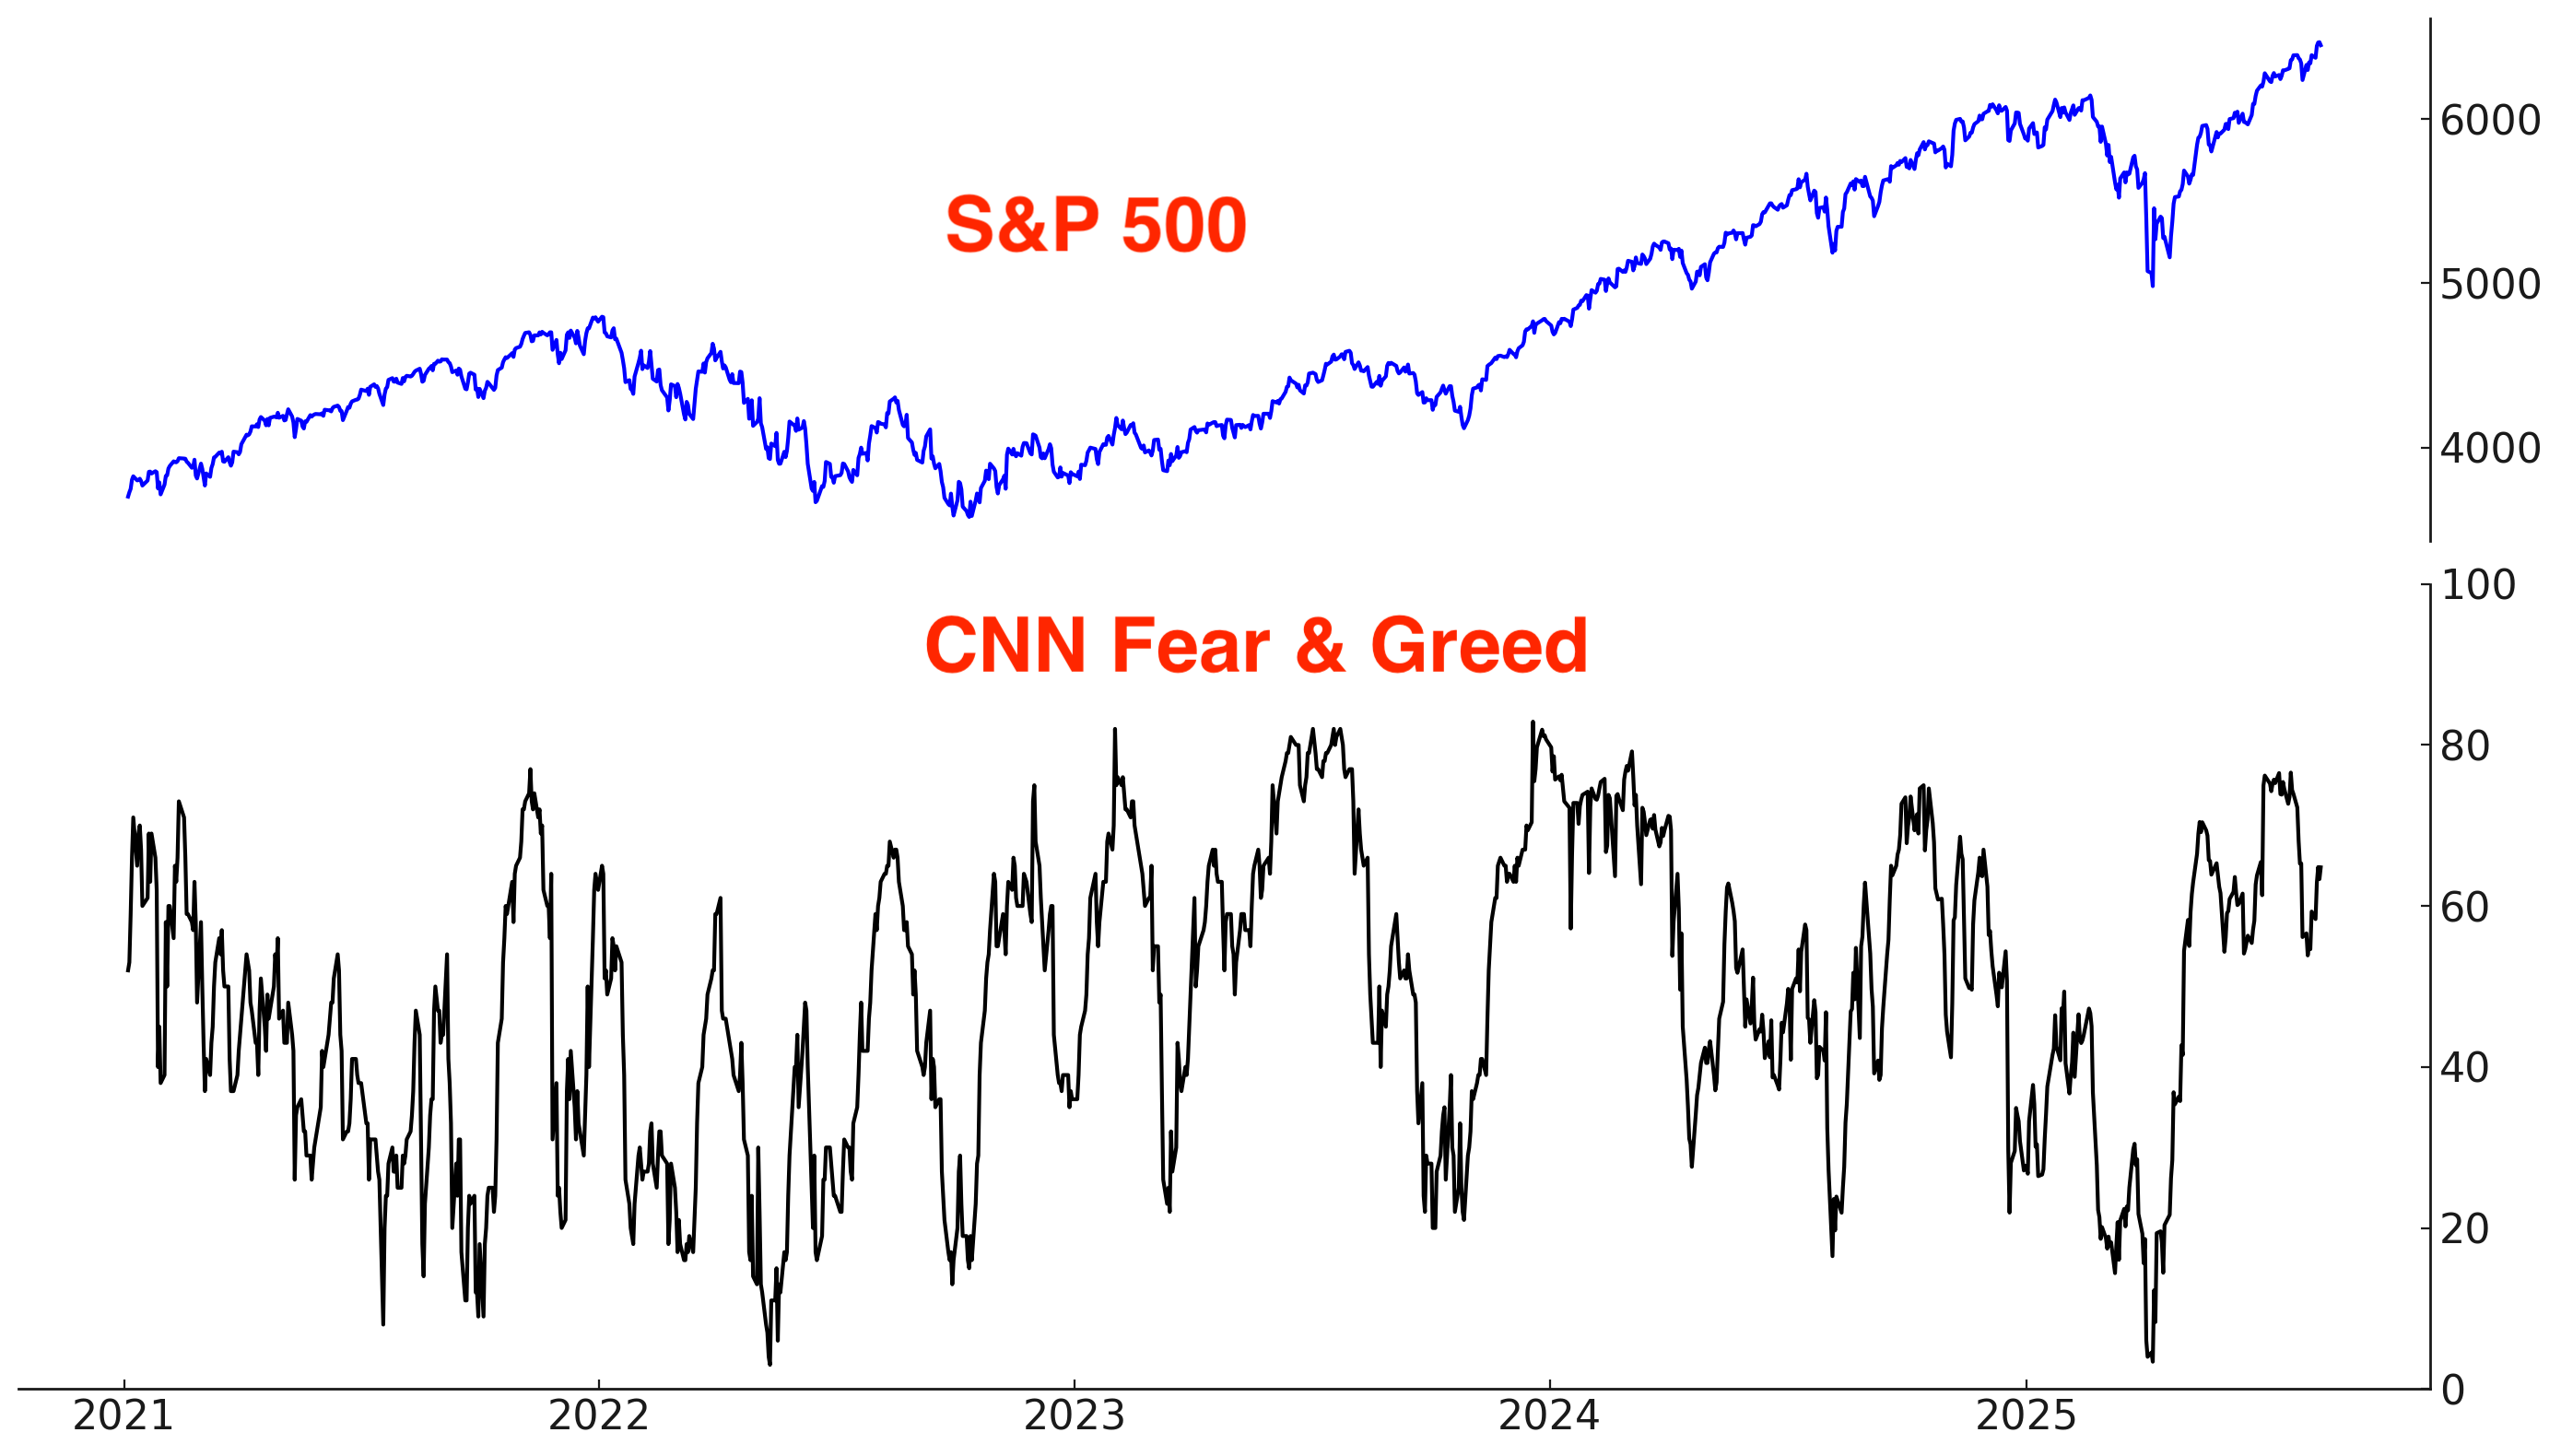
The CNN Fear & Greed Index leans bullish:
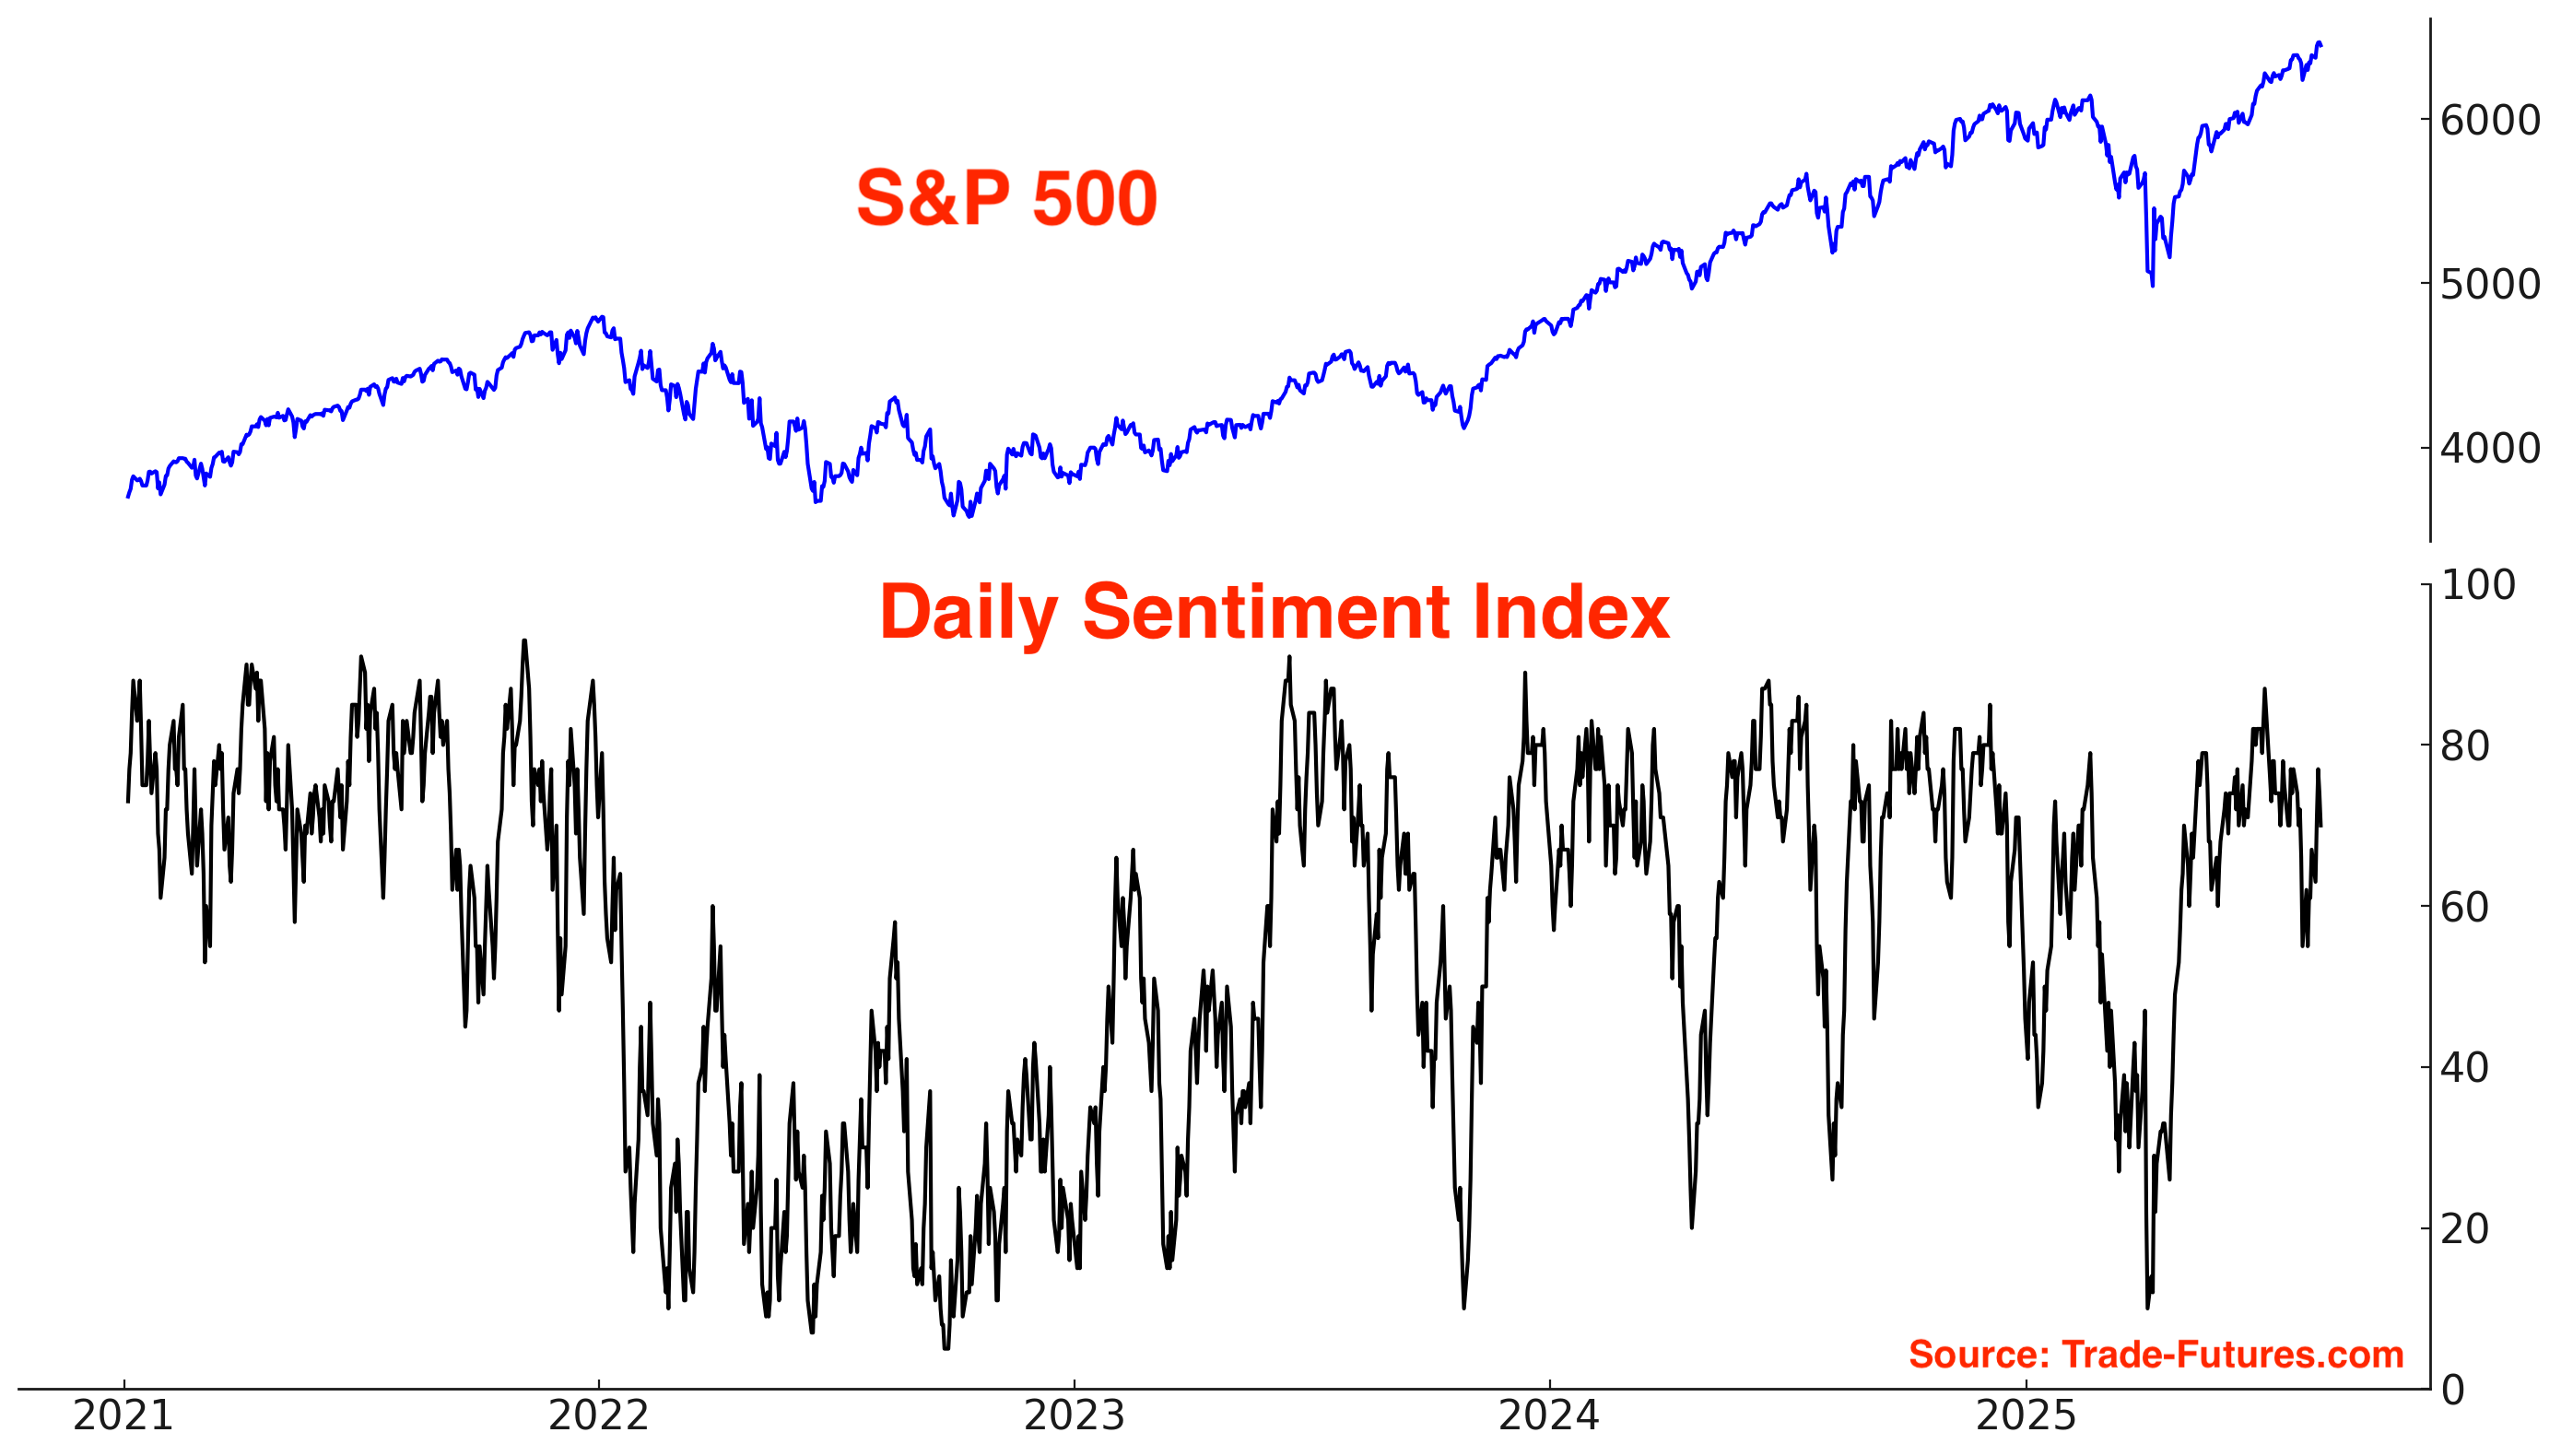
S&P 500’s Daily Sentiment Index leans bullish:
Sentiment Surveys
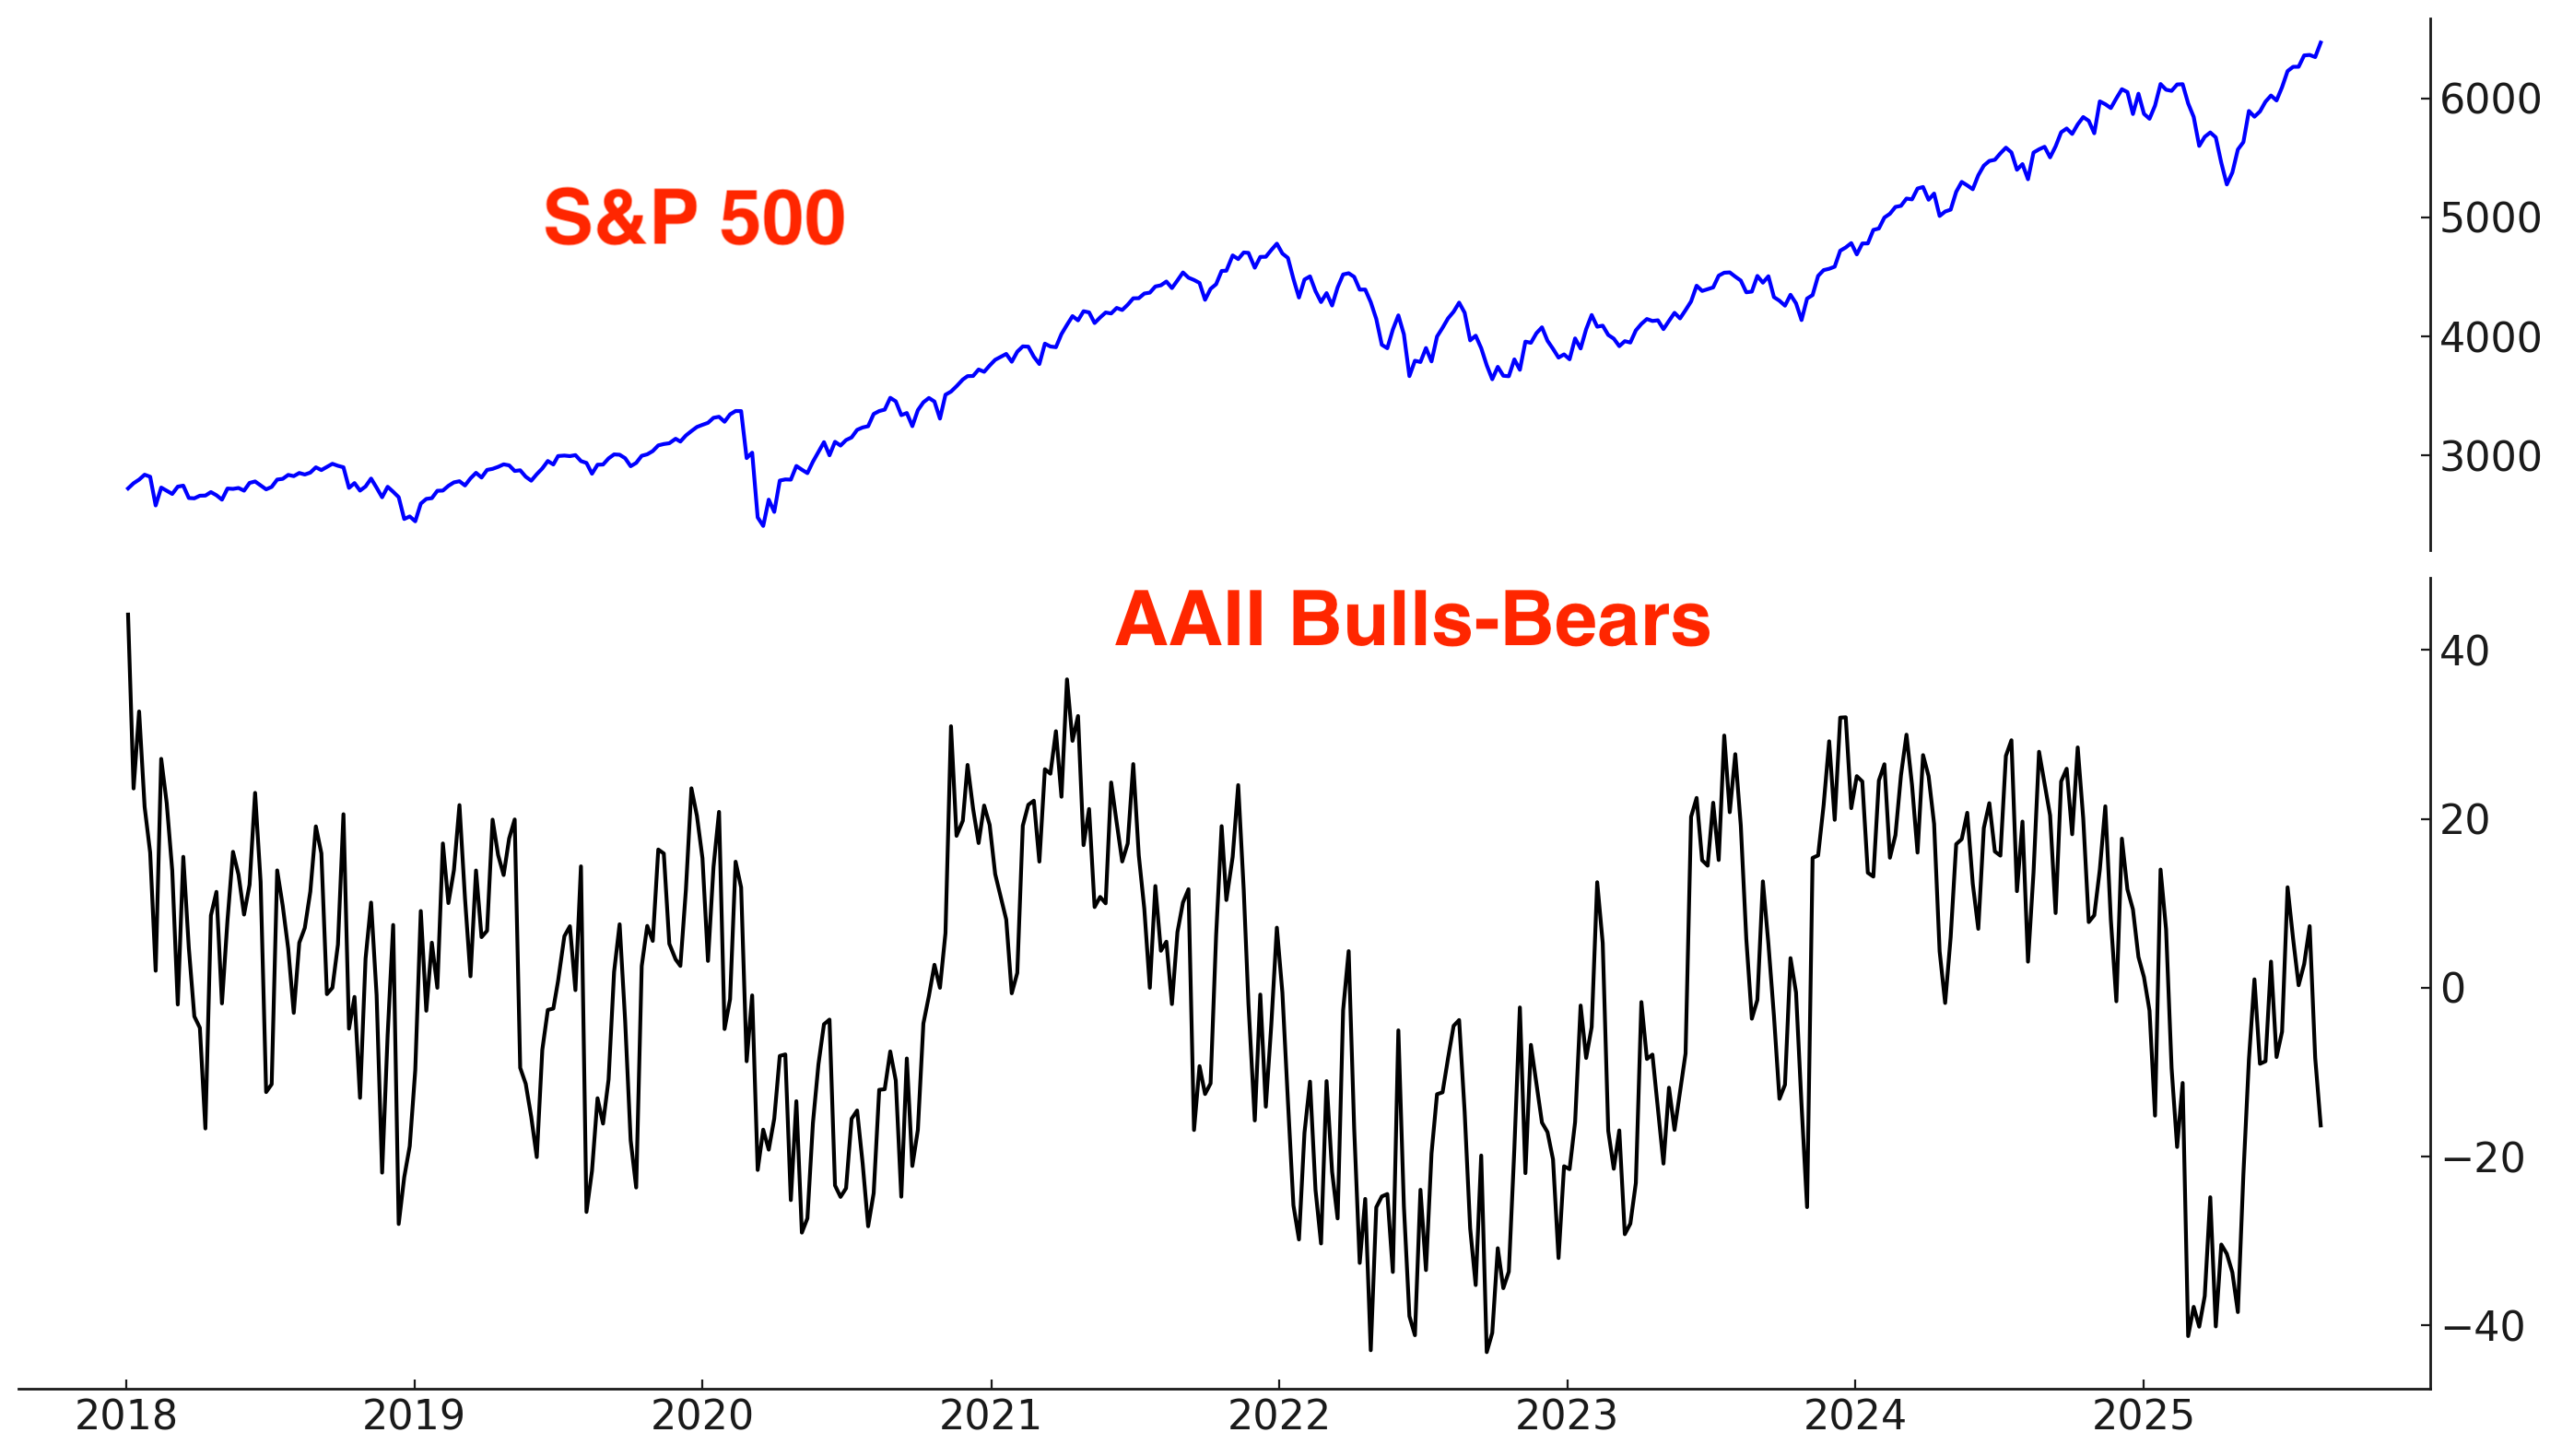
Sentiment according to the AAII survey fell. This is surprising considering the stock market’s non-stop rally.
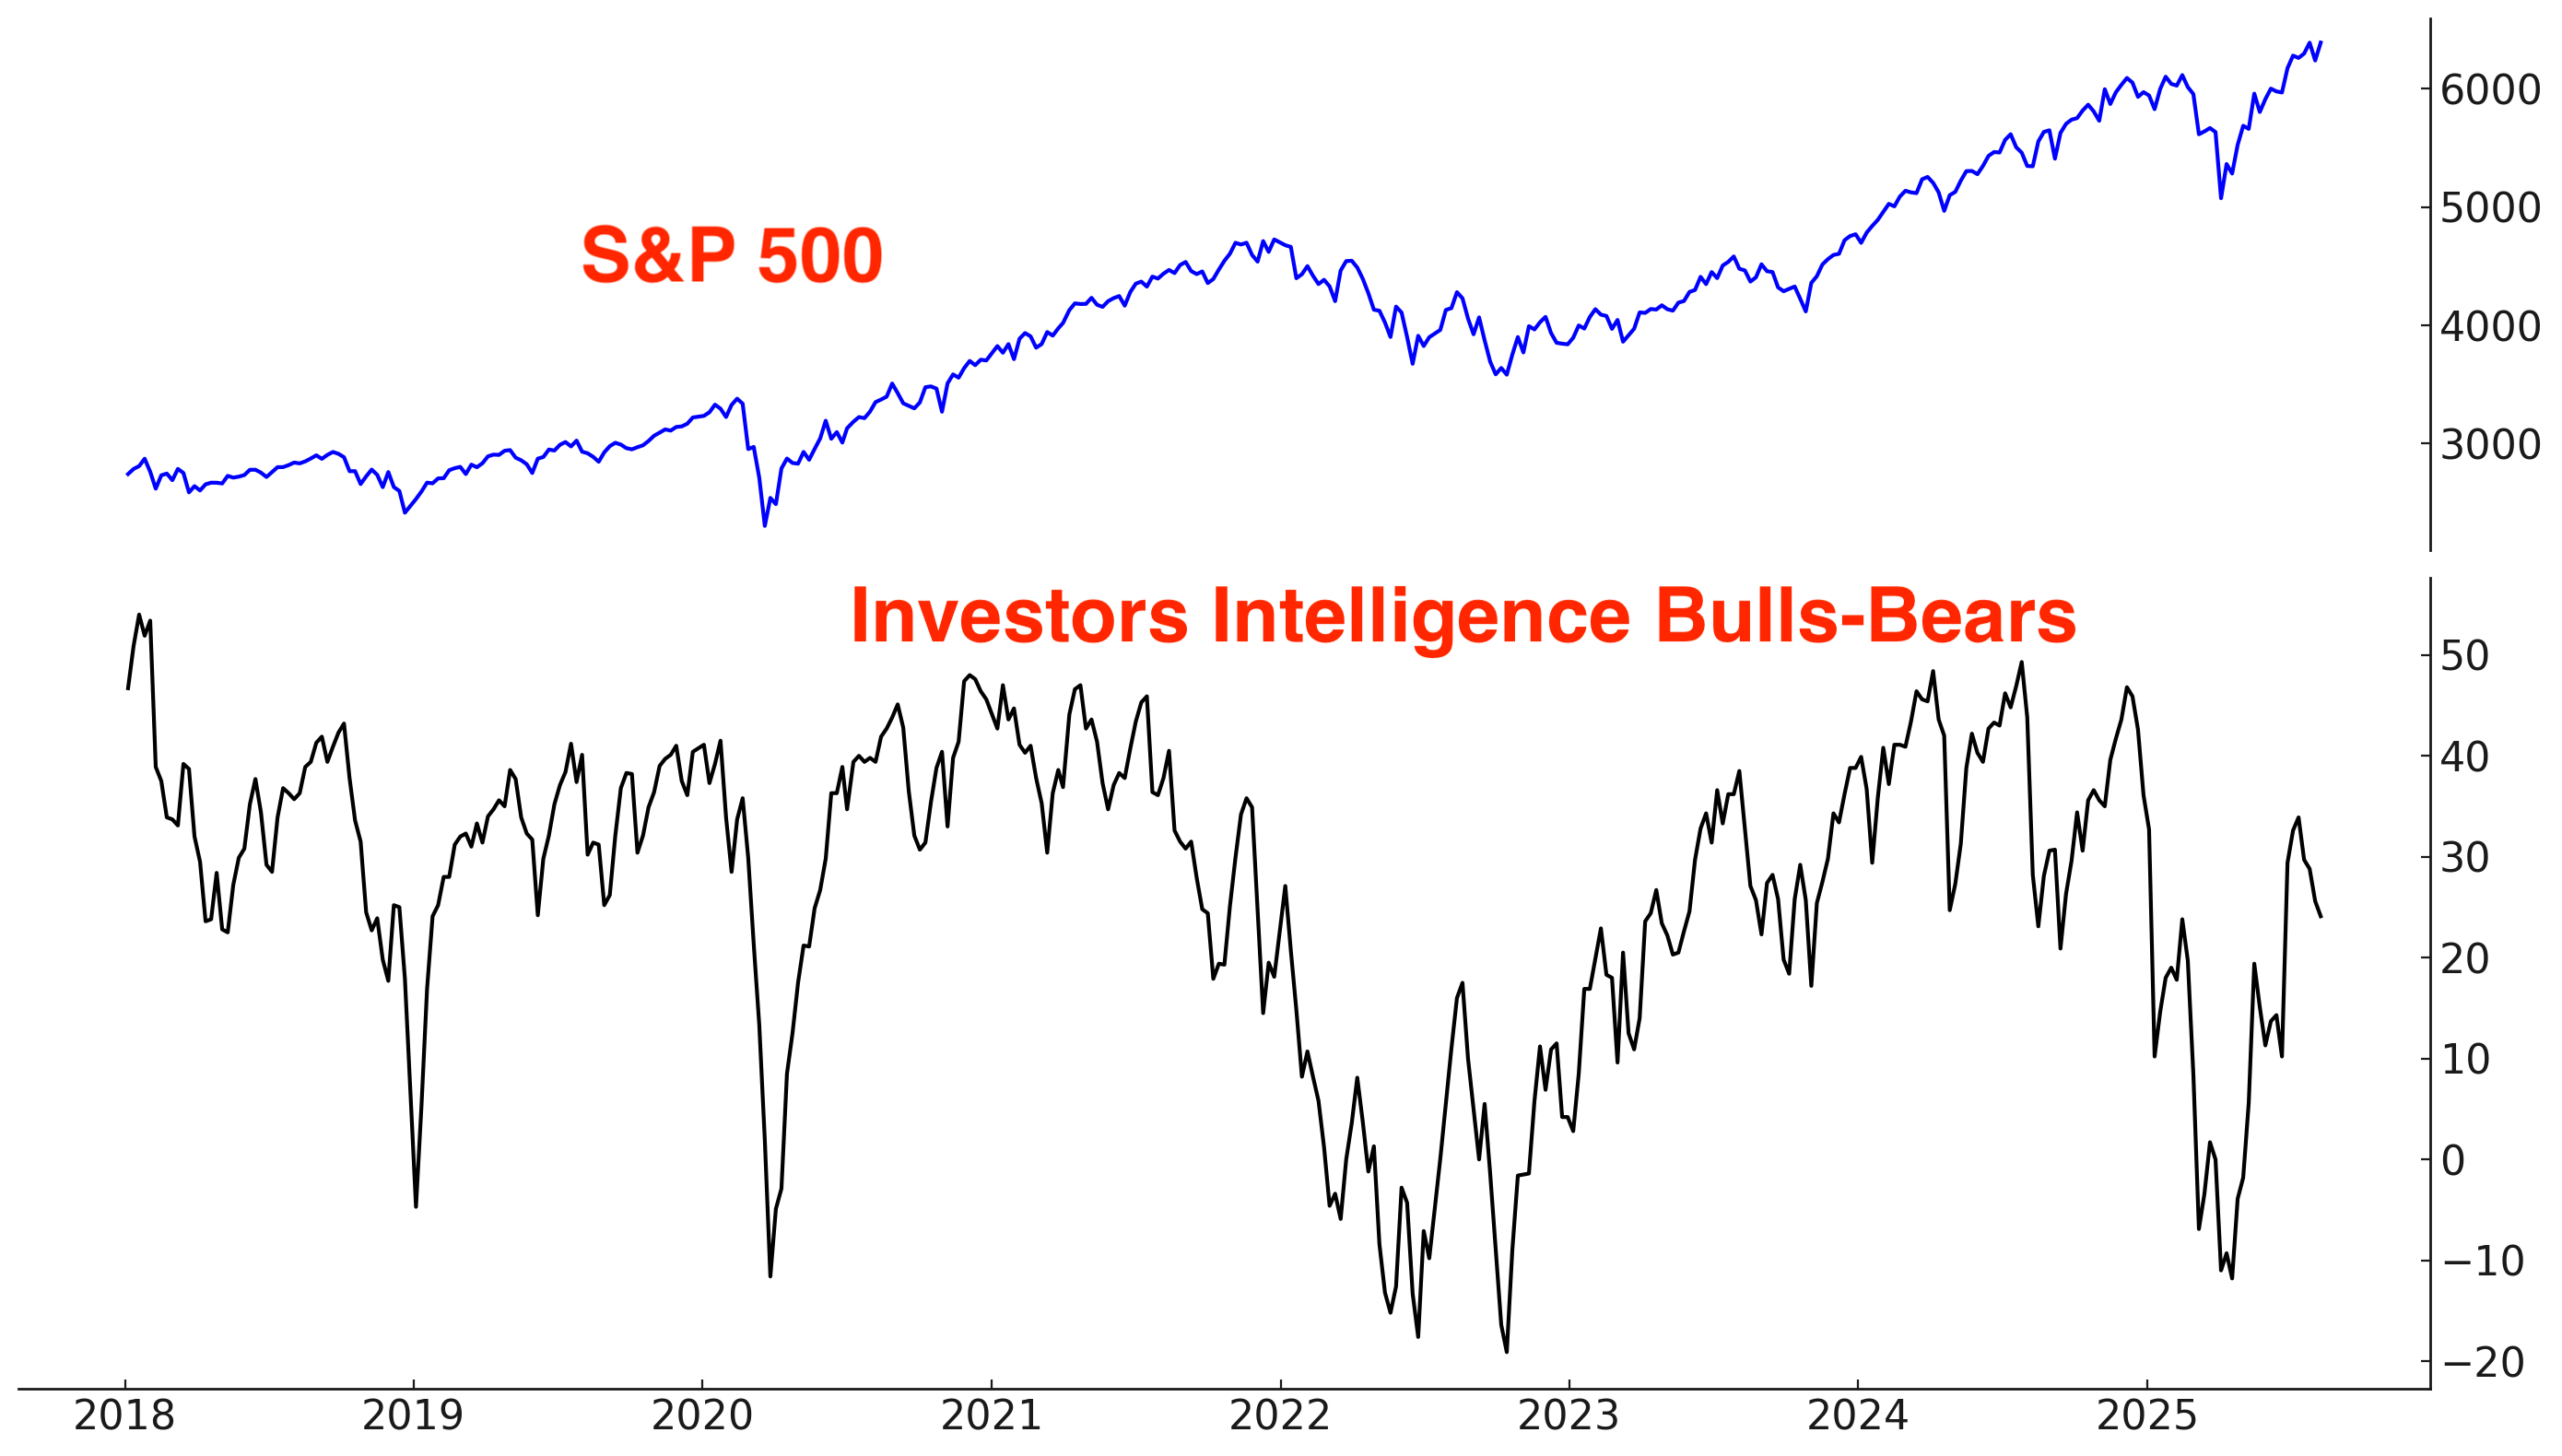
Investors Intelligence Bulls-Bears fell a little. Newsletter writers lean slightly bullish:
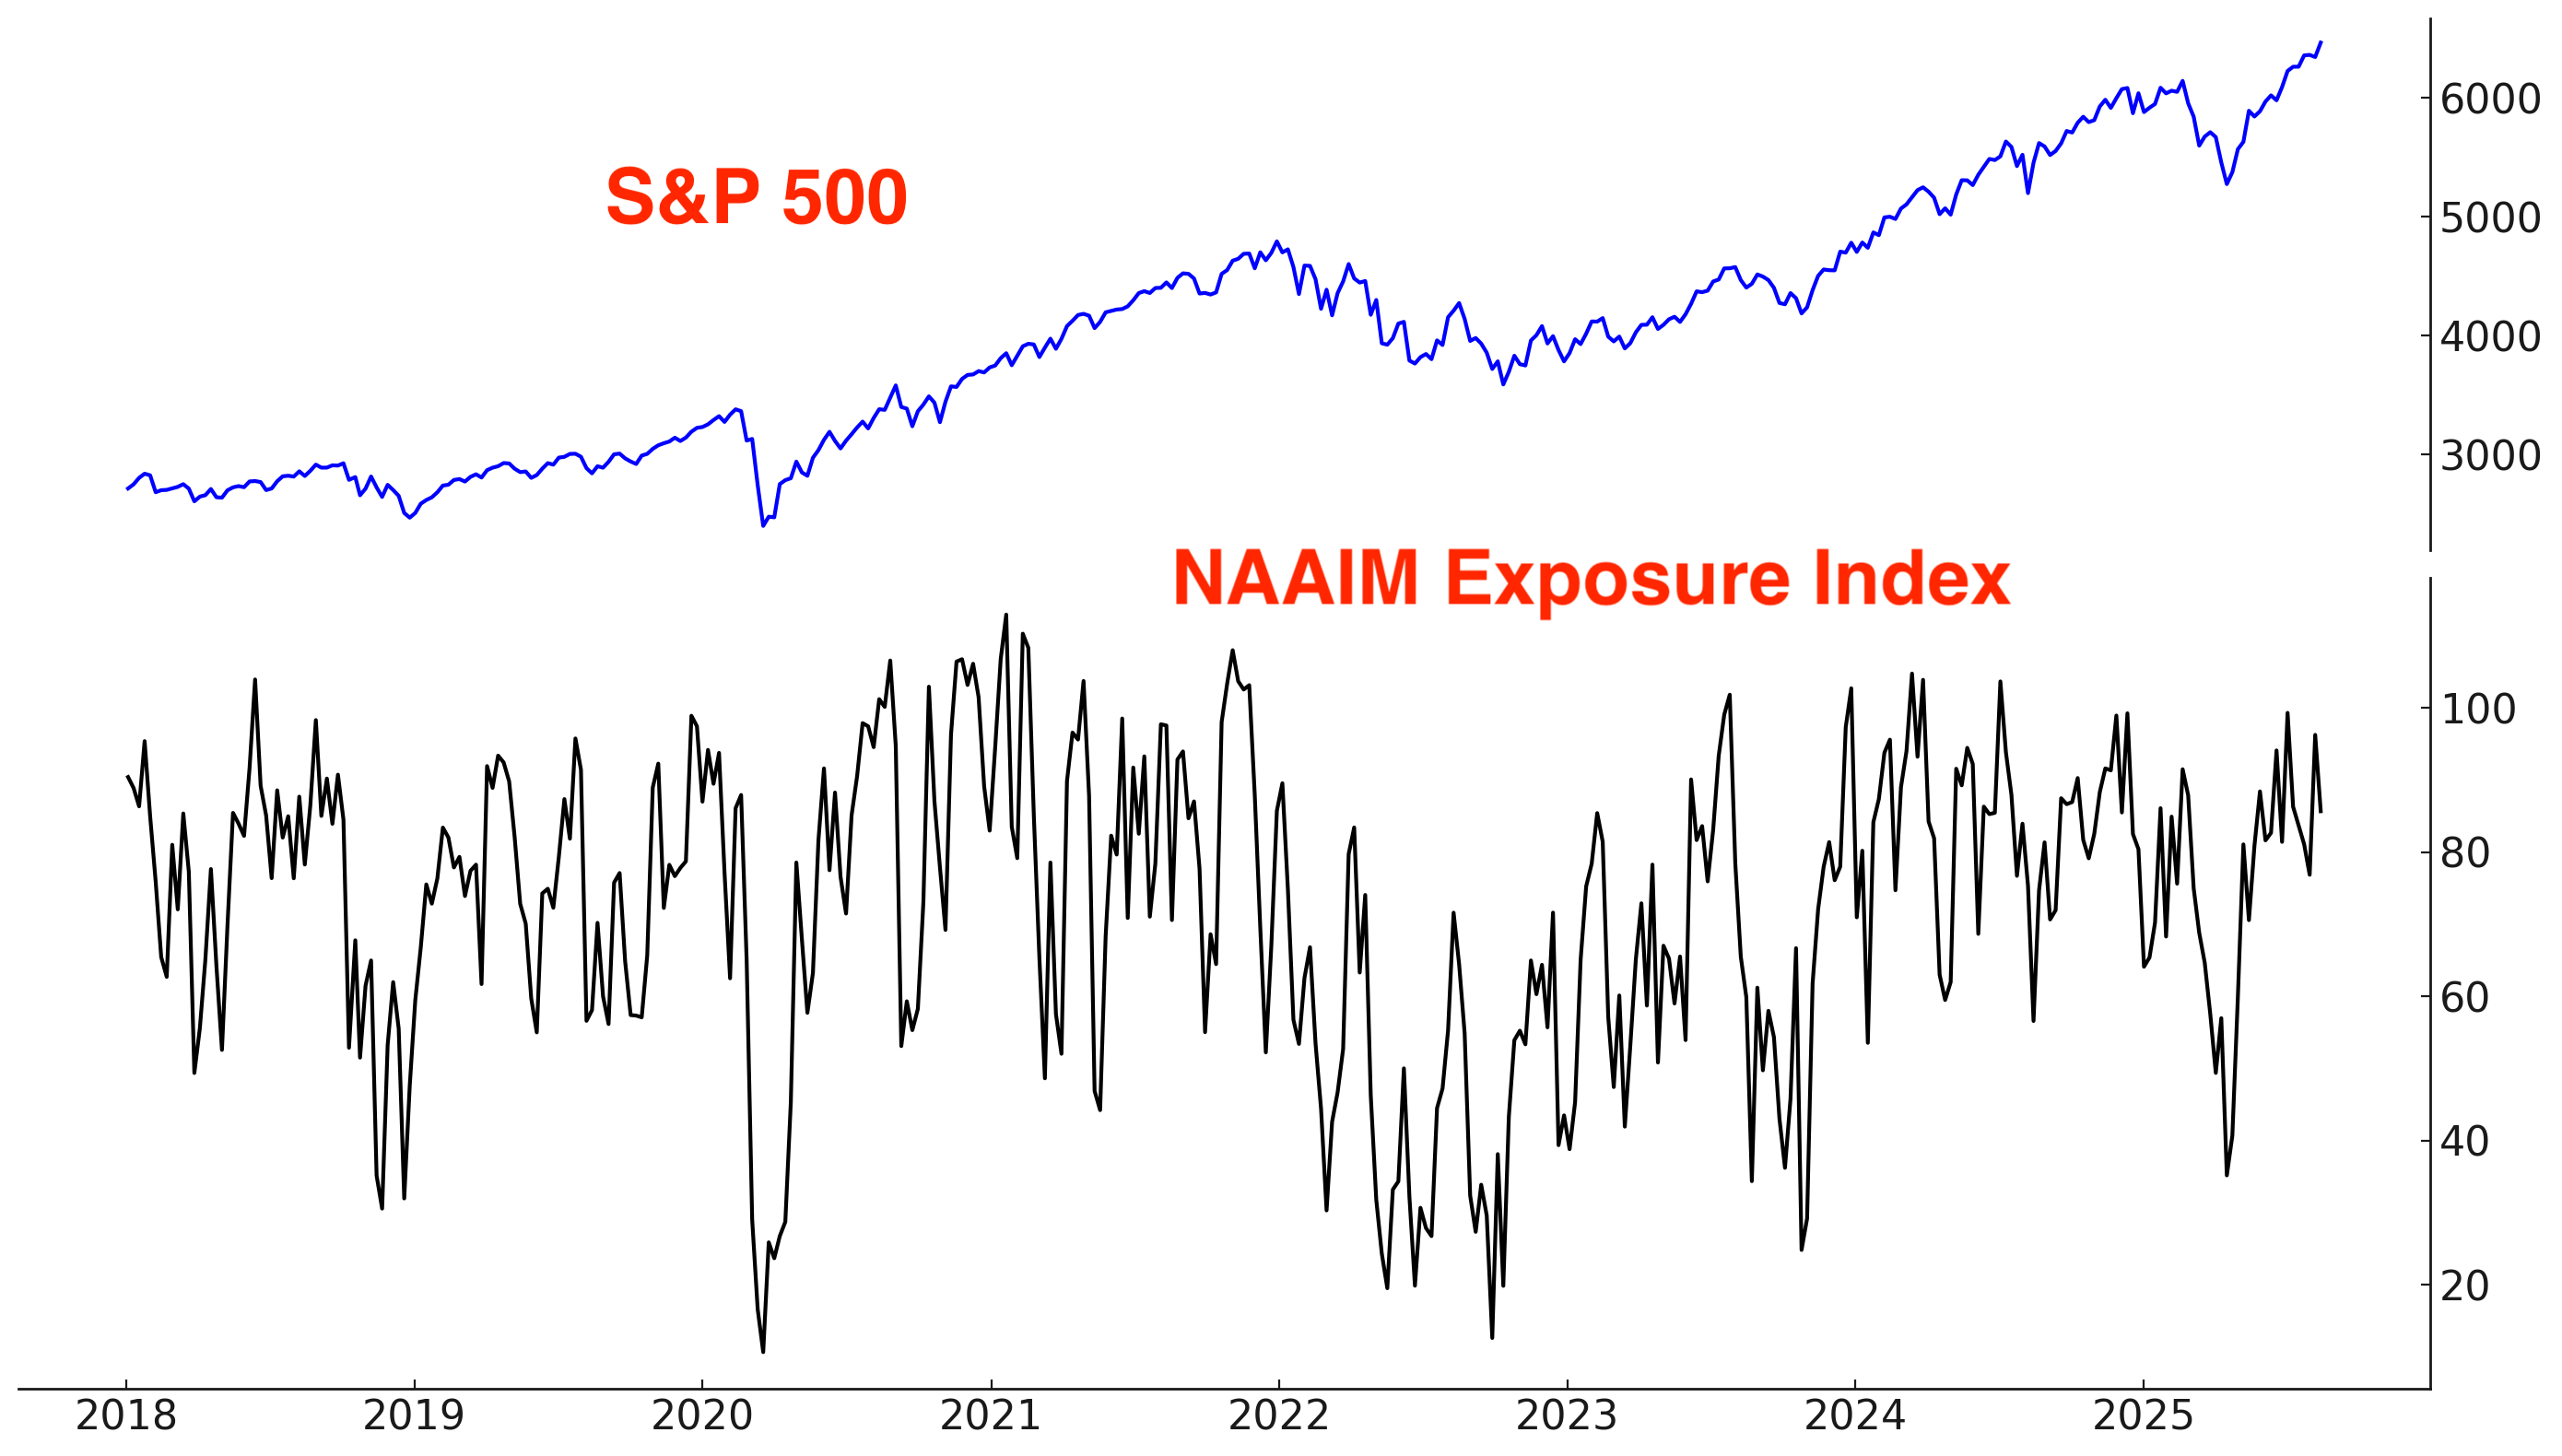
According to the NAAIM Exposure Index, active investment managers lean bullish:
Corporate Insiders
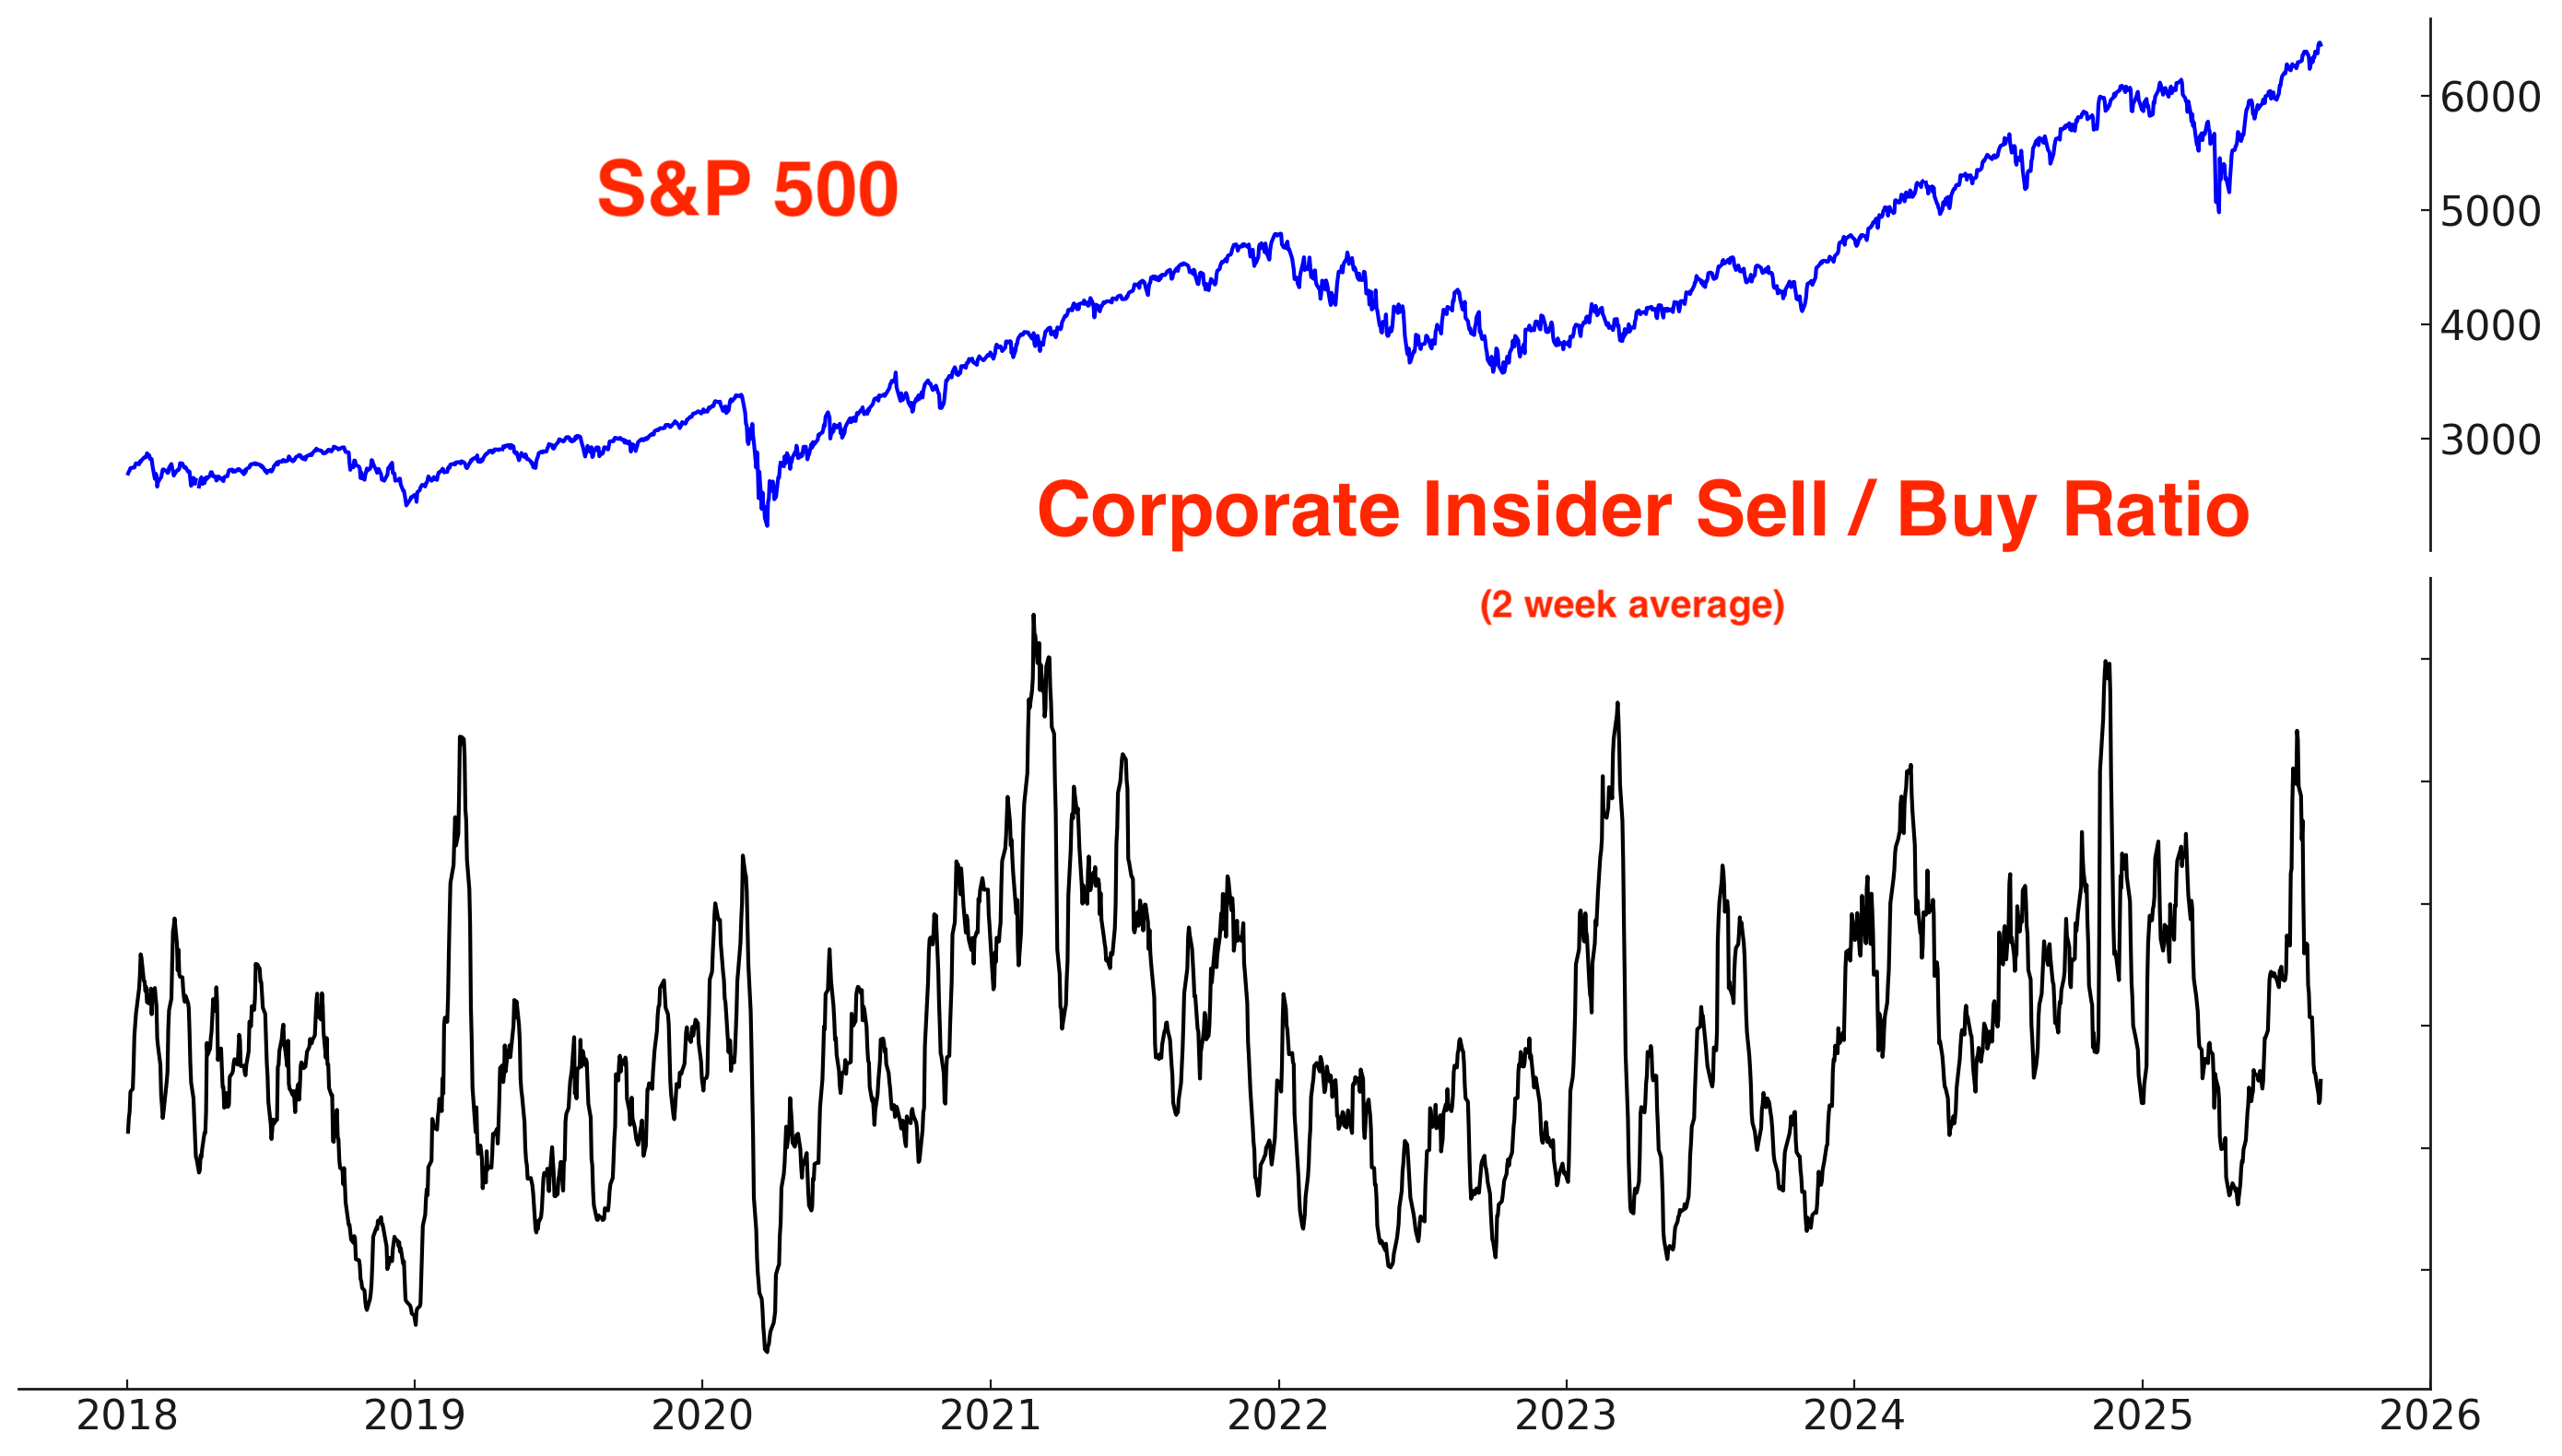
The Corporate Insider Sell/Buy ratio is in neutral territory - neither bullish nor bearish.
Options
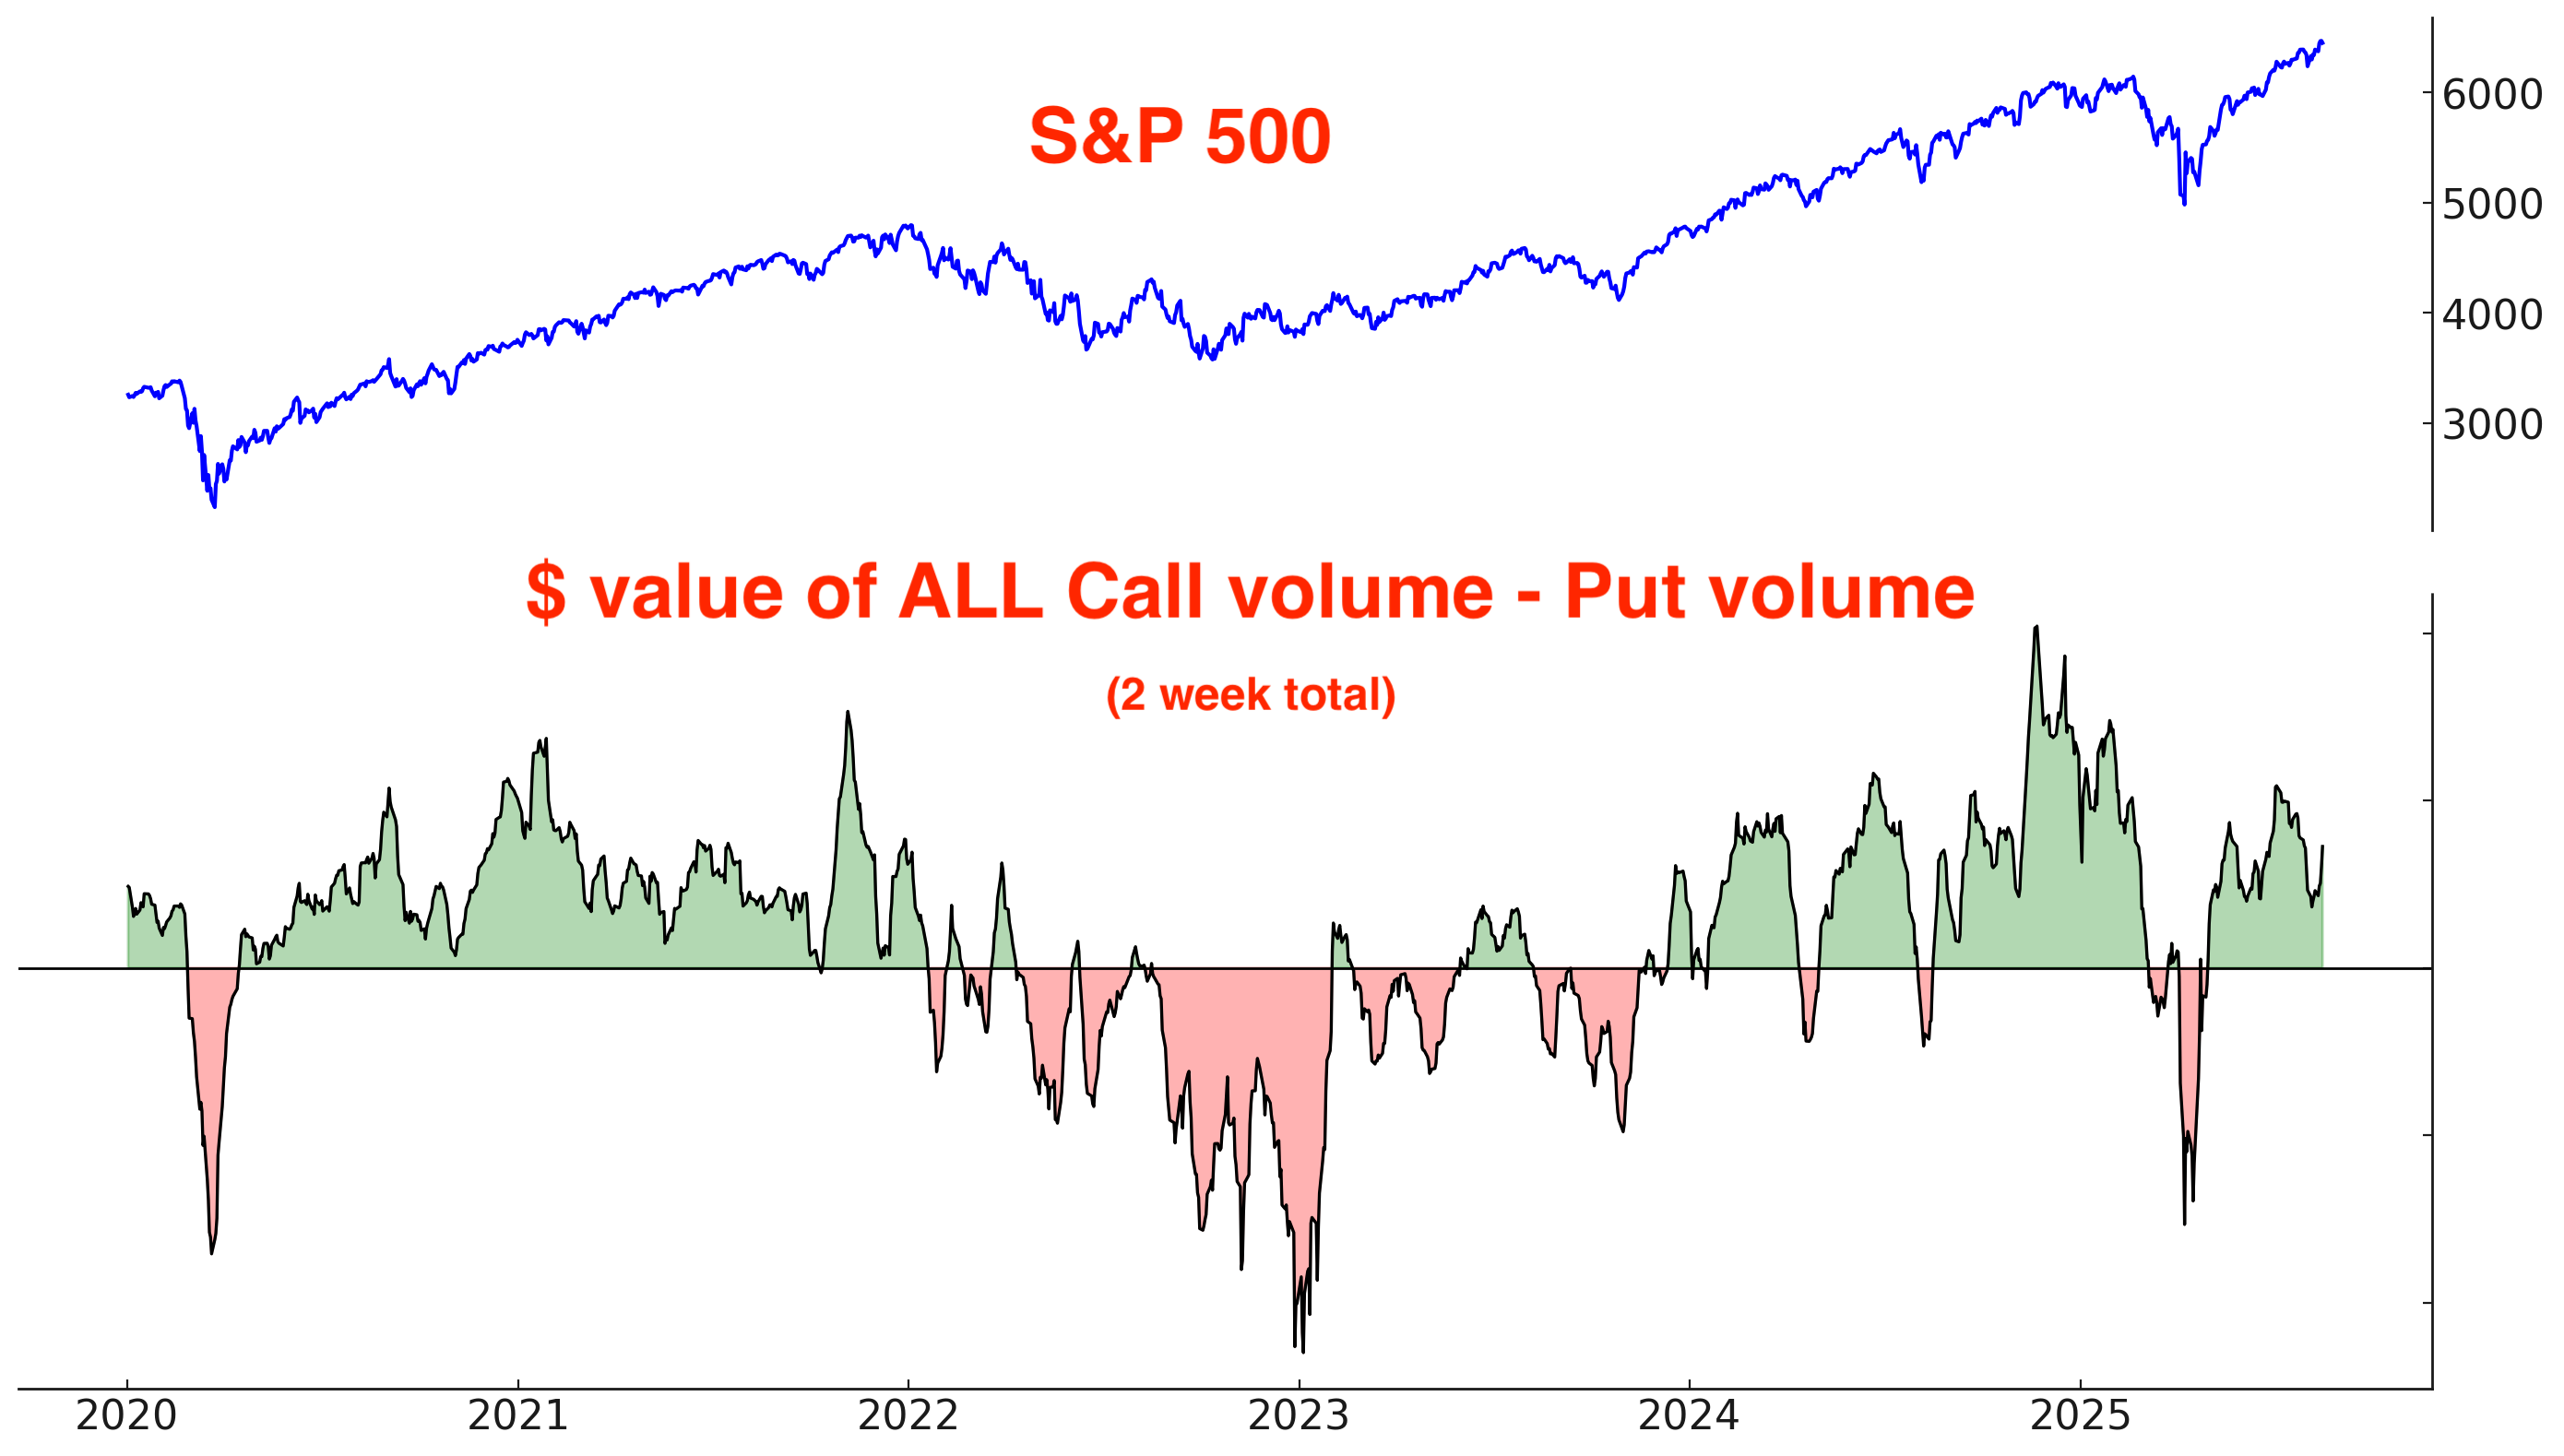
The $ value of all Call volume - the $ value of all Put volume is elevated:
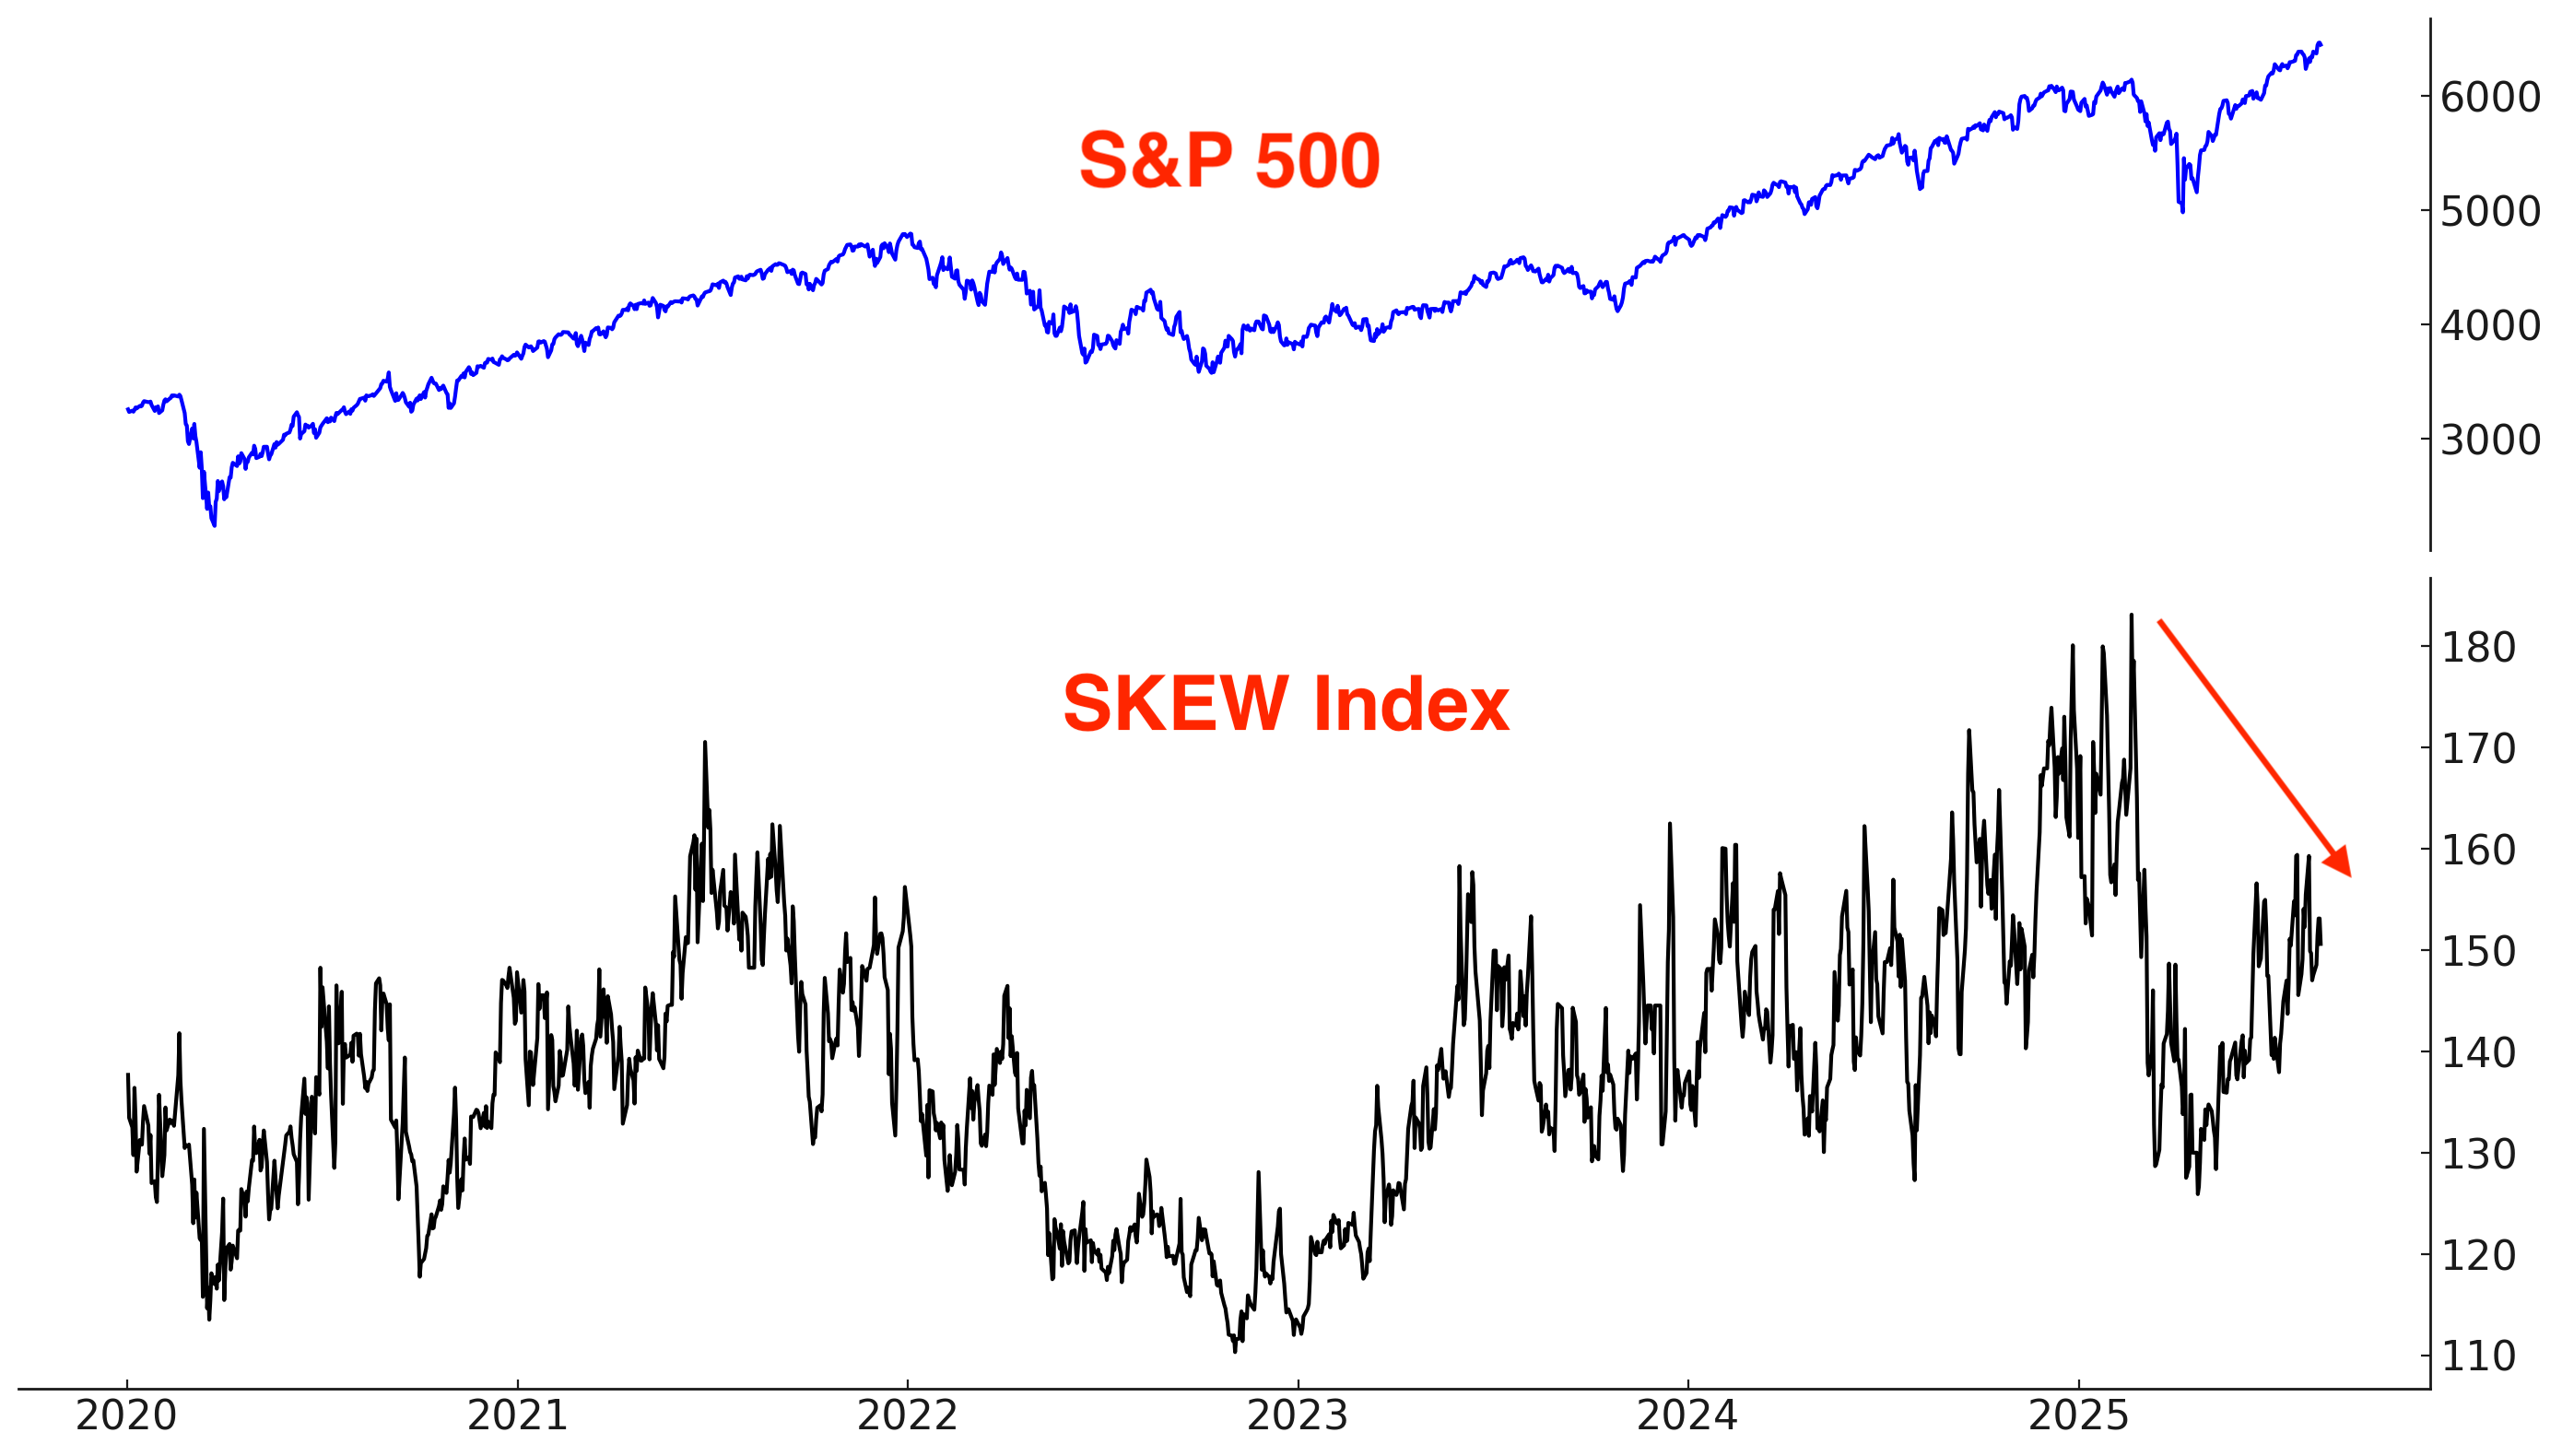
The SKEW Index, which reflects perceived tail risk in the options market — or the probability of extreme downside moves — remains muted. This suggests that any stock market pullback will not turn into a major crash.
Fund Flows
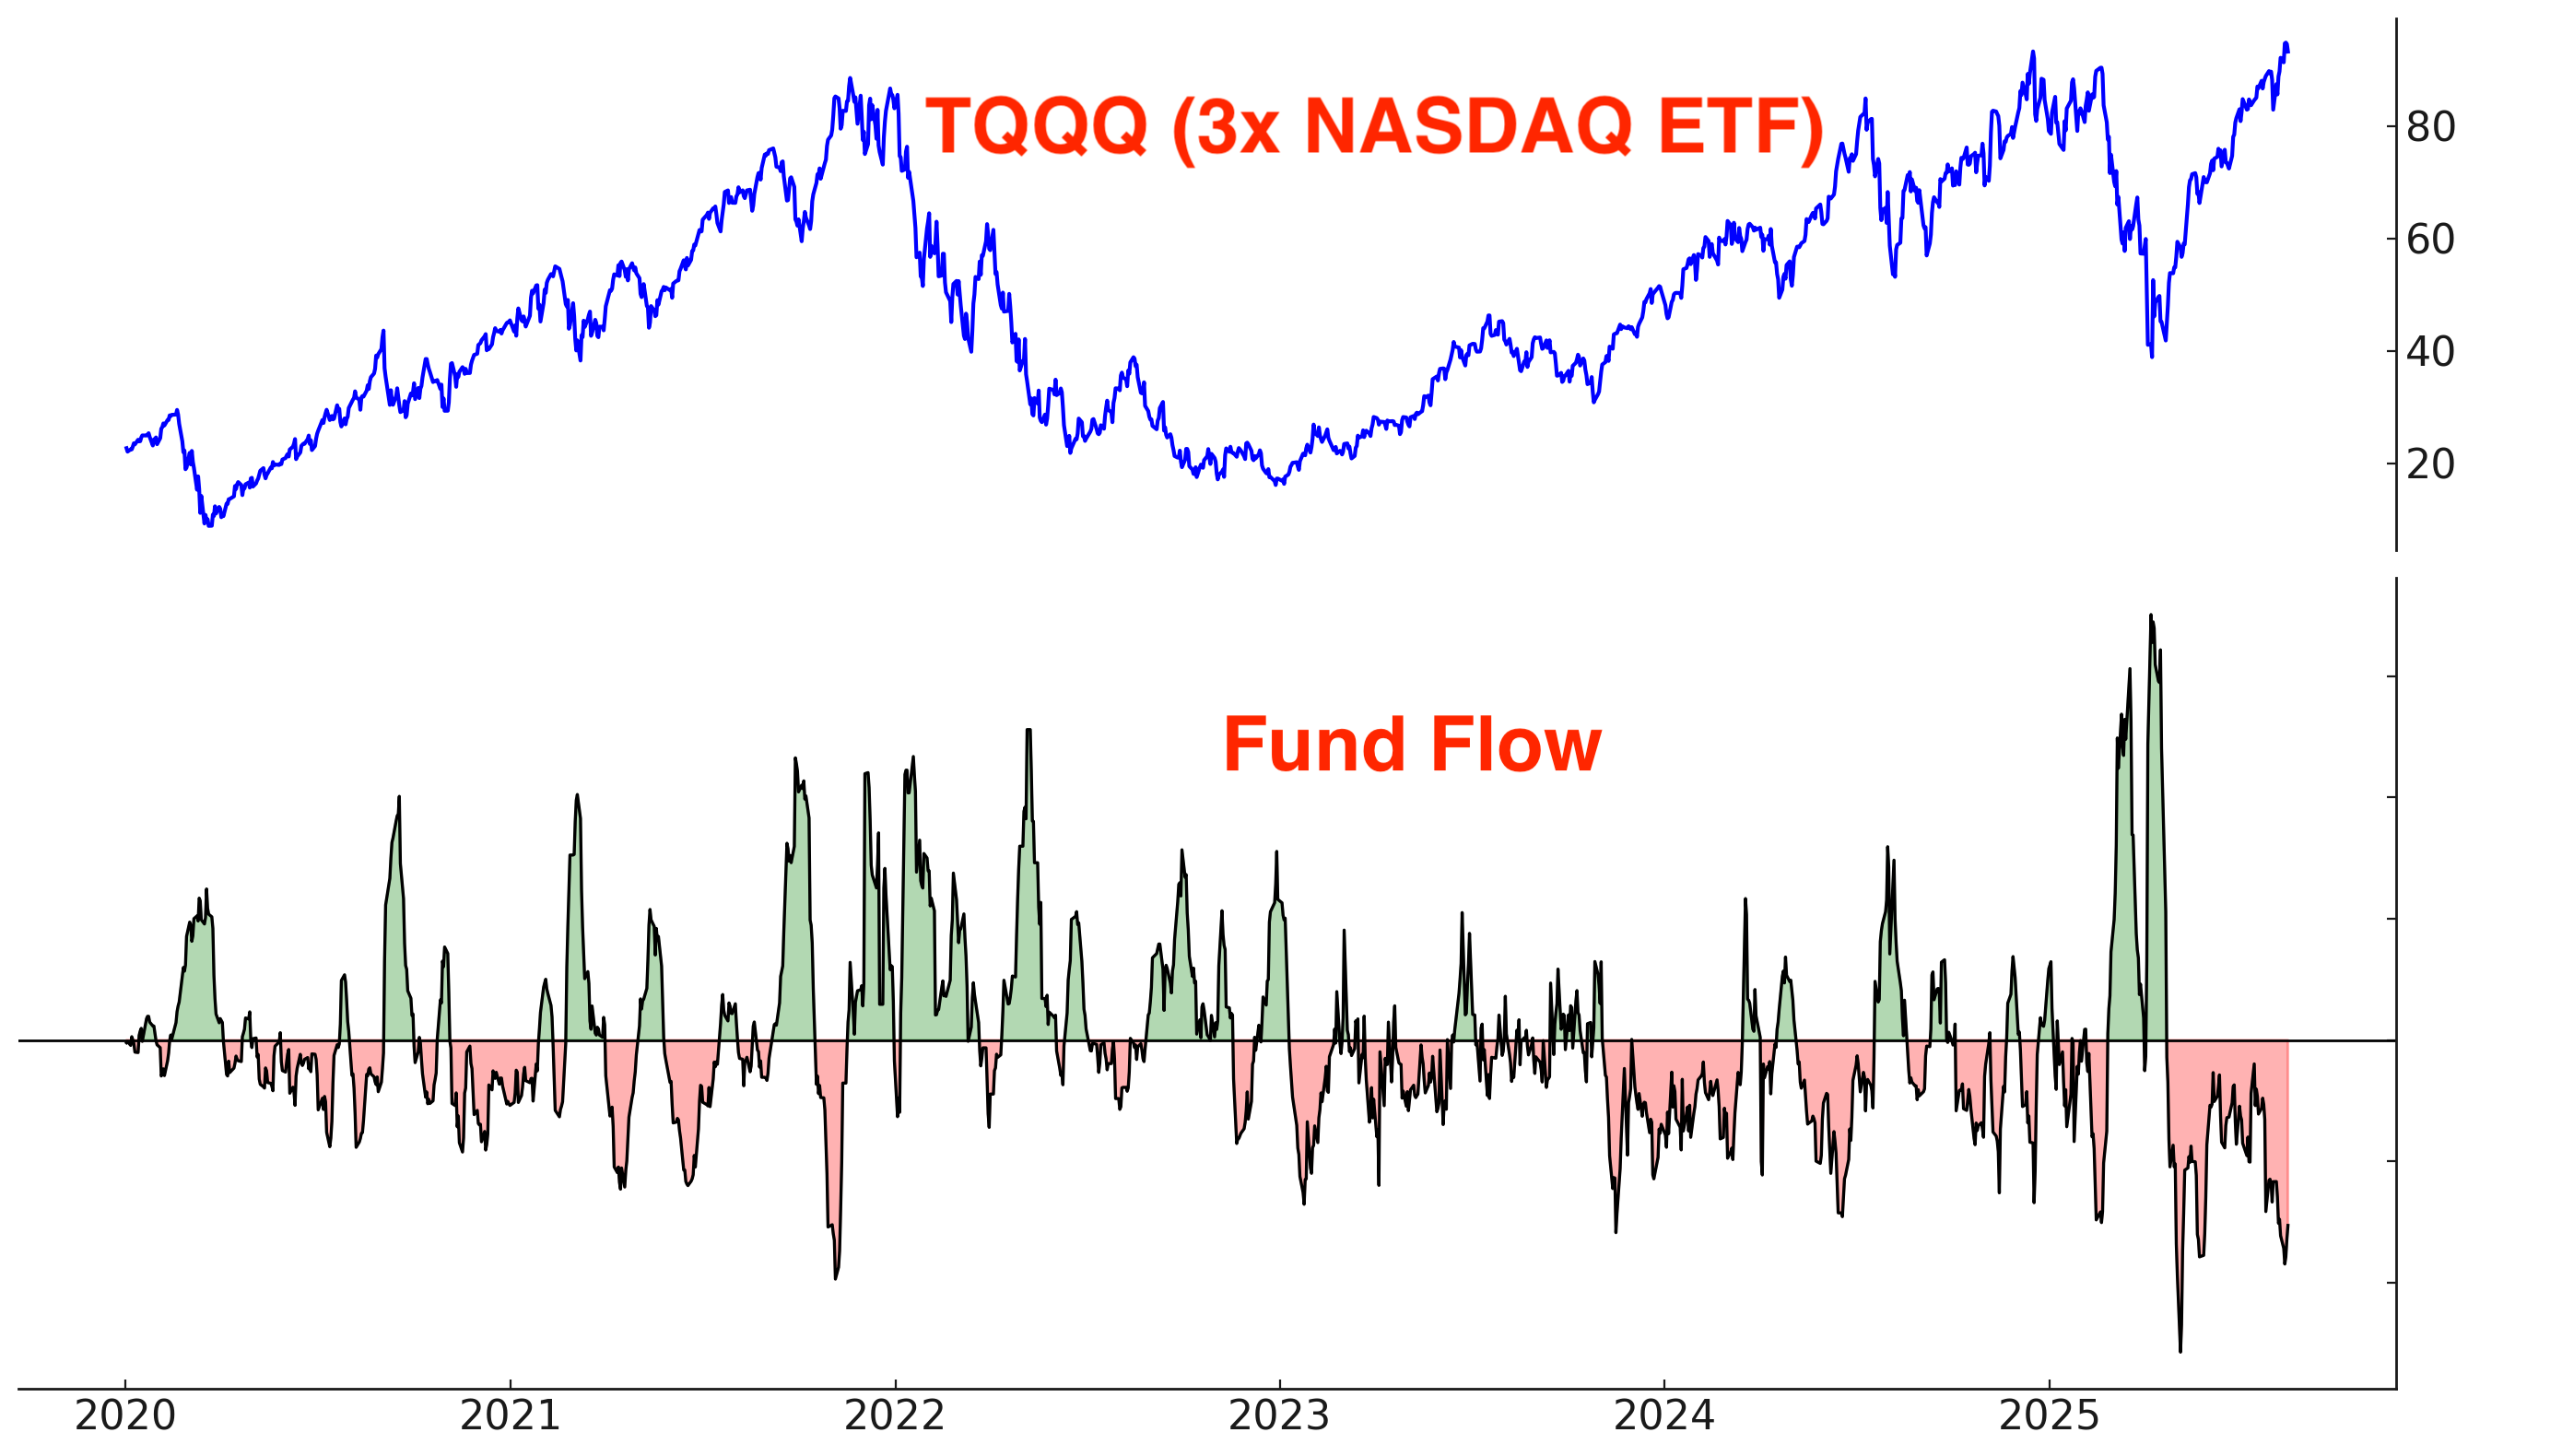
*Fund flows aren’t automatically contrarian. It depends on what type of trader is buying/selling and why. Some ETFs are traded by mean-reversion traders, while other ETFs are traded by trend followers. Moreover, many ETFs are small relative to the underlying market, so fund flows don’t always reflect broad sentiment towards that market.
TQQQ is traded by mean-reversion traders who buy the dip when TQQQ falls and sell (take profits) when TQQQ rallies.
TQQQ is still seeing outflows. Endless profit-taking:
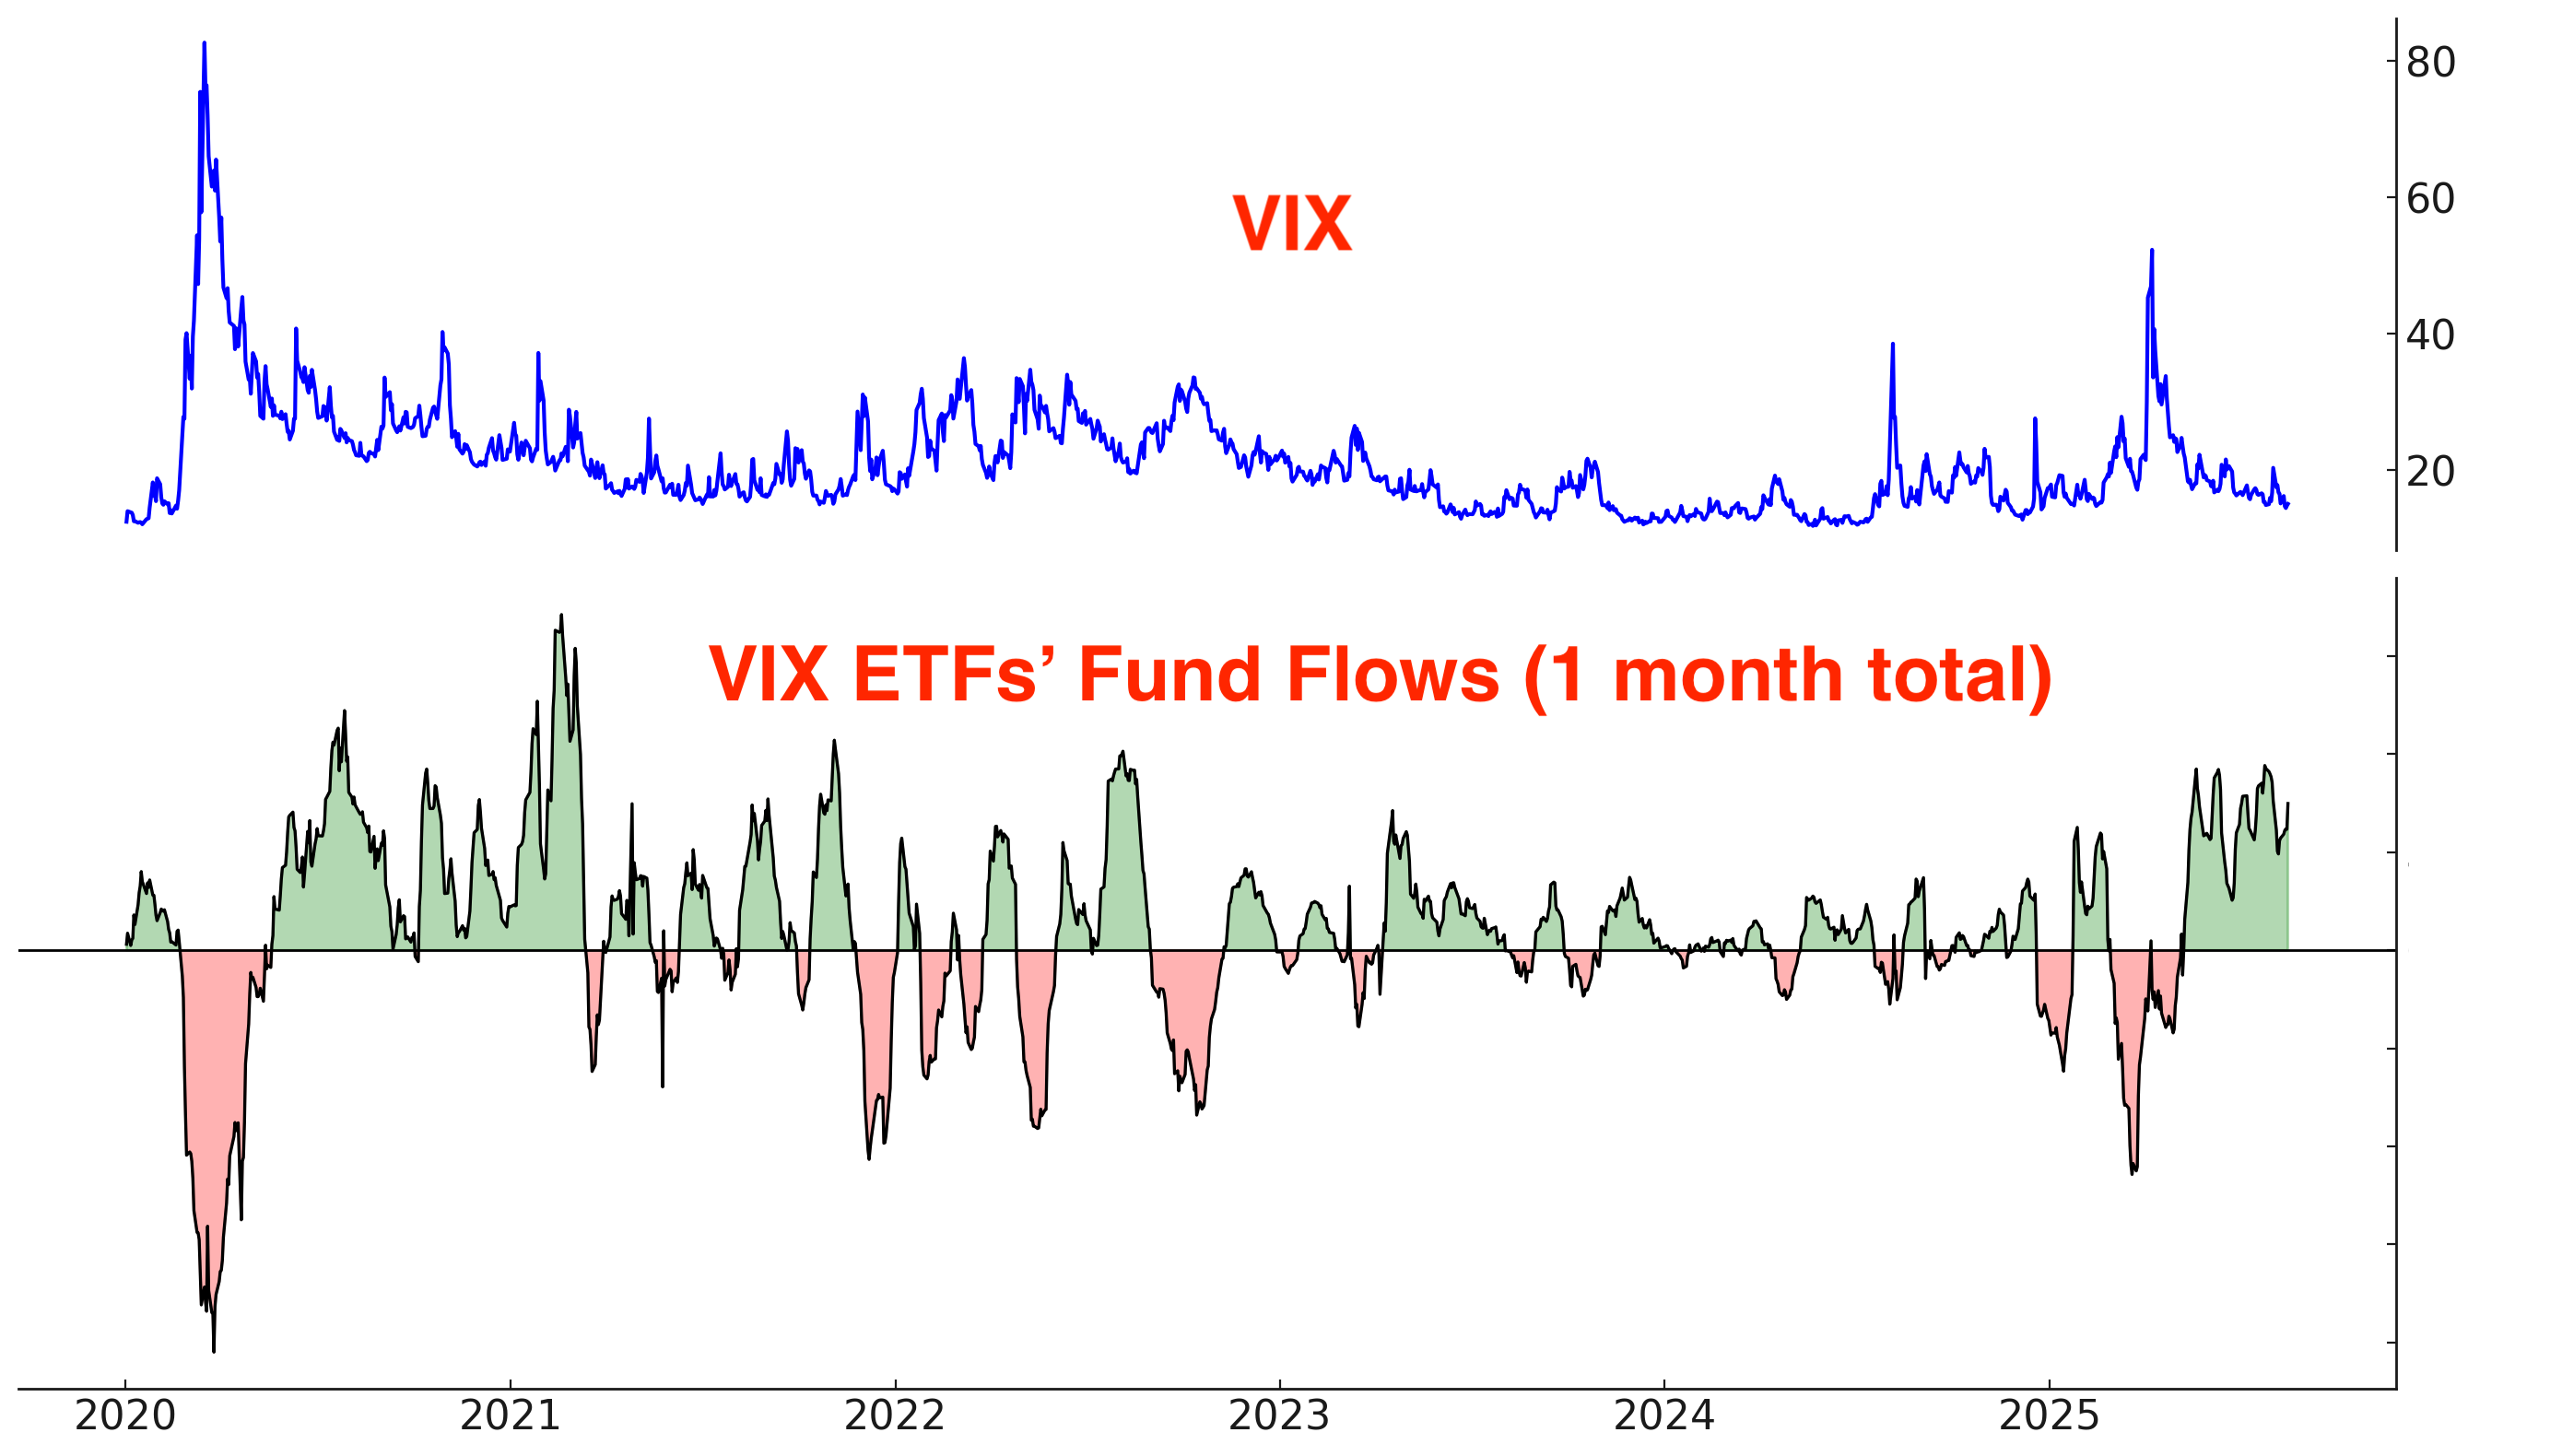
VIX ETFs are also traded by mean-reversion traders; they buy when VIX is low and sell (take profits) when VIX is high.
VIX ETFs have seen non-stop inflows over the past few months. These traders are betting on stocks to pullback and VIX to jump:
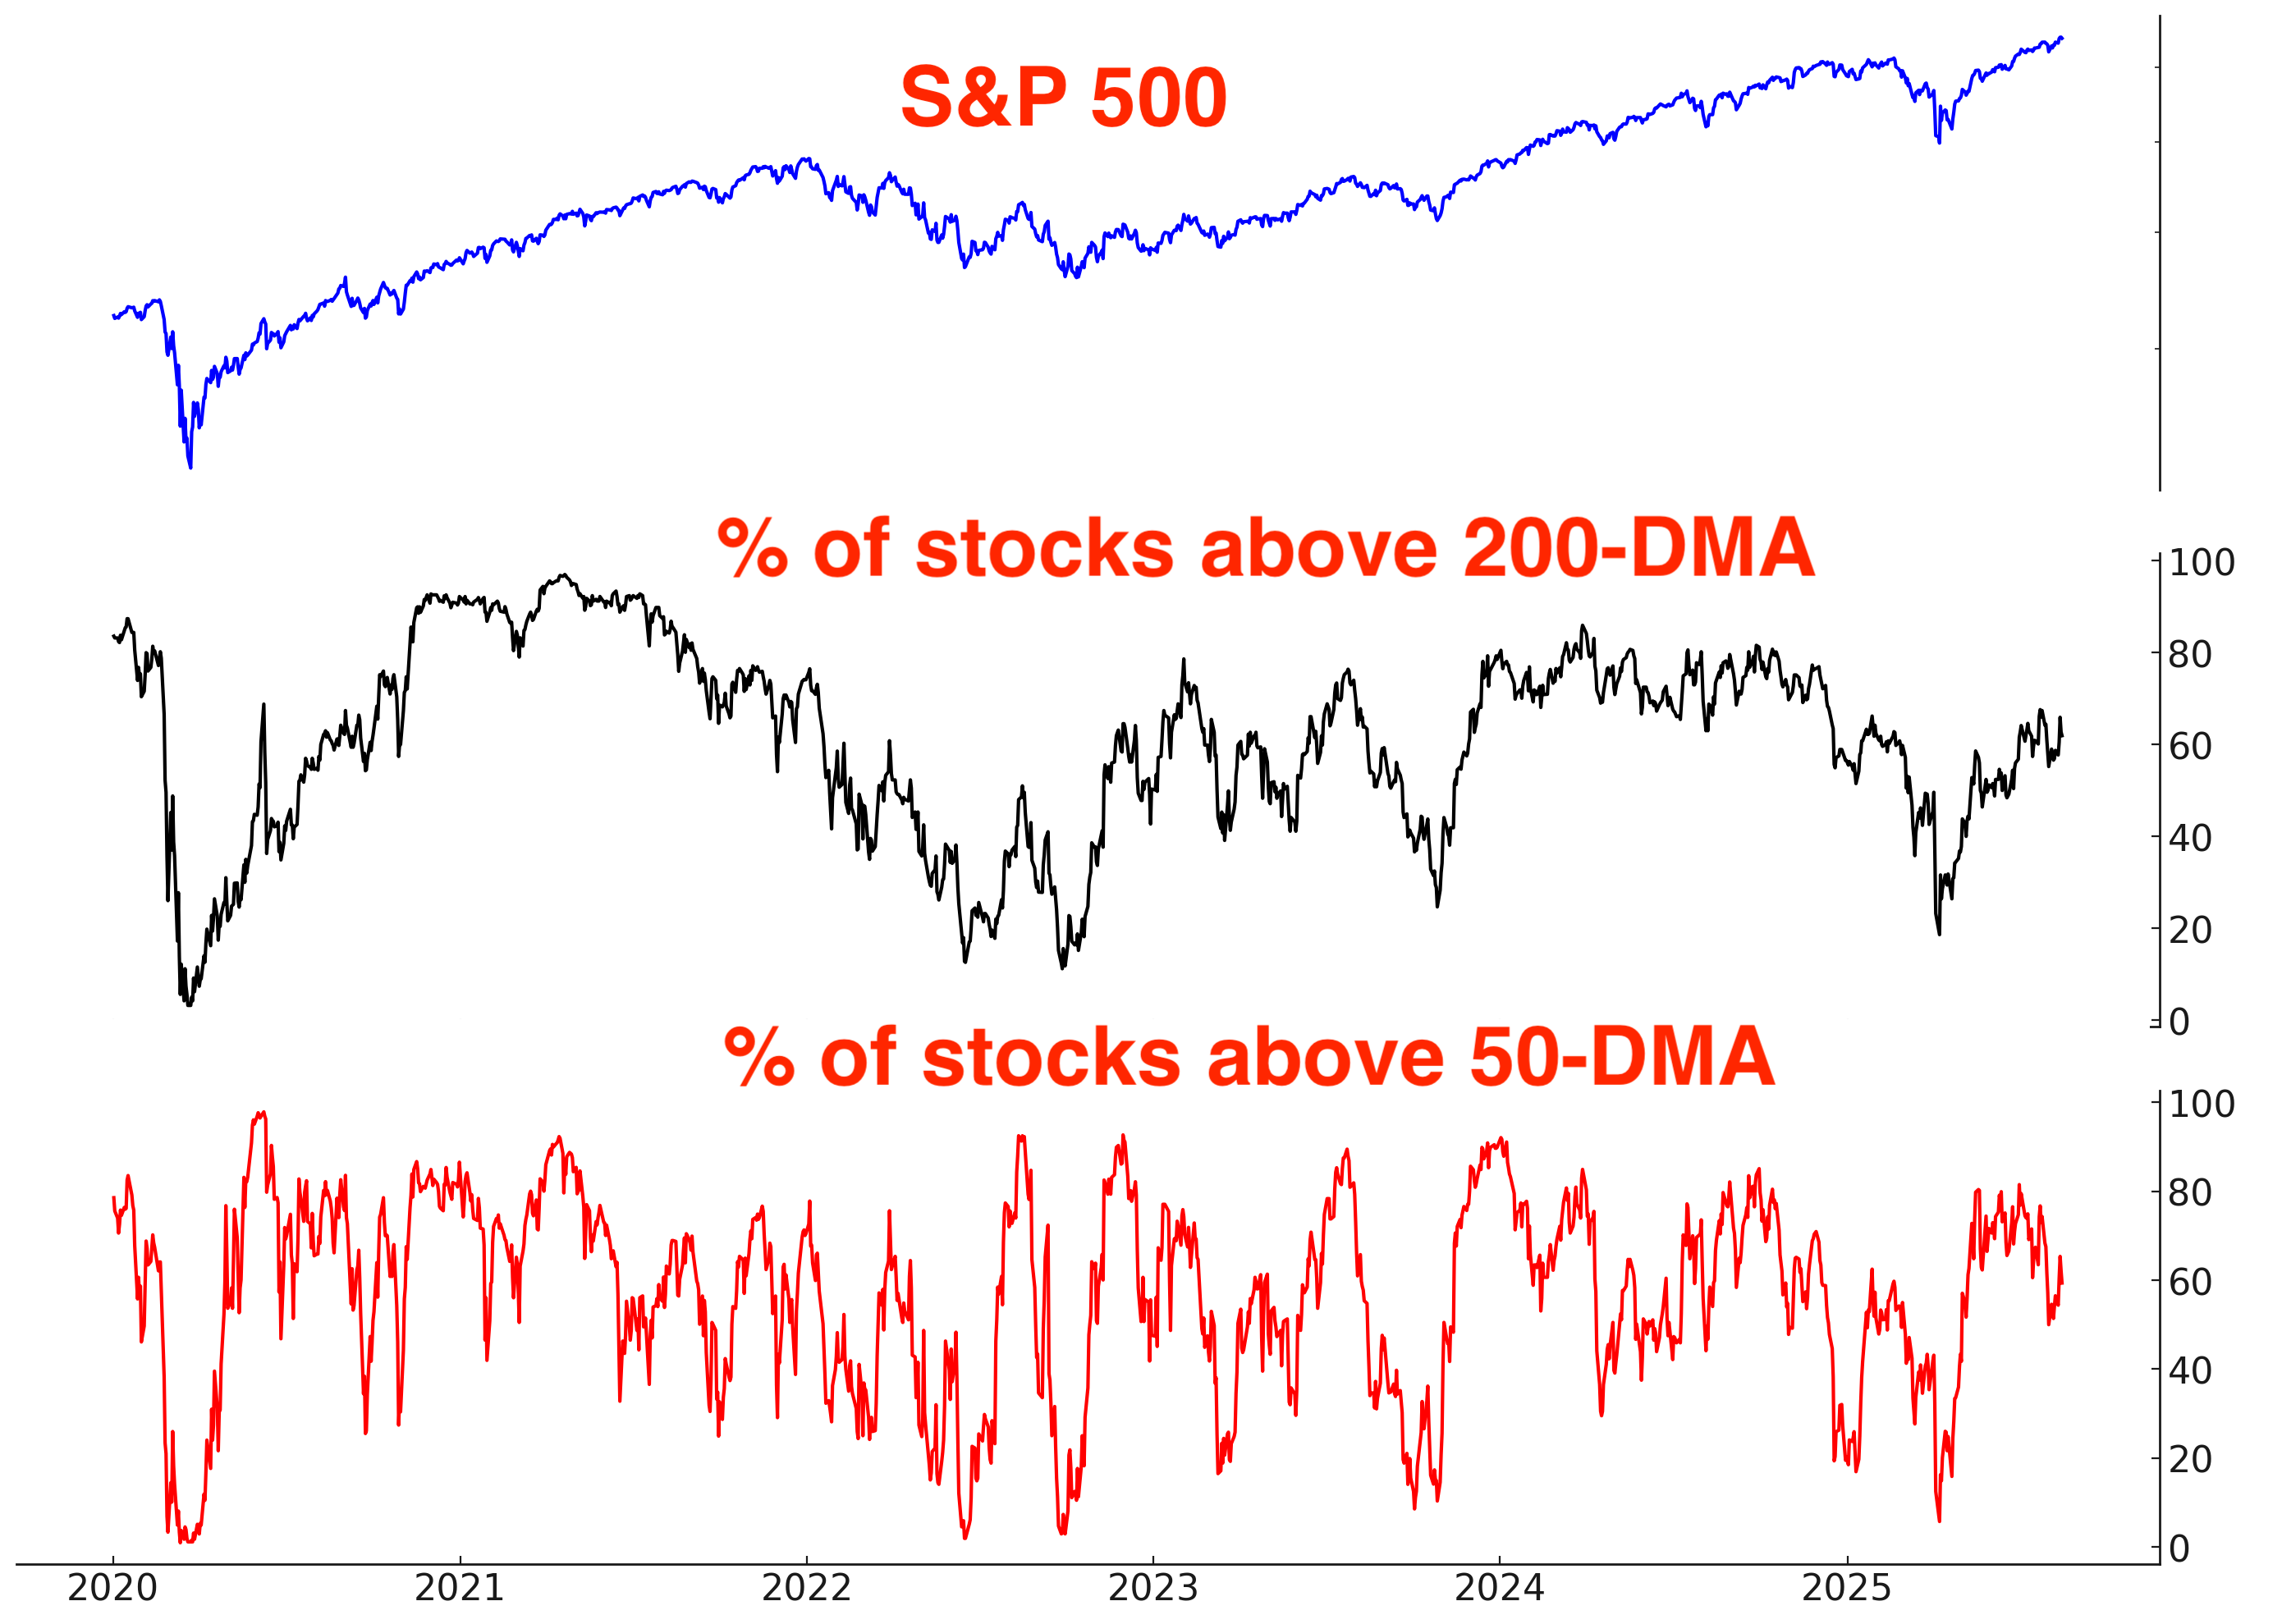
Breadth
Here are the % of S&P 500 stocks above their 200 and 50 day moving averages:
Trend
The trend is your friend, until it ends. Stocks are still trending higher:
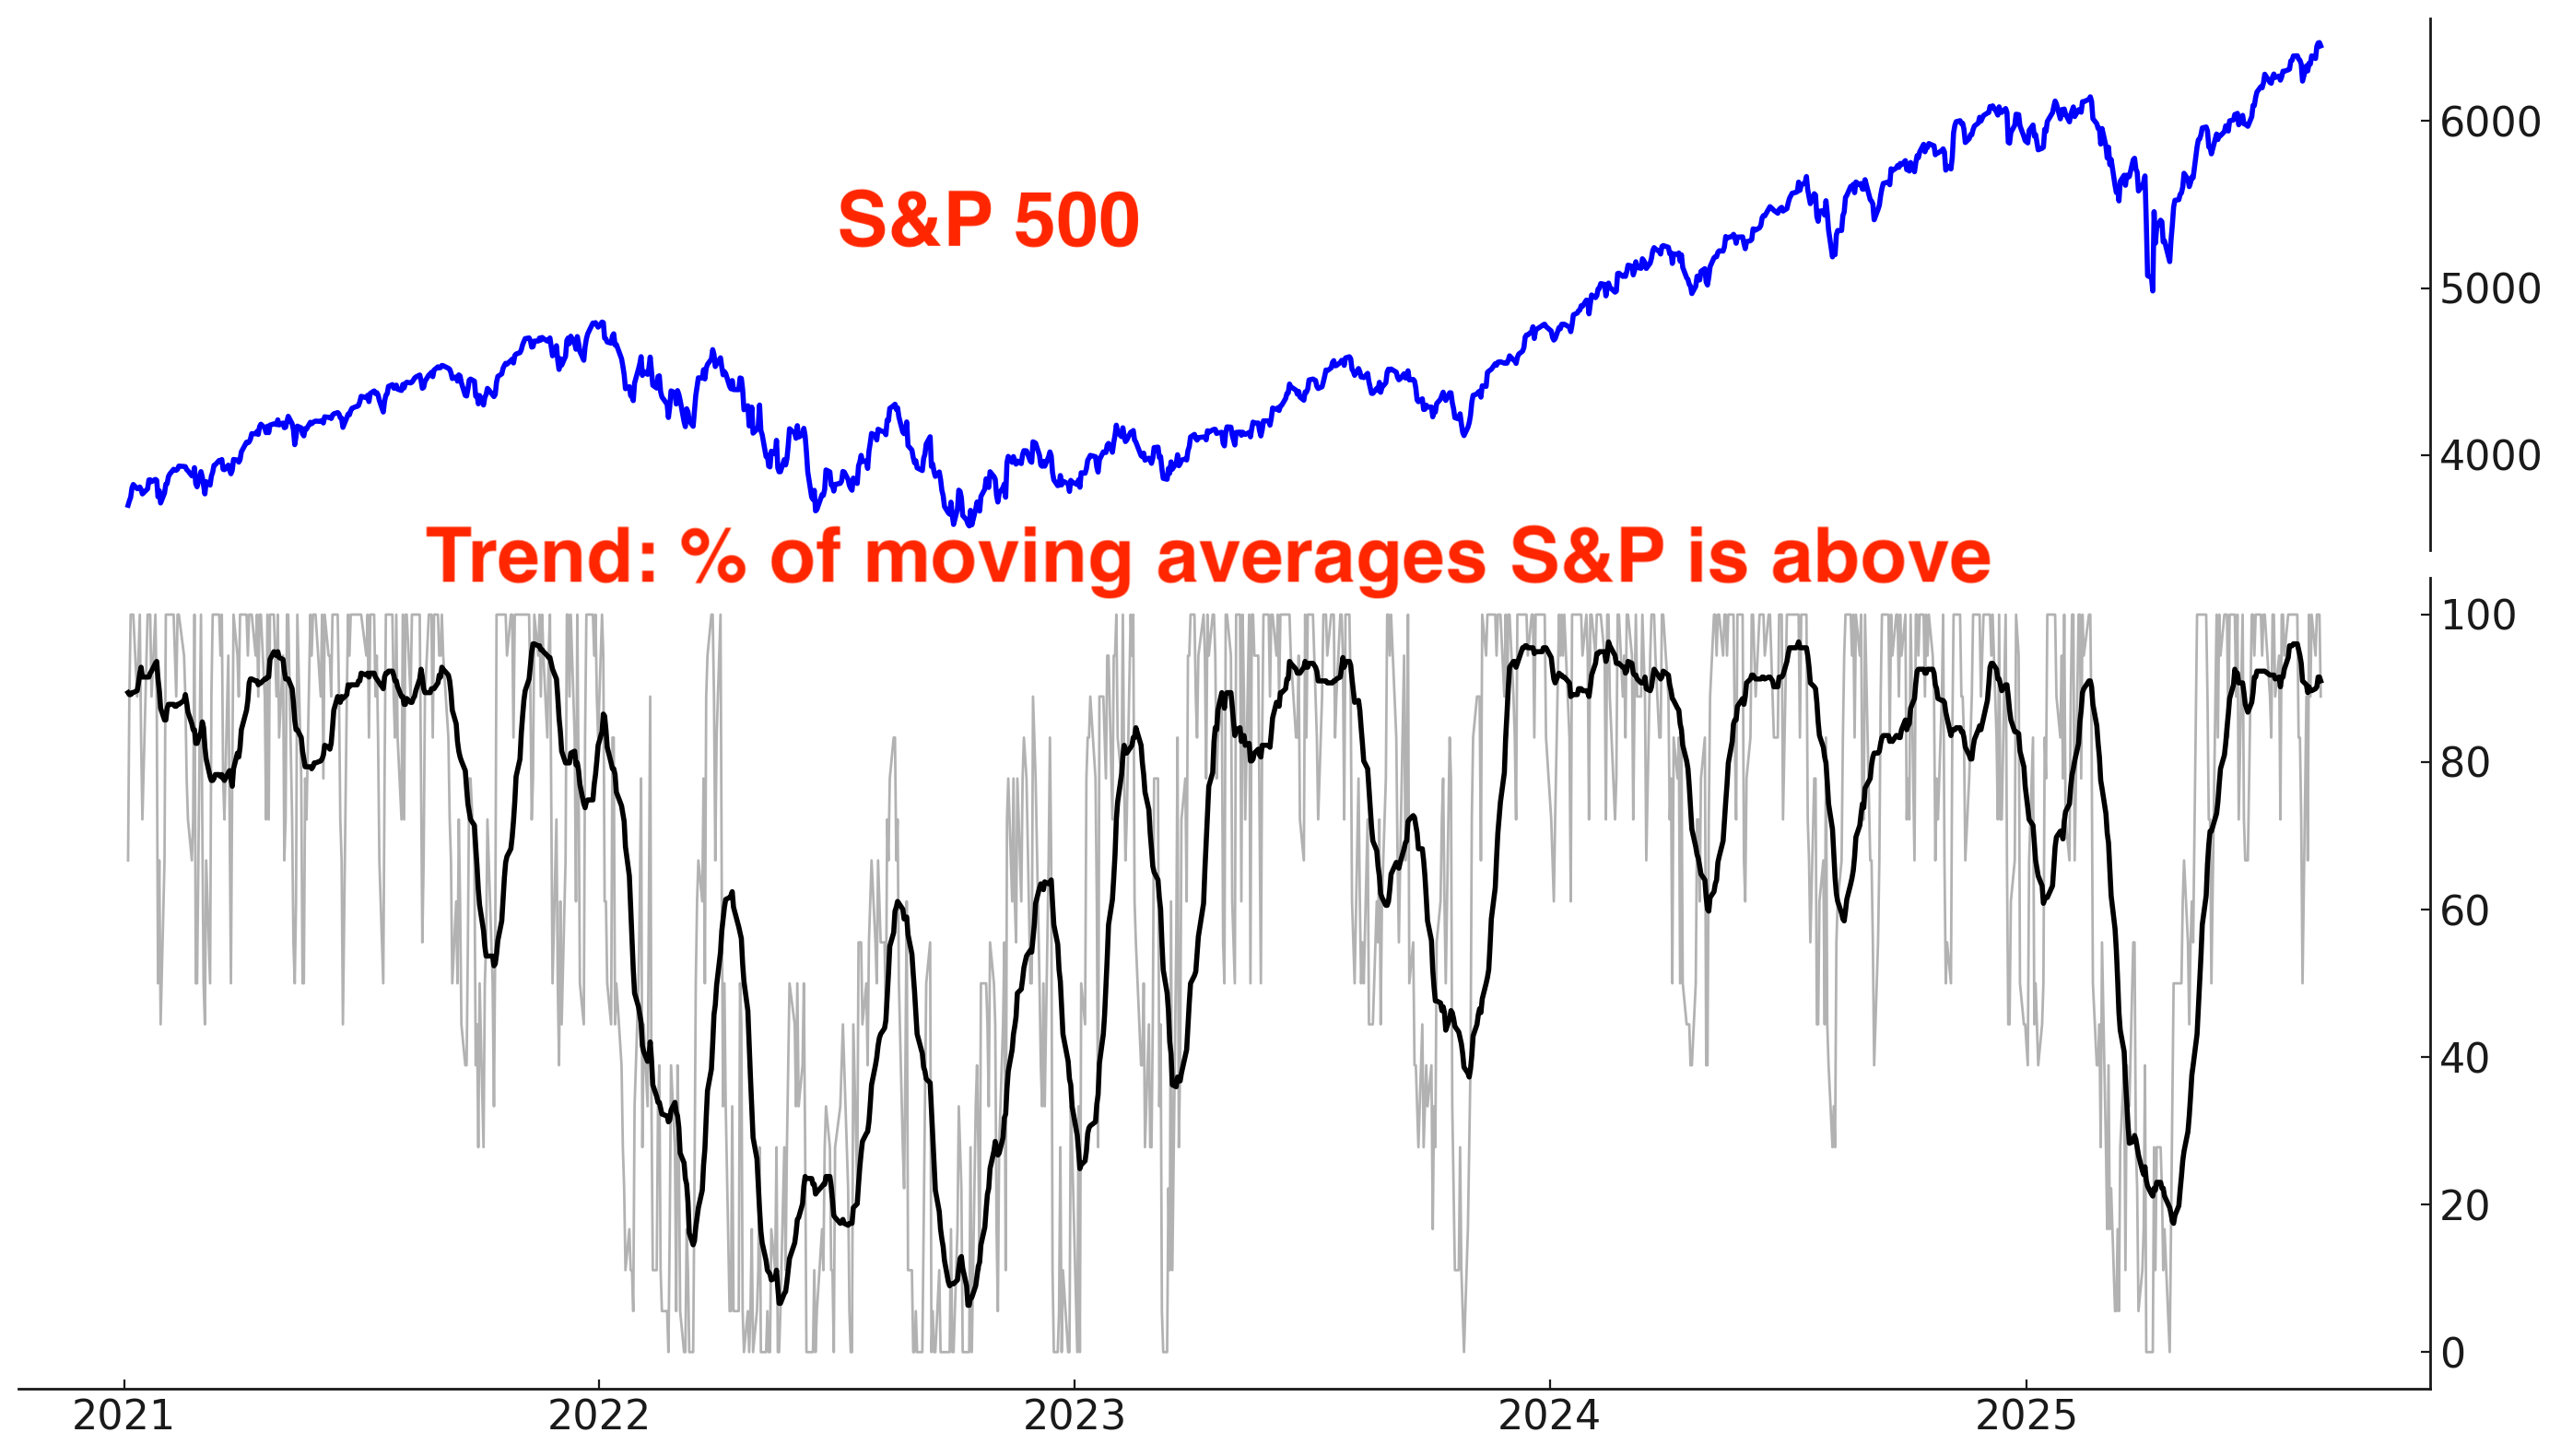
Why does trend matter? Because at least from a trend following perspective, it’s better to buy when the market is trending Up (e.g. above its 200-DMA) than when the market is trending Down (e.g. below its 200-DMA).
*There is nothing “special” about the 200 day moving average, except the fact that it’s popular. It is not significantly different from the 195, 190, 185, 180, 205, 210, 215, or 220 moving averages.
Long above vs. below the S&P 500’s 200 day moving average:

Long above vs. below the S&P 500’s 50 day moving average:

Long above vs. below the S&P 500’s 20 day moving average:

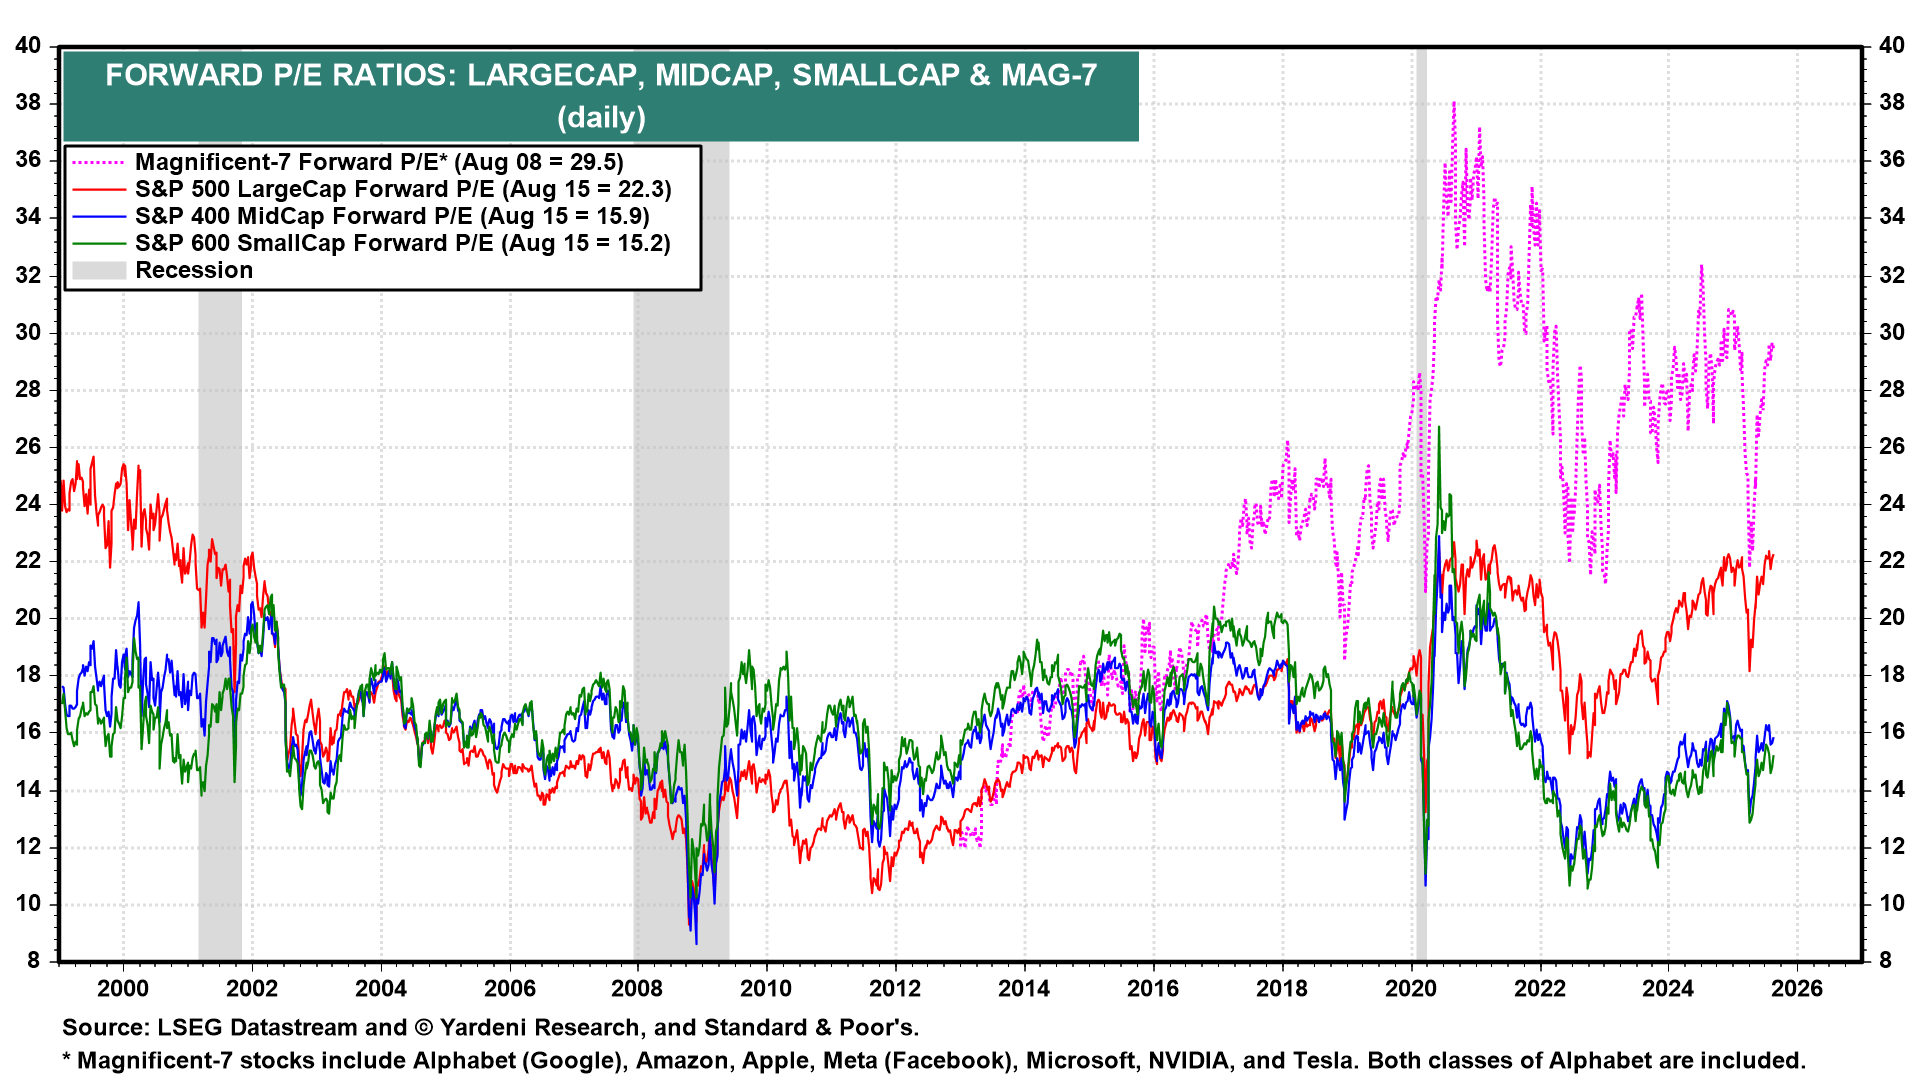
Earnings & Valuations
Some traders say that valuations and fundamentals are useless, and that “only price matters”. While this is true for day traders (valuations have zero impact on the market’s short term direction), fundamentals matter for traders and investors with longer term horizons.
Valuations for large cap stocks (S&P 500) remain elevated compared to their 10 year average:
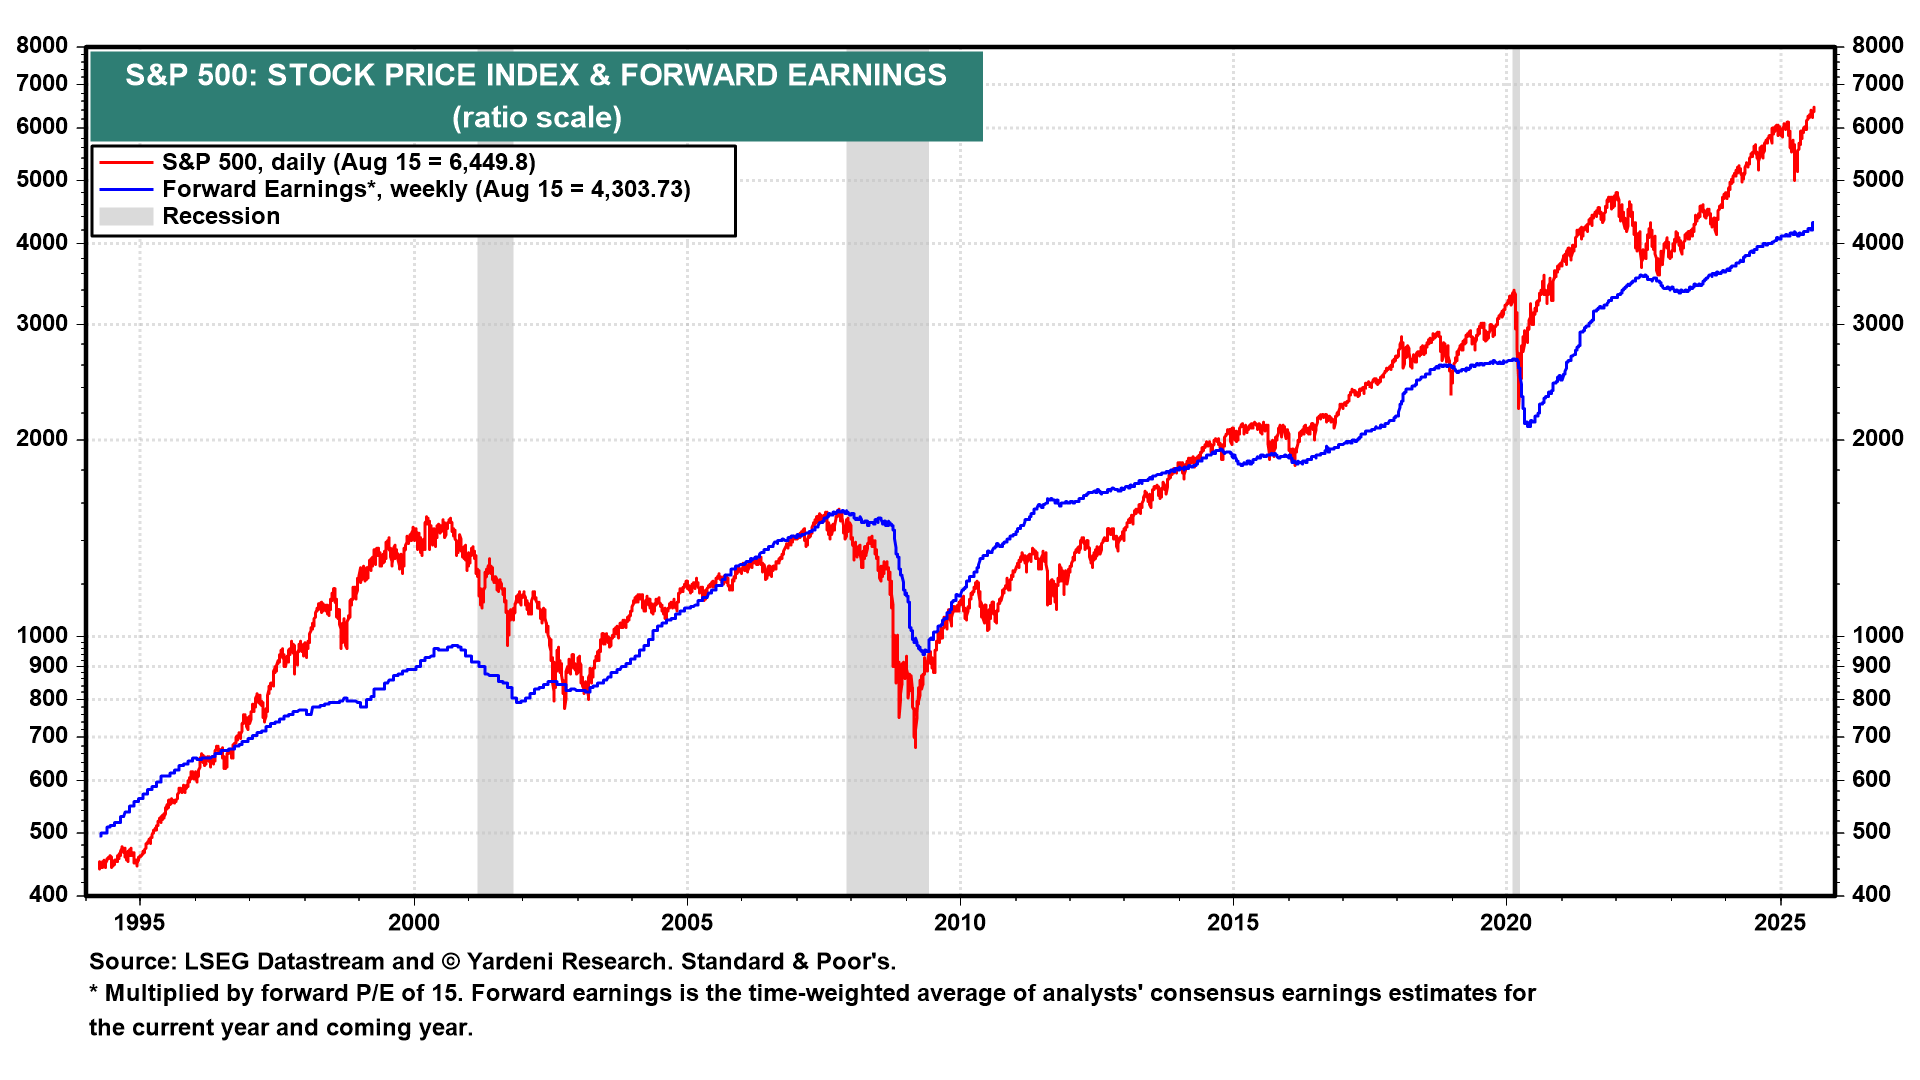
Here’s the S&P 500’s forward earnings expectations. In the long run, earnings and stock prices move in the same direction. Earnings are still growing right now.