
Markets Report: new all-time highs! What's next?
Party like it's 1999?

The S&P 500 and NASDAQ finally made new all-time highs! As is the case in most bull markets, this rally is being led by high-growth stocks (e.g. AI & tech stocks).


In today’s Markets Report I’ll share my outlook for stocks, Bitcoin, commodities, bonds, and currencies — and explain how I’m positioning my portfolio in response.
U.S. Stocks
The S&P 500 made a new all-time high. This has been a quick recovery considering that the S&P was almost in a bear market less than 3 months ago.

Historically, such strong recoveries usually saw more gains in the months ahead. HOWEVER, this does not mean that the next few weeks can’t be choppy:

Both SPY (S&P 500 ETF) and QQQ (NASDAQ ETF) rallied every day this week. This is bull market behavior:

Breadth
Looking under the hood, breadth is a little weak. Despite the S&P 500 being near all-time highs, the % of stocks above their 200 day moving average is somewhat low:


Sentiment Surveys
Depending on what sentiment survey you look at, segments of investors and traders do not believe in this rally. Different surveys poll different categories of investors/traders.
*Retail REALLY believes in this rally, as they’ve been conditioned over the past few years to buy every dip. Buying the dip with leverage works, until the one day it kills you.
According to the AAII sentiment survey, there are still more Bears than Bulls! This is surprising considering that stocks are at all-time highs:

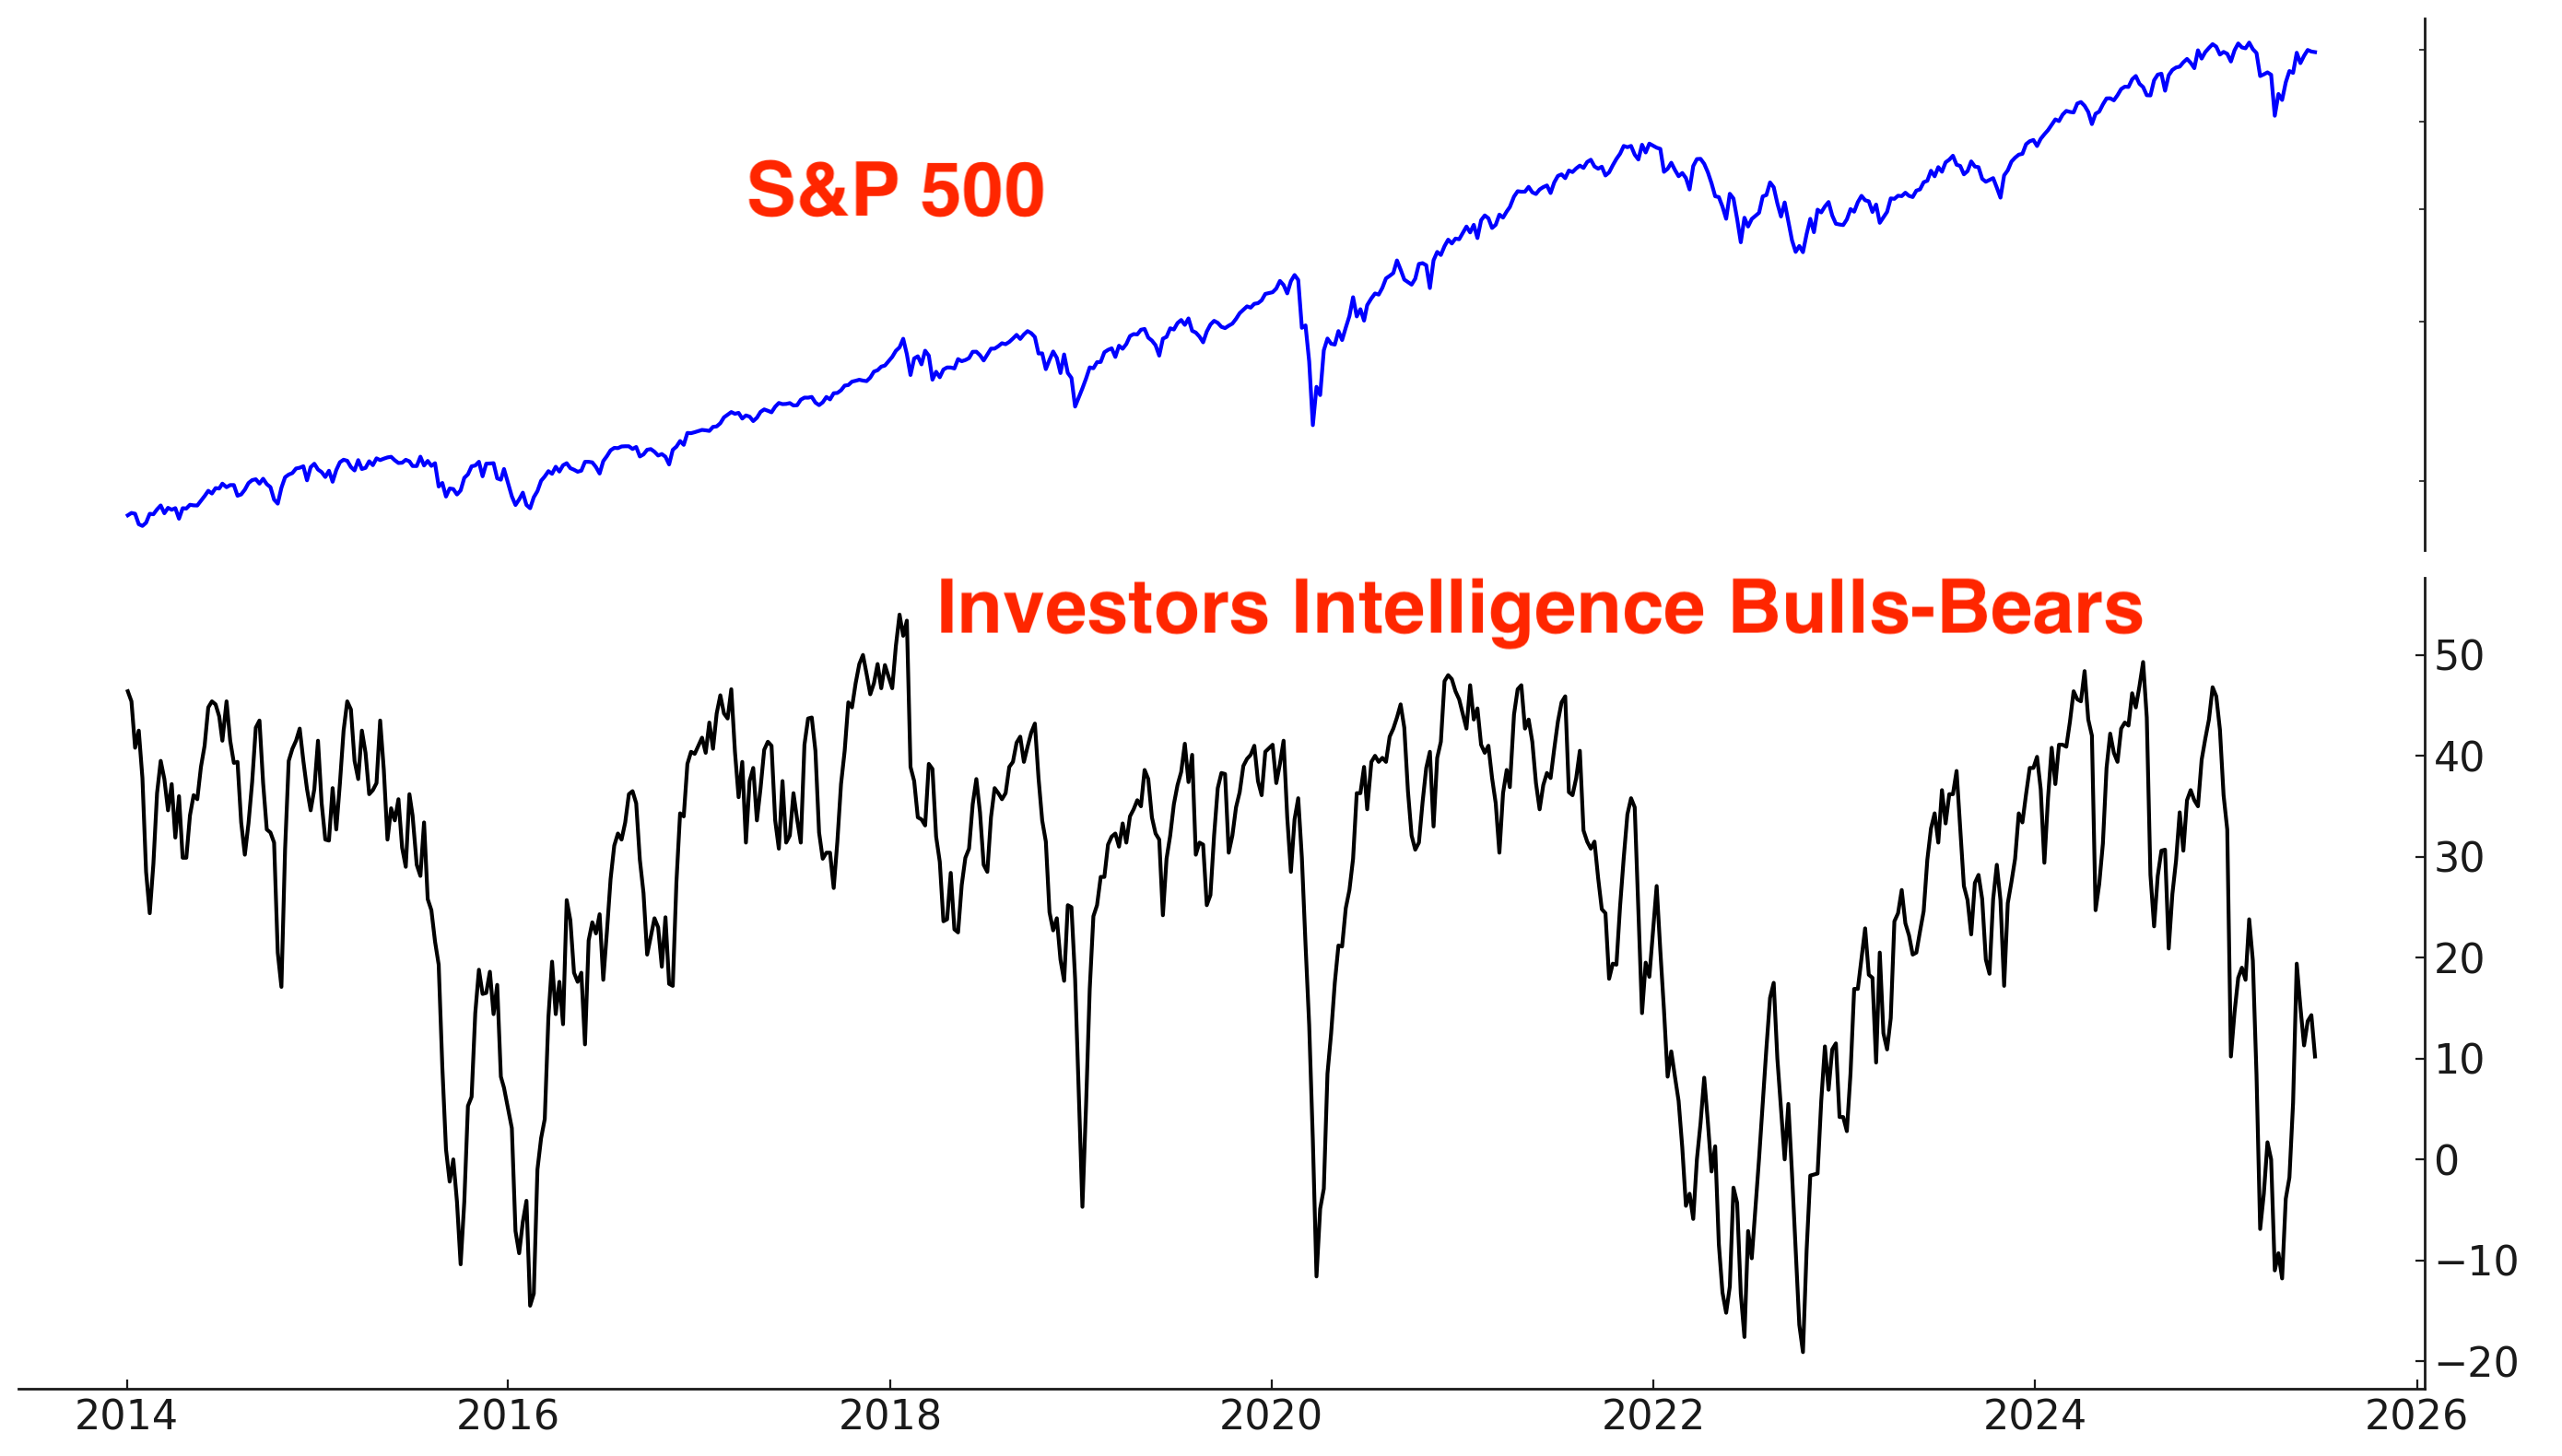
The Investors Intelligence sentiment survey (which polls newsletter writers) also demonstrates that sentiment is muted:
The NAAIM Exposure Index (National Association of Active Investment Managers) is more bullish than AAII and Investors Intelligence:

Other Sentiment
The S&P 500’s Daily Sentiment Index is elevated:

CNN Fear & Greed is somewhat elevated:

Options
The $ value of all Call volume - the $ value of all Put volume is elevated, but not extremely high:

The CBOE’s Total Put/Call Ratio is neutral: not extremely high nor extremely low:

The SKEW Index, which reflects perceived tail risk in the options market — or the probability of extreme downside moves — remains muted. Despite stocks being at all-time highs, SKEW is below the elevated levels seen earlier this year.

Corporate Insiders
The Corporate Insider Buy/Sell Ratio is slowly trending Down. Few insiders are buying:

Same chart, but using a log scale for the Insider Buy/Sell Ratio:

Fund Flows
*Fund flows aren’t automatically contrarian. It depends on what type of trader is buying/selling and why. Some ETFs are traded by mean-reversion traders, while other ETFs are traded by trend followers. Moreover, many ETFs are small relative to the underlying market, so fund flows don’t always reflect broad sentiment towards that market.
TQQQ is traded by mean-reversion traders who buy when TQQQ falls and sell (take profits) when TQQQ rallies.
TQQQ is still seeing outflows, which suggests that these mean-reversion traders are still taking profits. However, these outflows are slowing down:

VIX ETFs are also traded by mean-reversion traders; they buy when VIX is low and sell (take profits) when VIX is high.
VIX ETFs’ flows are neutral:

Commitments of Traders Report (COT Report)
According to the COT Report, Asset Managers remain bullish on the S&P 500. It’s interesting to note that Asset Managers did not significantly reduce their net long position during the recent stock market crash:

On the other hand, hedge funds/large speculators are still bearish:

Trend
The trend is your friend, until it ends. Stocks are trending higher:
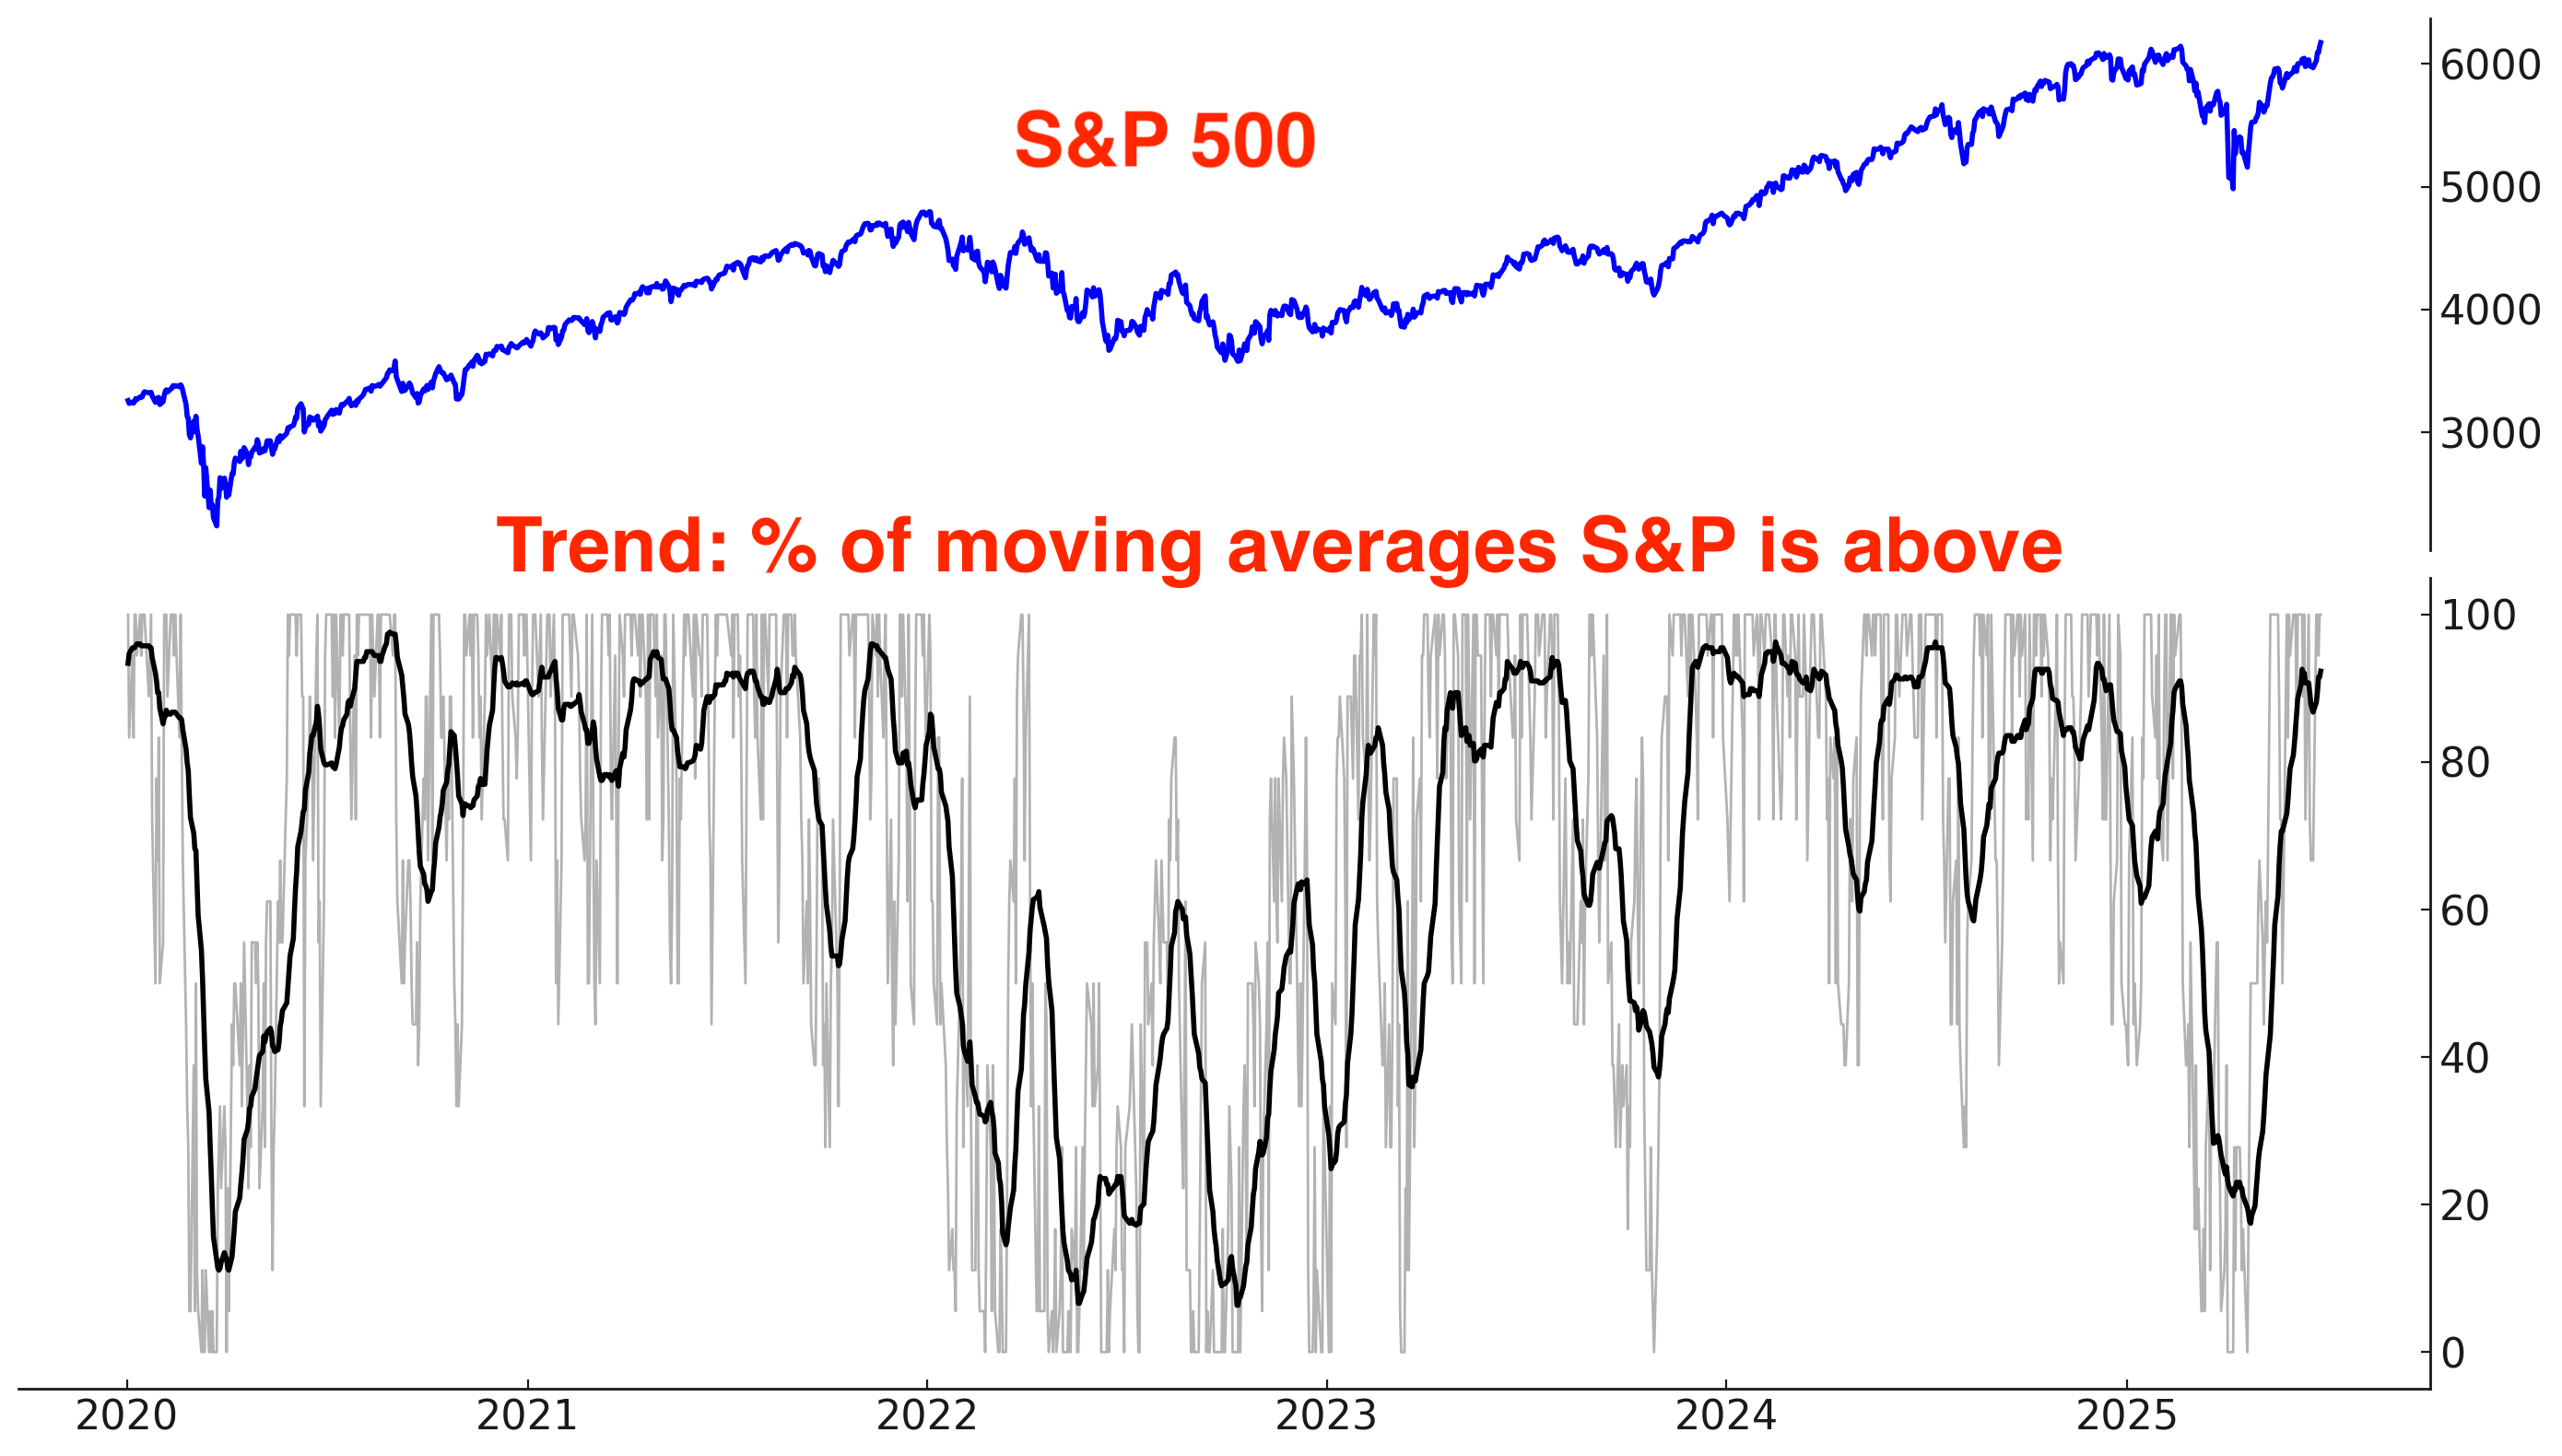
Why does trend matter? Because at least from a trend following perspective, it’s better to buy when the market is trending Up (e.g. above its 200-DMA) than when the market is trending Down (e.g. below its 200-DMA).
*There is nothing “special” about the 200 day moving average, except the fact that it’s popular. It is not significantly different from the 195, 190, 185, 180, 205, 210, 215, or 220 moving averages.
Long above vs. below the S&P 500’s 200 day moving average:

Long above vs. below the S&P 500’s 50 day moving average:

Long above vs. below the S&P 500’s 20 day moving average:

Earnings & Valuations
Some traders say that valuations and fundamentals are useless, and that “only price matters”. While this is true for day traders (valuations have zero impact on the market’s short term direction), fundamentals matter for traders and investors with longer term horizons.
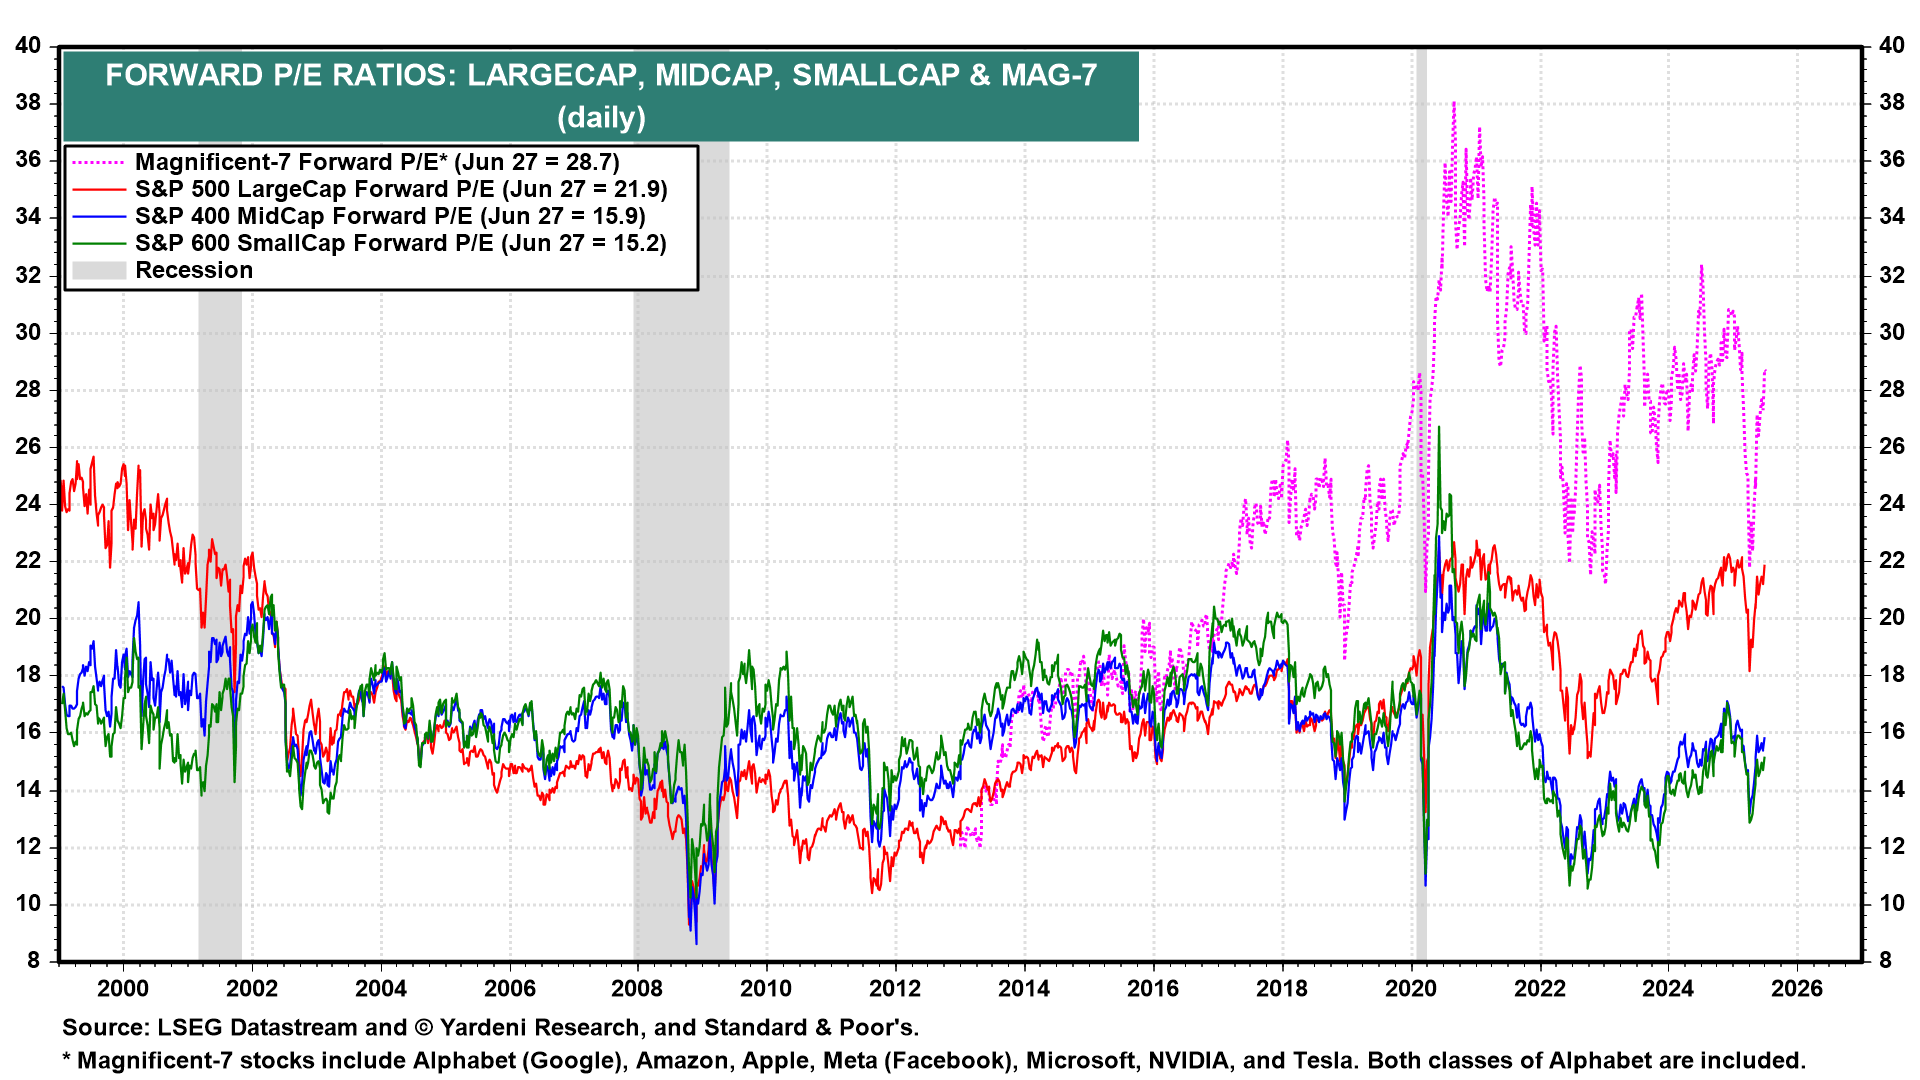
Valuations for large cap stocks (S&P 500) remain elevated compared to their 10 year average:
Here’s the S&P 500’s forward earnings expectations. In the long run, earnings and stock prices move in the same direction. Earnings are still growing right now.
