
Markets Report: all-time highs and Golden Crosses
Pullback followed by a golden summer?

Stocks are making new all-time highs. Traders are going all-in on growth, with retail favorites like Robinhood exploding in popularity. However, relatively few S&P 500 stocks are making new 52 week highs:

U.S. Stocks
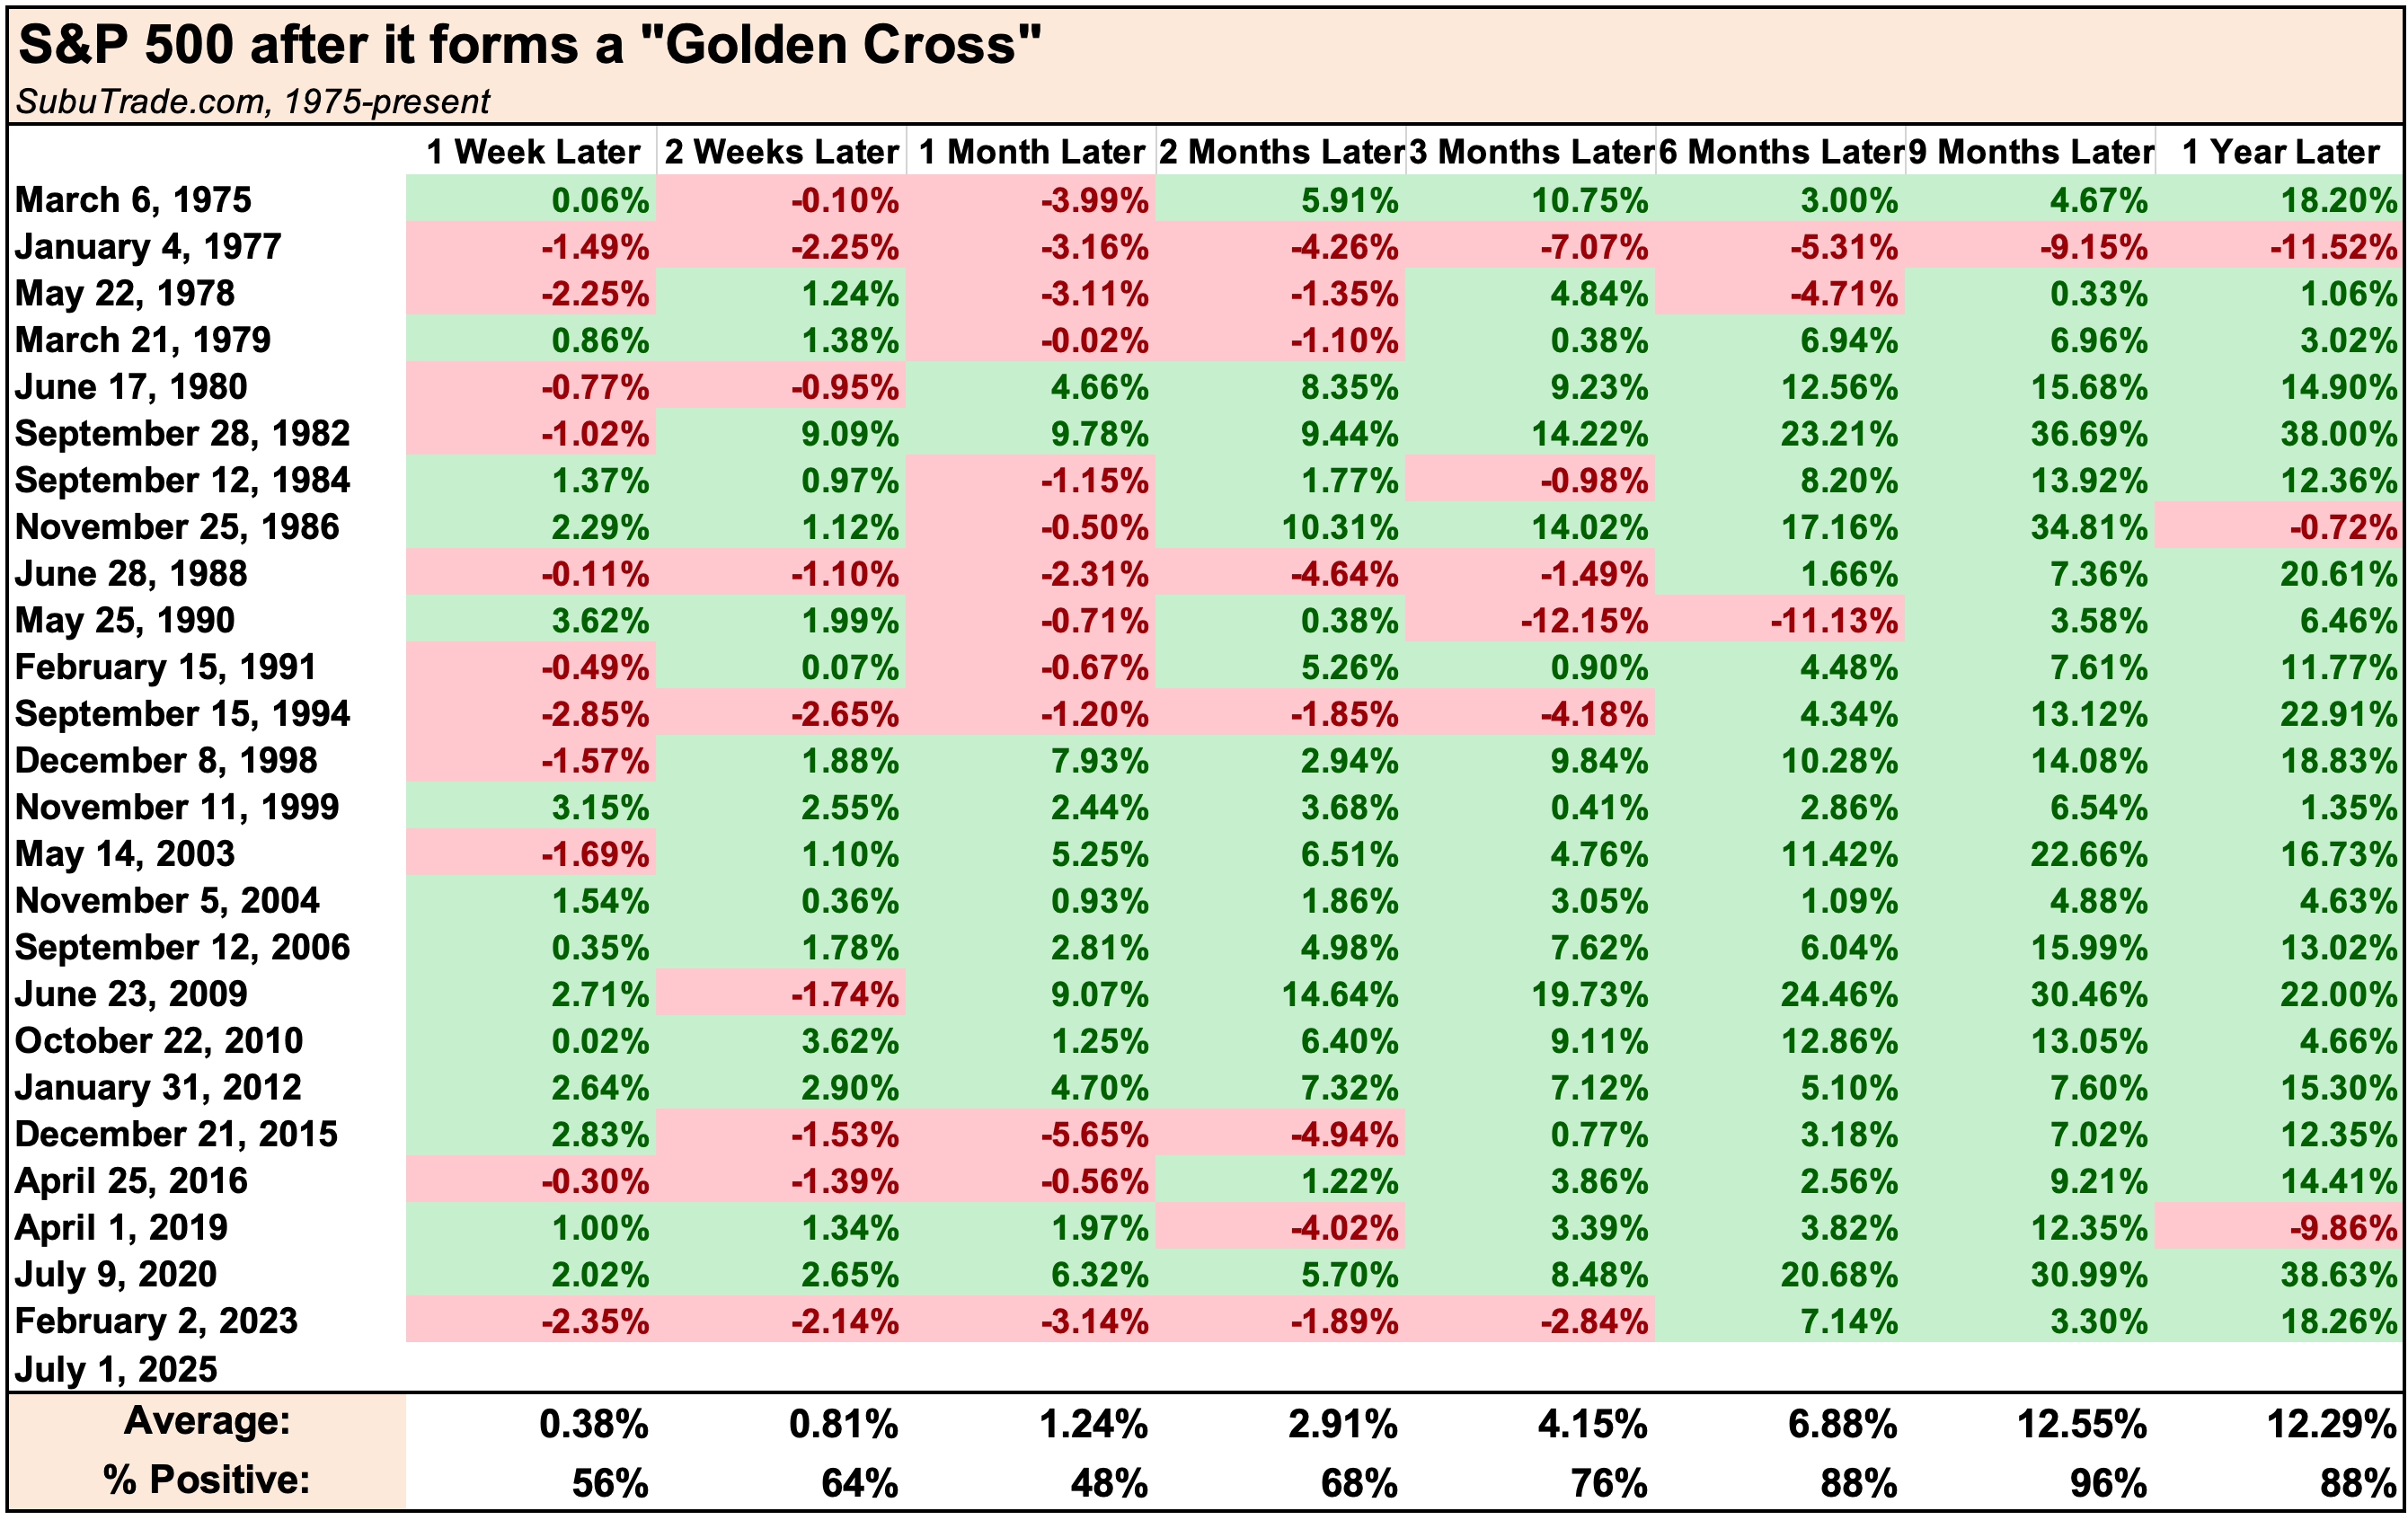
Stocks are trending higher. The S&P 500 formed a “Golden Cross”; its 50 day moving average crossed above its 200 day moving average. This is a bullish sign for the S&P over the next 9 months:
Breadth
A concern that several market watchers on FinX pointed to is the relative lack of breadth. The % of stocks above their 200 day moving average is a little low considering that the S&P is at an all-time high:
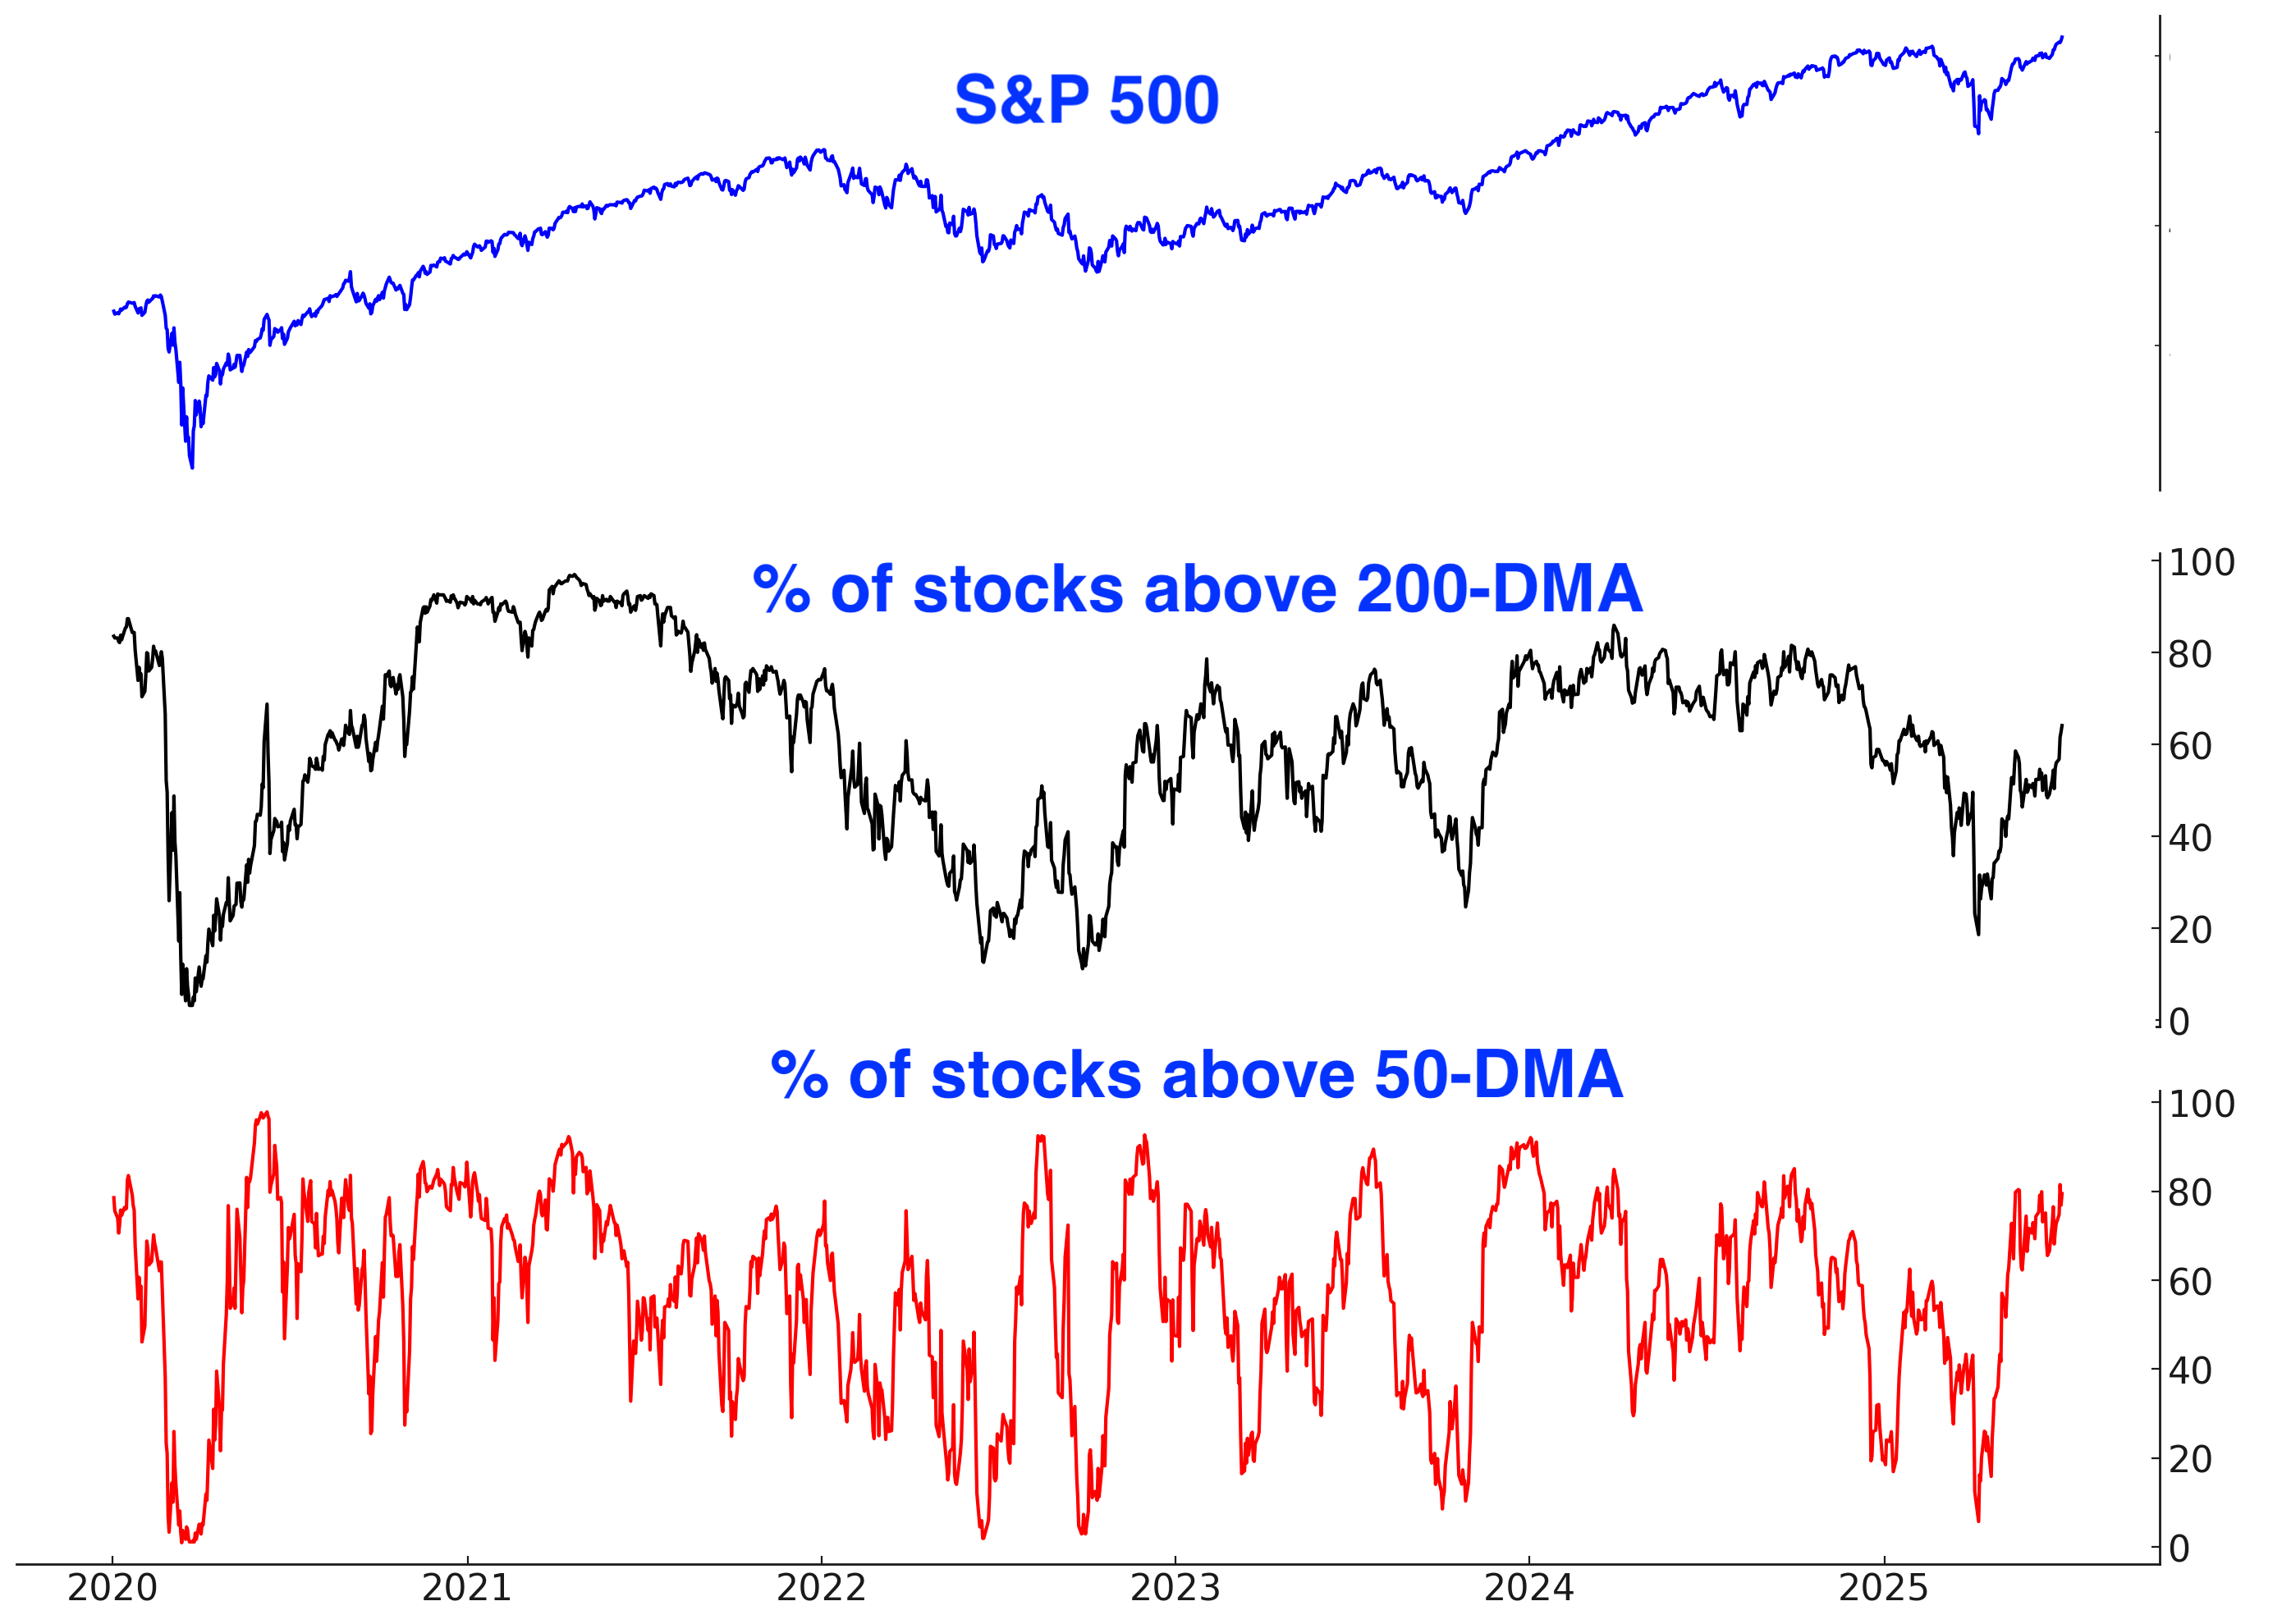
Despite the S&P 500 being more than 7% above its 200-day moving average, only 8% of its stocks are at 52 week highs:
This may sound bearish, but history does not support that view:

Sentiment Surveys
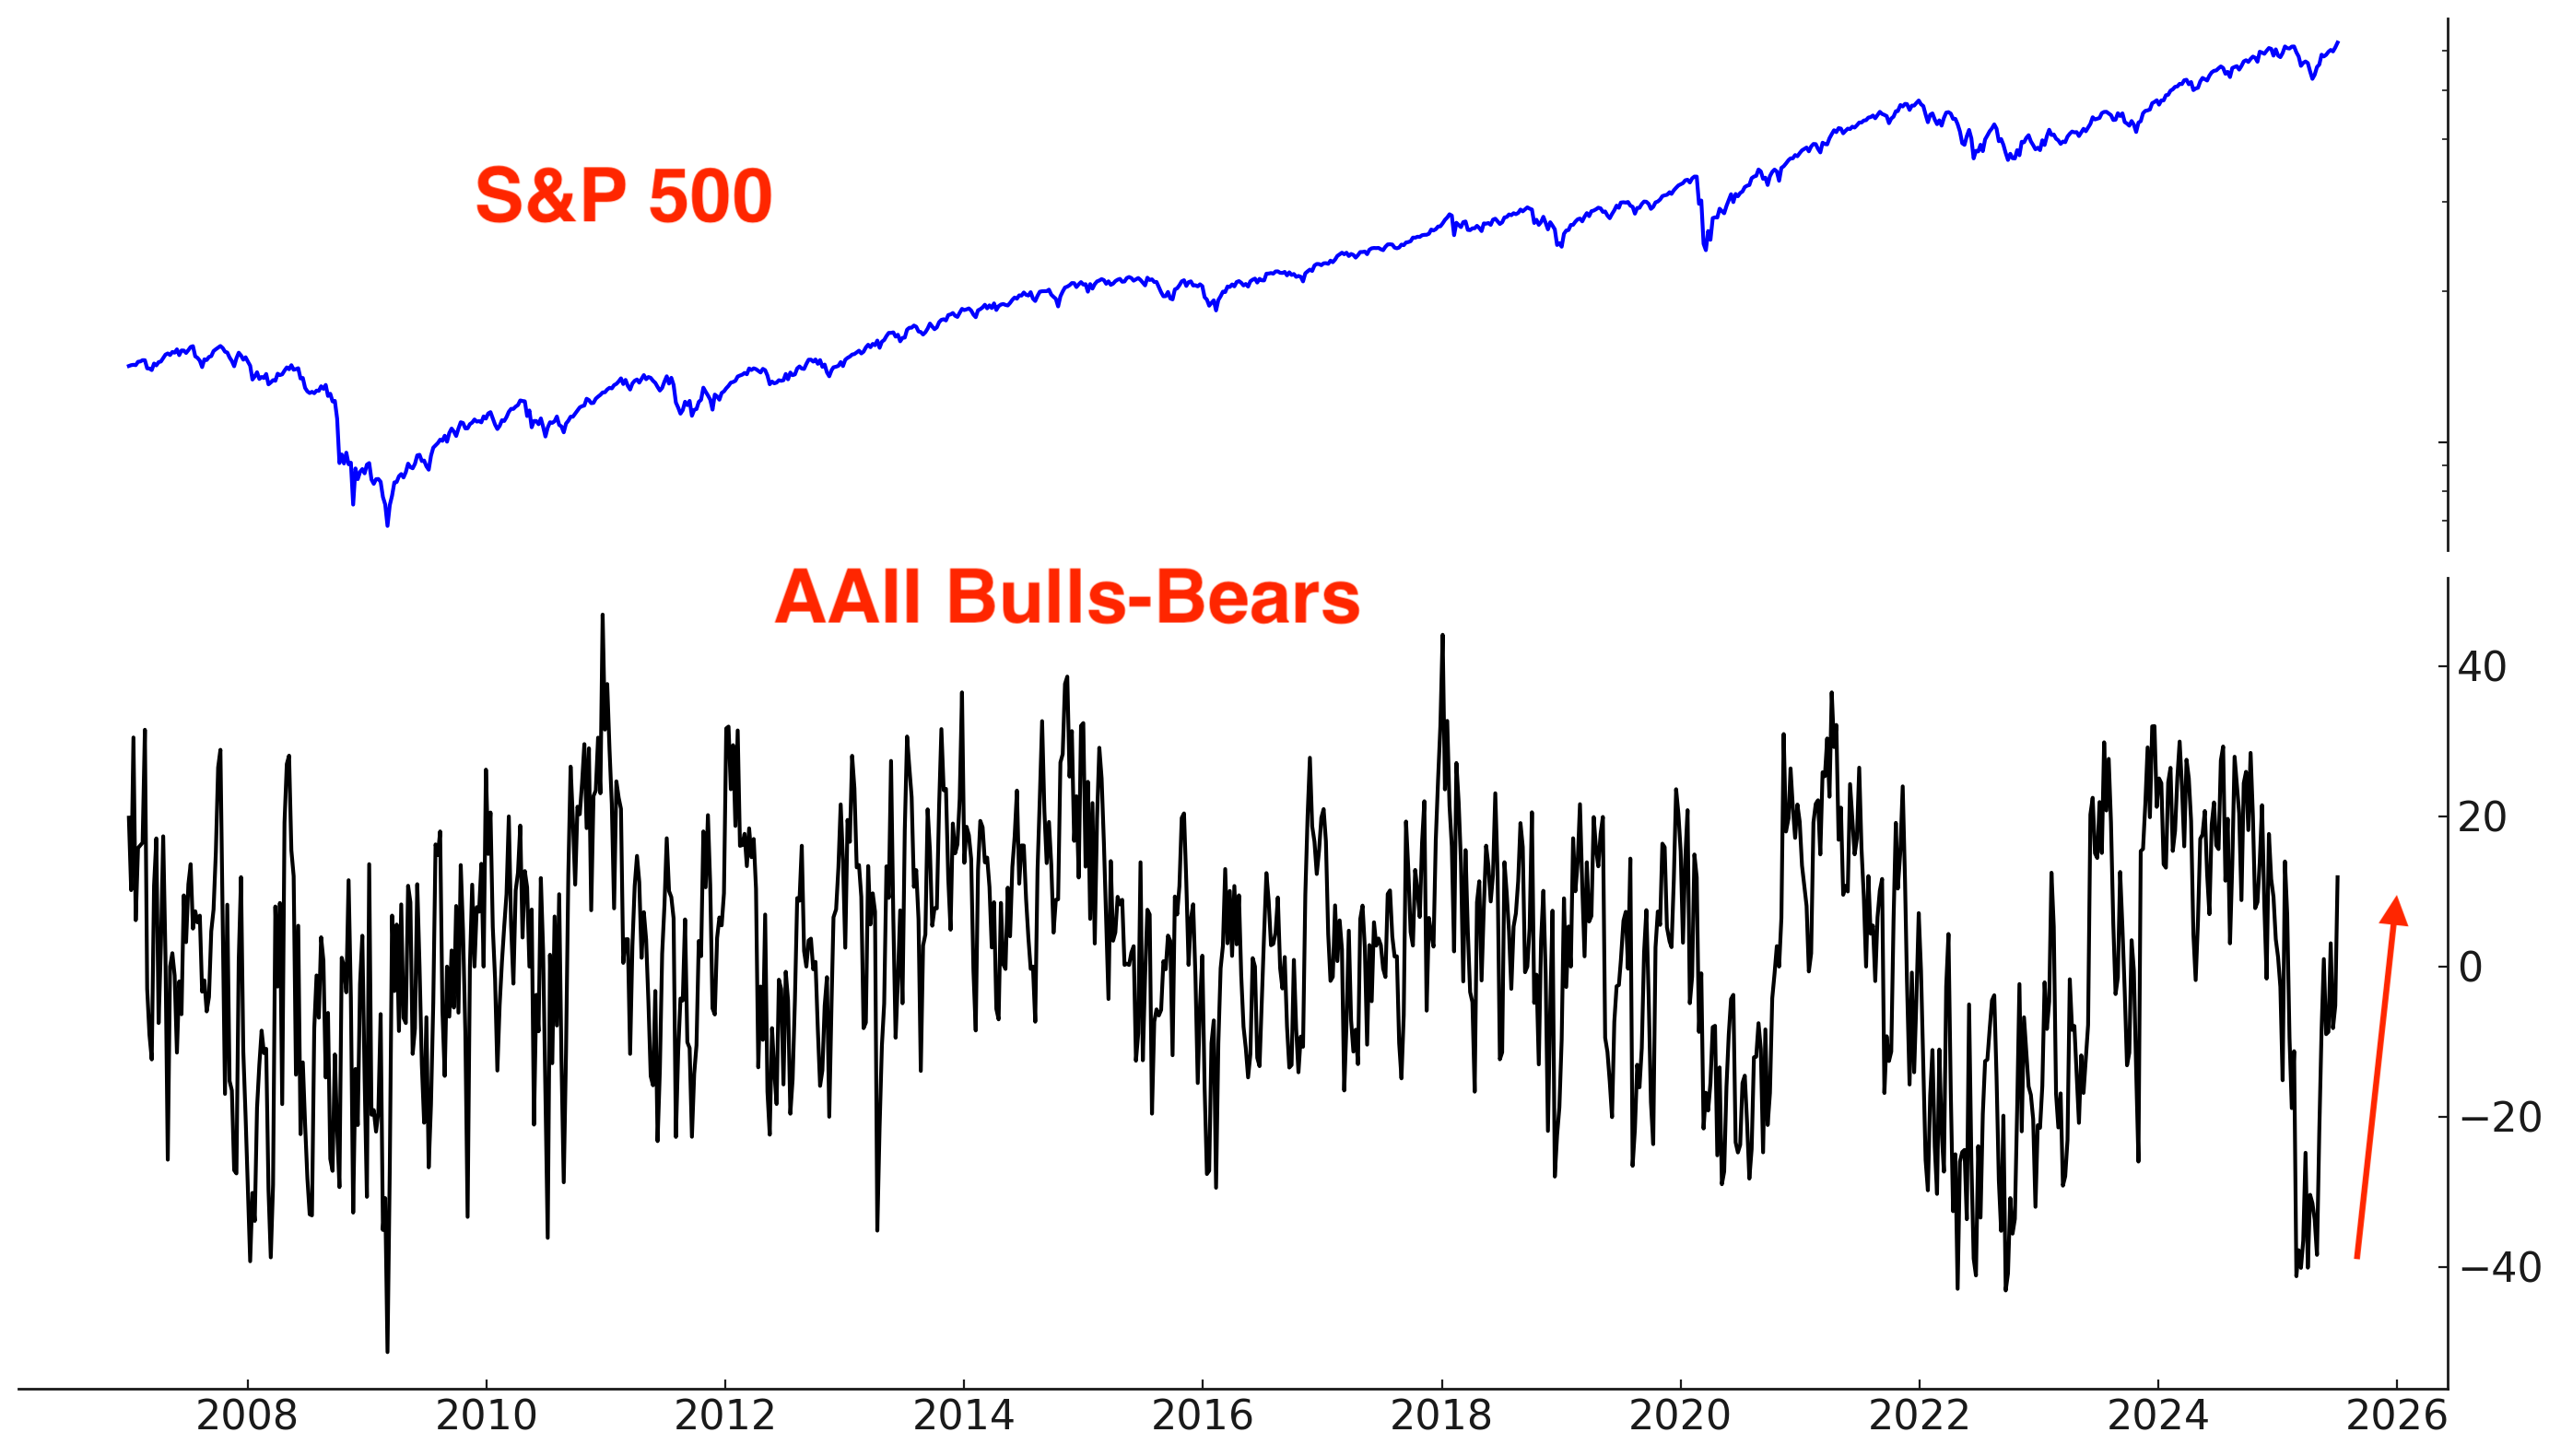
Sentiment jumped this week. AAII Bulls-Bears:
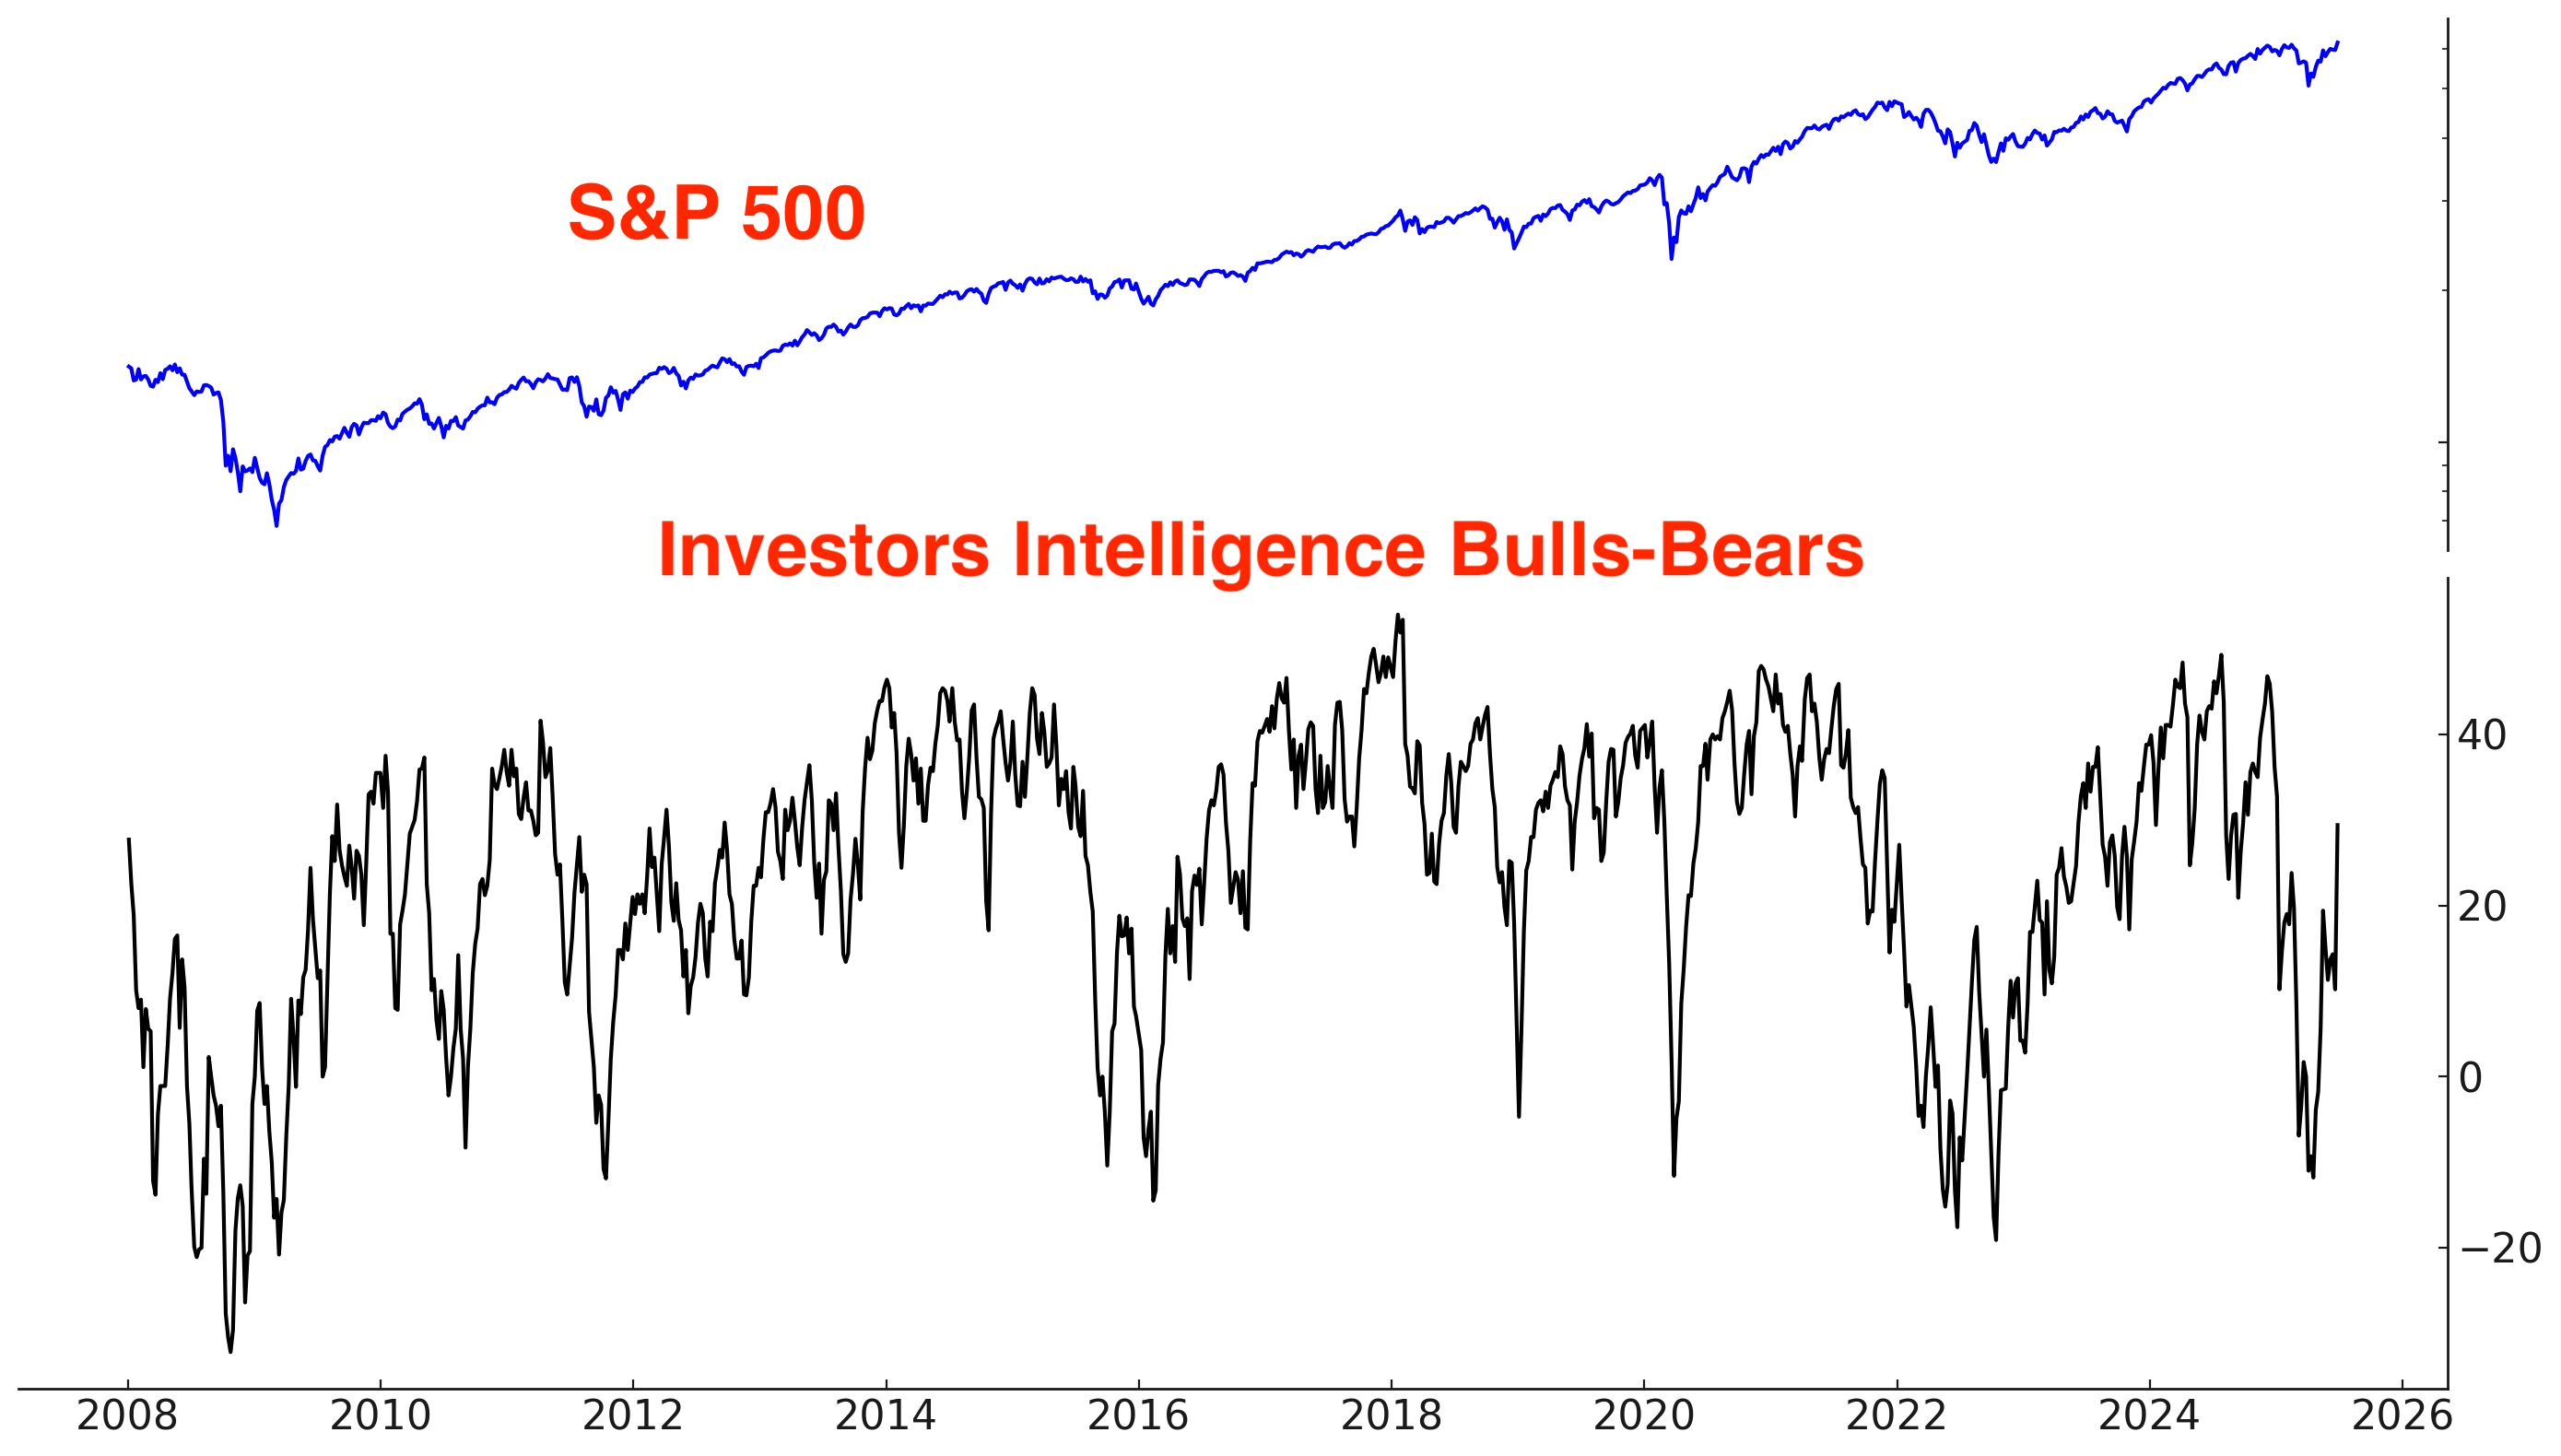
Investors Intelligence Bulls-Bears jumped as well:
The NAAIM Exposure Index (National Association of Active Investment Managers) is more bullish than AAII and Investors Intelligence:

Other Sentiment
CNN Fear & Greed jumped:

The S&P 500’s Daily Sentiment Index is elevated:

VIX Daily Sentiment Index is falling:

Options
The $ value of all Call volume - the $ value of all Put volume is increasing:

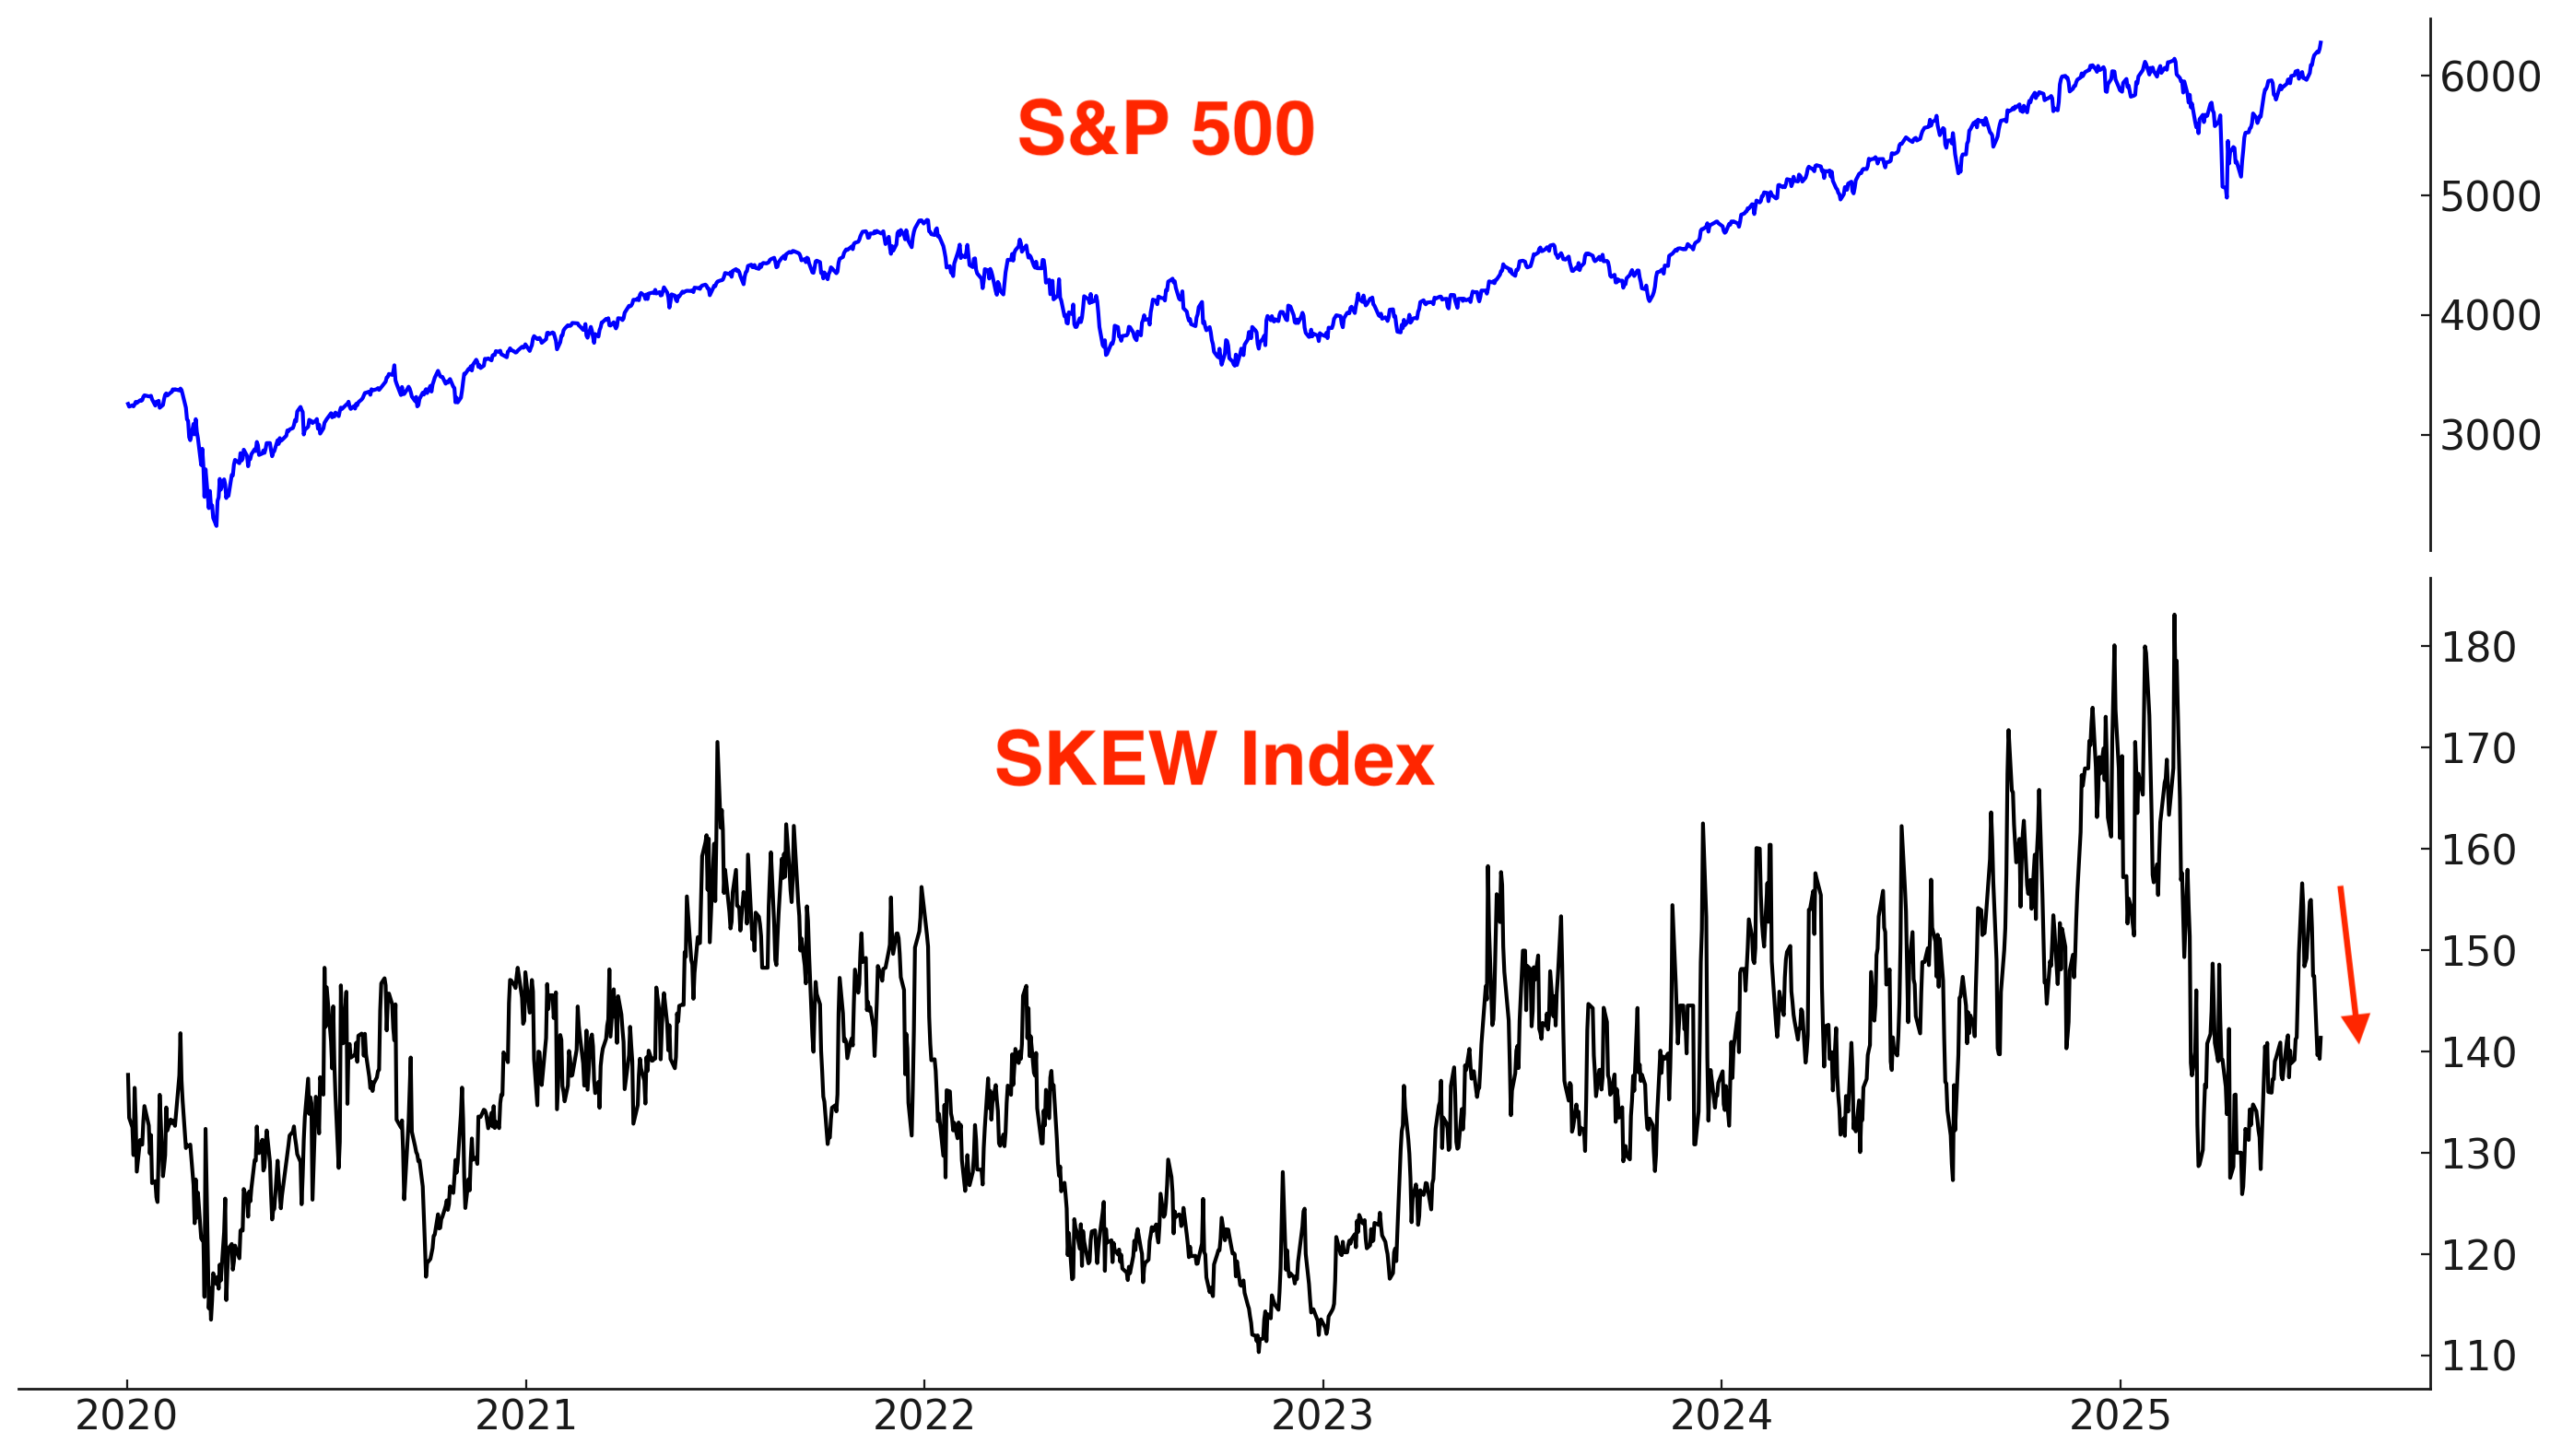
The SKEW Index, which reflects perceived tail risk in the options market — or the probability of extreme downside moves — remains muted. Despite the S&P making new all-time highs, SKEW fell!
Corporate Insiders
The Corporate Insider Buy/Sell Ratio is slowly trending Down. Few insiders are buying:

Same chart, but using a log scale for the Insider Buy/Sell Ratio:

Fund Flows
*Fund flows aren’t automatically contrarian. It depends on what type of trader is buying/selling and why. Some ETFs are traded by mean-reversion traders, while other ETFs are traded by trend followers. Moreover, many ETFs are small relative to the underlying market, so fund flows don’t always reflect broad sentiment towards that market.
TQQQ is traded by mean-reversion traders who buy when TQQQ falls and sell (take profits) when TQQQ rallies.
TQQQ is still seeing outflows, which suggests that these mean-reversion traders are still taking profits:

VIX ETFs are also traded by mean-reversion traders; they buy when VIX is low and sell (take profits) when VIX is high.
VIX ETFs have consistently seen inflows over the past 2 months. These traders are betting on stocks to pullback and VIX to jump:

Trend
The trend is your friend, until it ends. Stocks are trending higher:
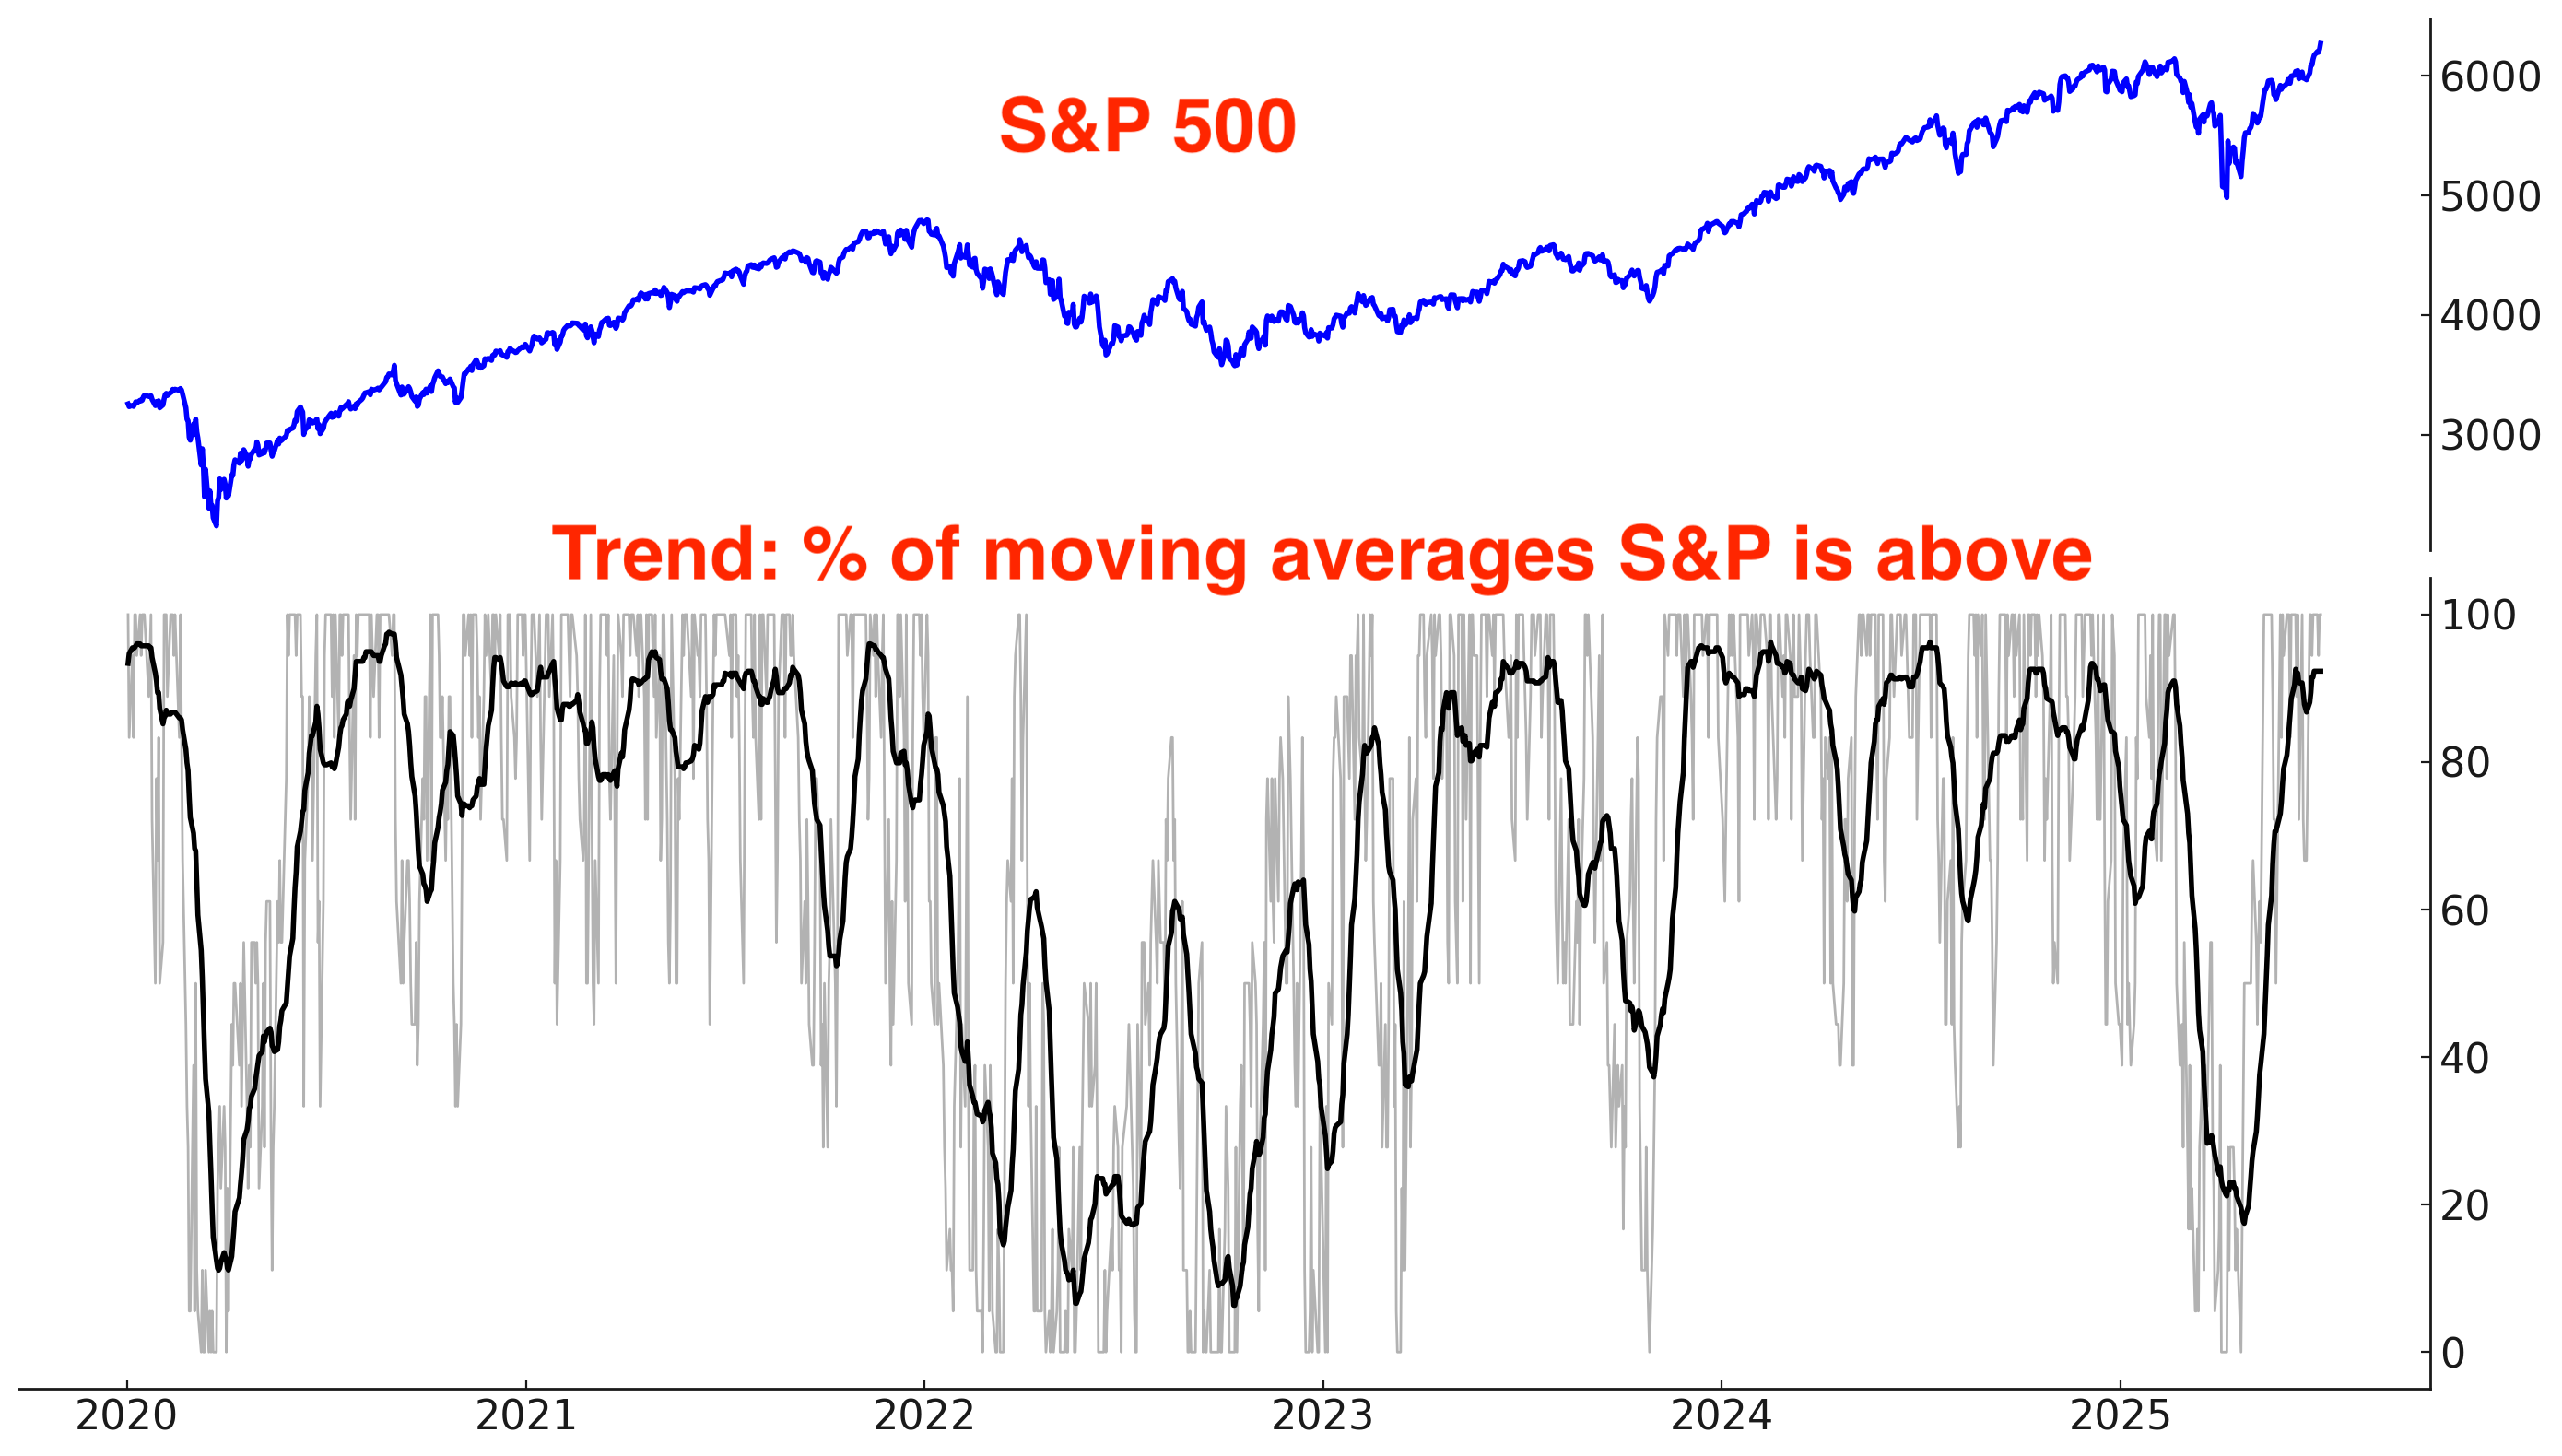
Why does trend matter? Because at least from a trend following perspective, it’s better to buy when the market is trending Up (e.g. above its 200-DMA) than when the market is trending Down (e.g. below its 200-DMA).
*There is nothing “special” about the 200 day moving average, except the fact that it’s popular. It is not significantly different from the 195, 190, 185, 180, 205, 210, 215, or 220 moving averages.
Long above vs. below the S&P 500’s 200 day moving average:

Long above vs. below the S&P 500’s 50 day moving average:

Long above vs. below the S&P 500’s 20 day moving average:

Earnings & Valuations
Some traders say that valuations and fundamentals are useless, and that “only price matters”. While this is true for day traders (valuations have zero impact on the market’s short term direction), fundamentals matter for traders and investors with longer term horizons.
Valuations for large cap stocks (S&P 500) remain elevated compared to their 10 year average:

Here’s the S&P 500’s forward earnings expectations. In the long run, earnings and stock prices move in the same direction. Earnings are still growing right now.
