Daily Data: March 12, 2026

The S&P 500 is making lower lows and lower highs.
Breadth
McClellan Oscillators
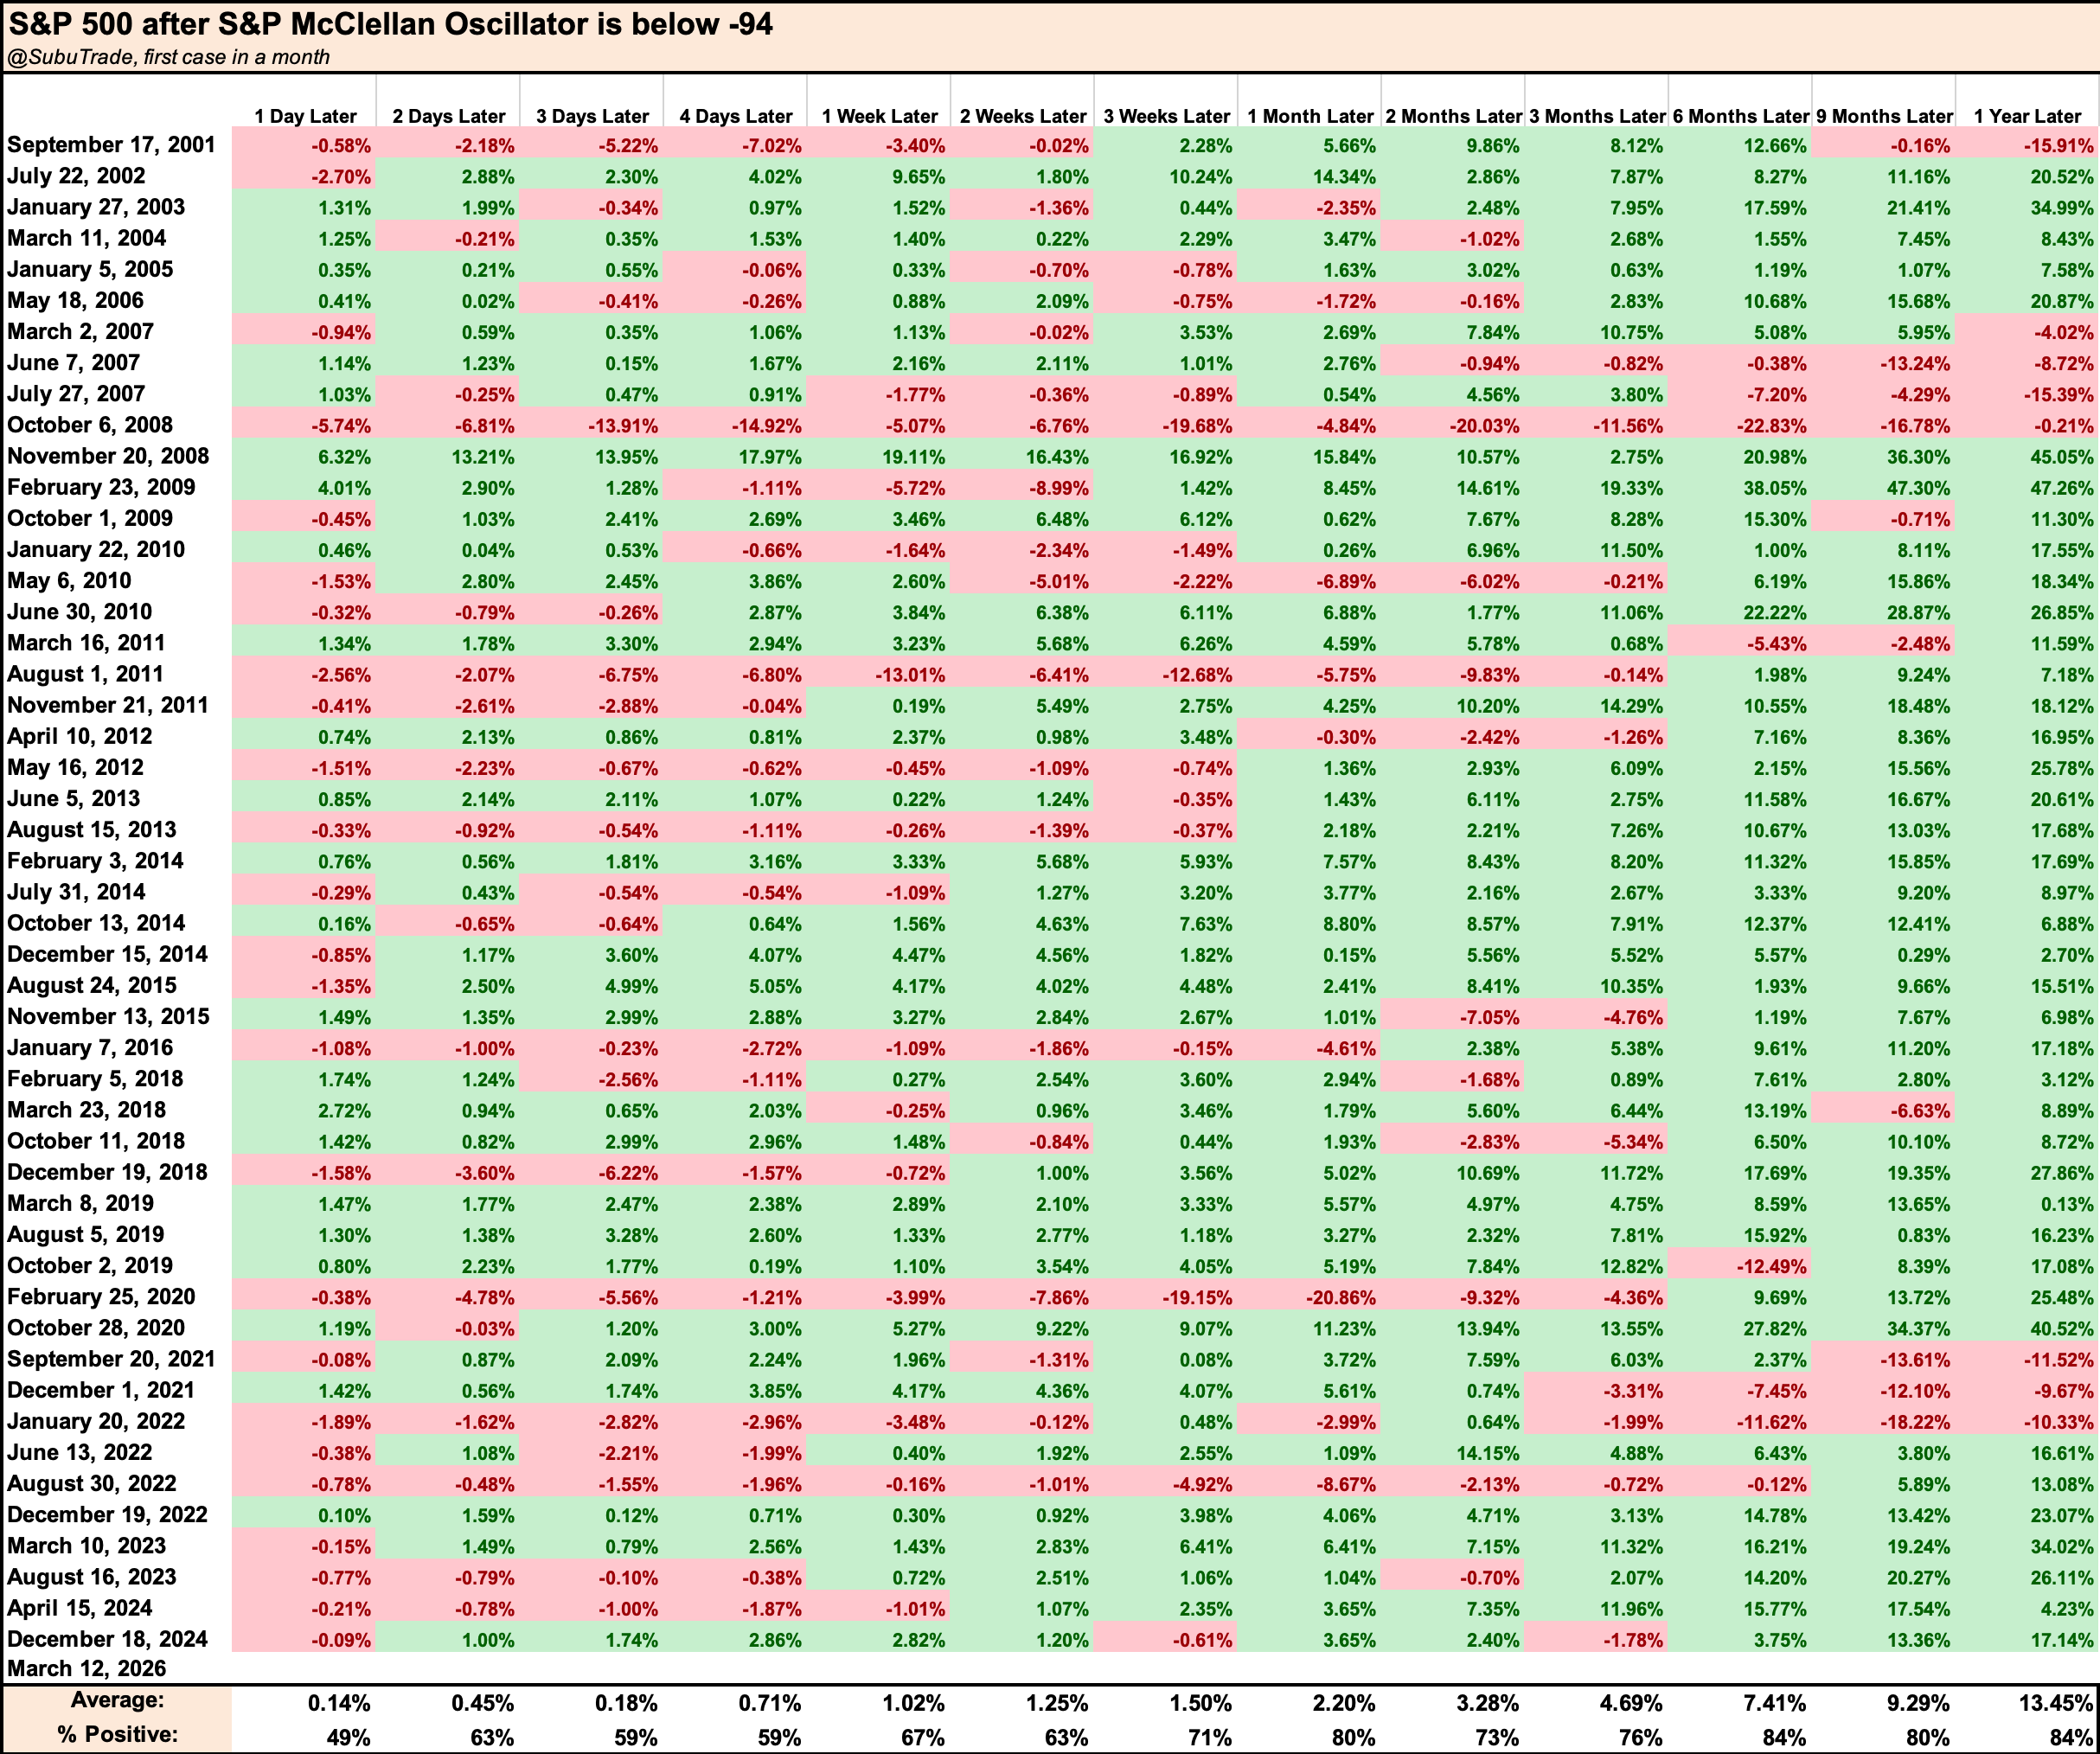
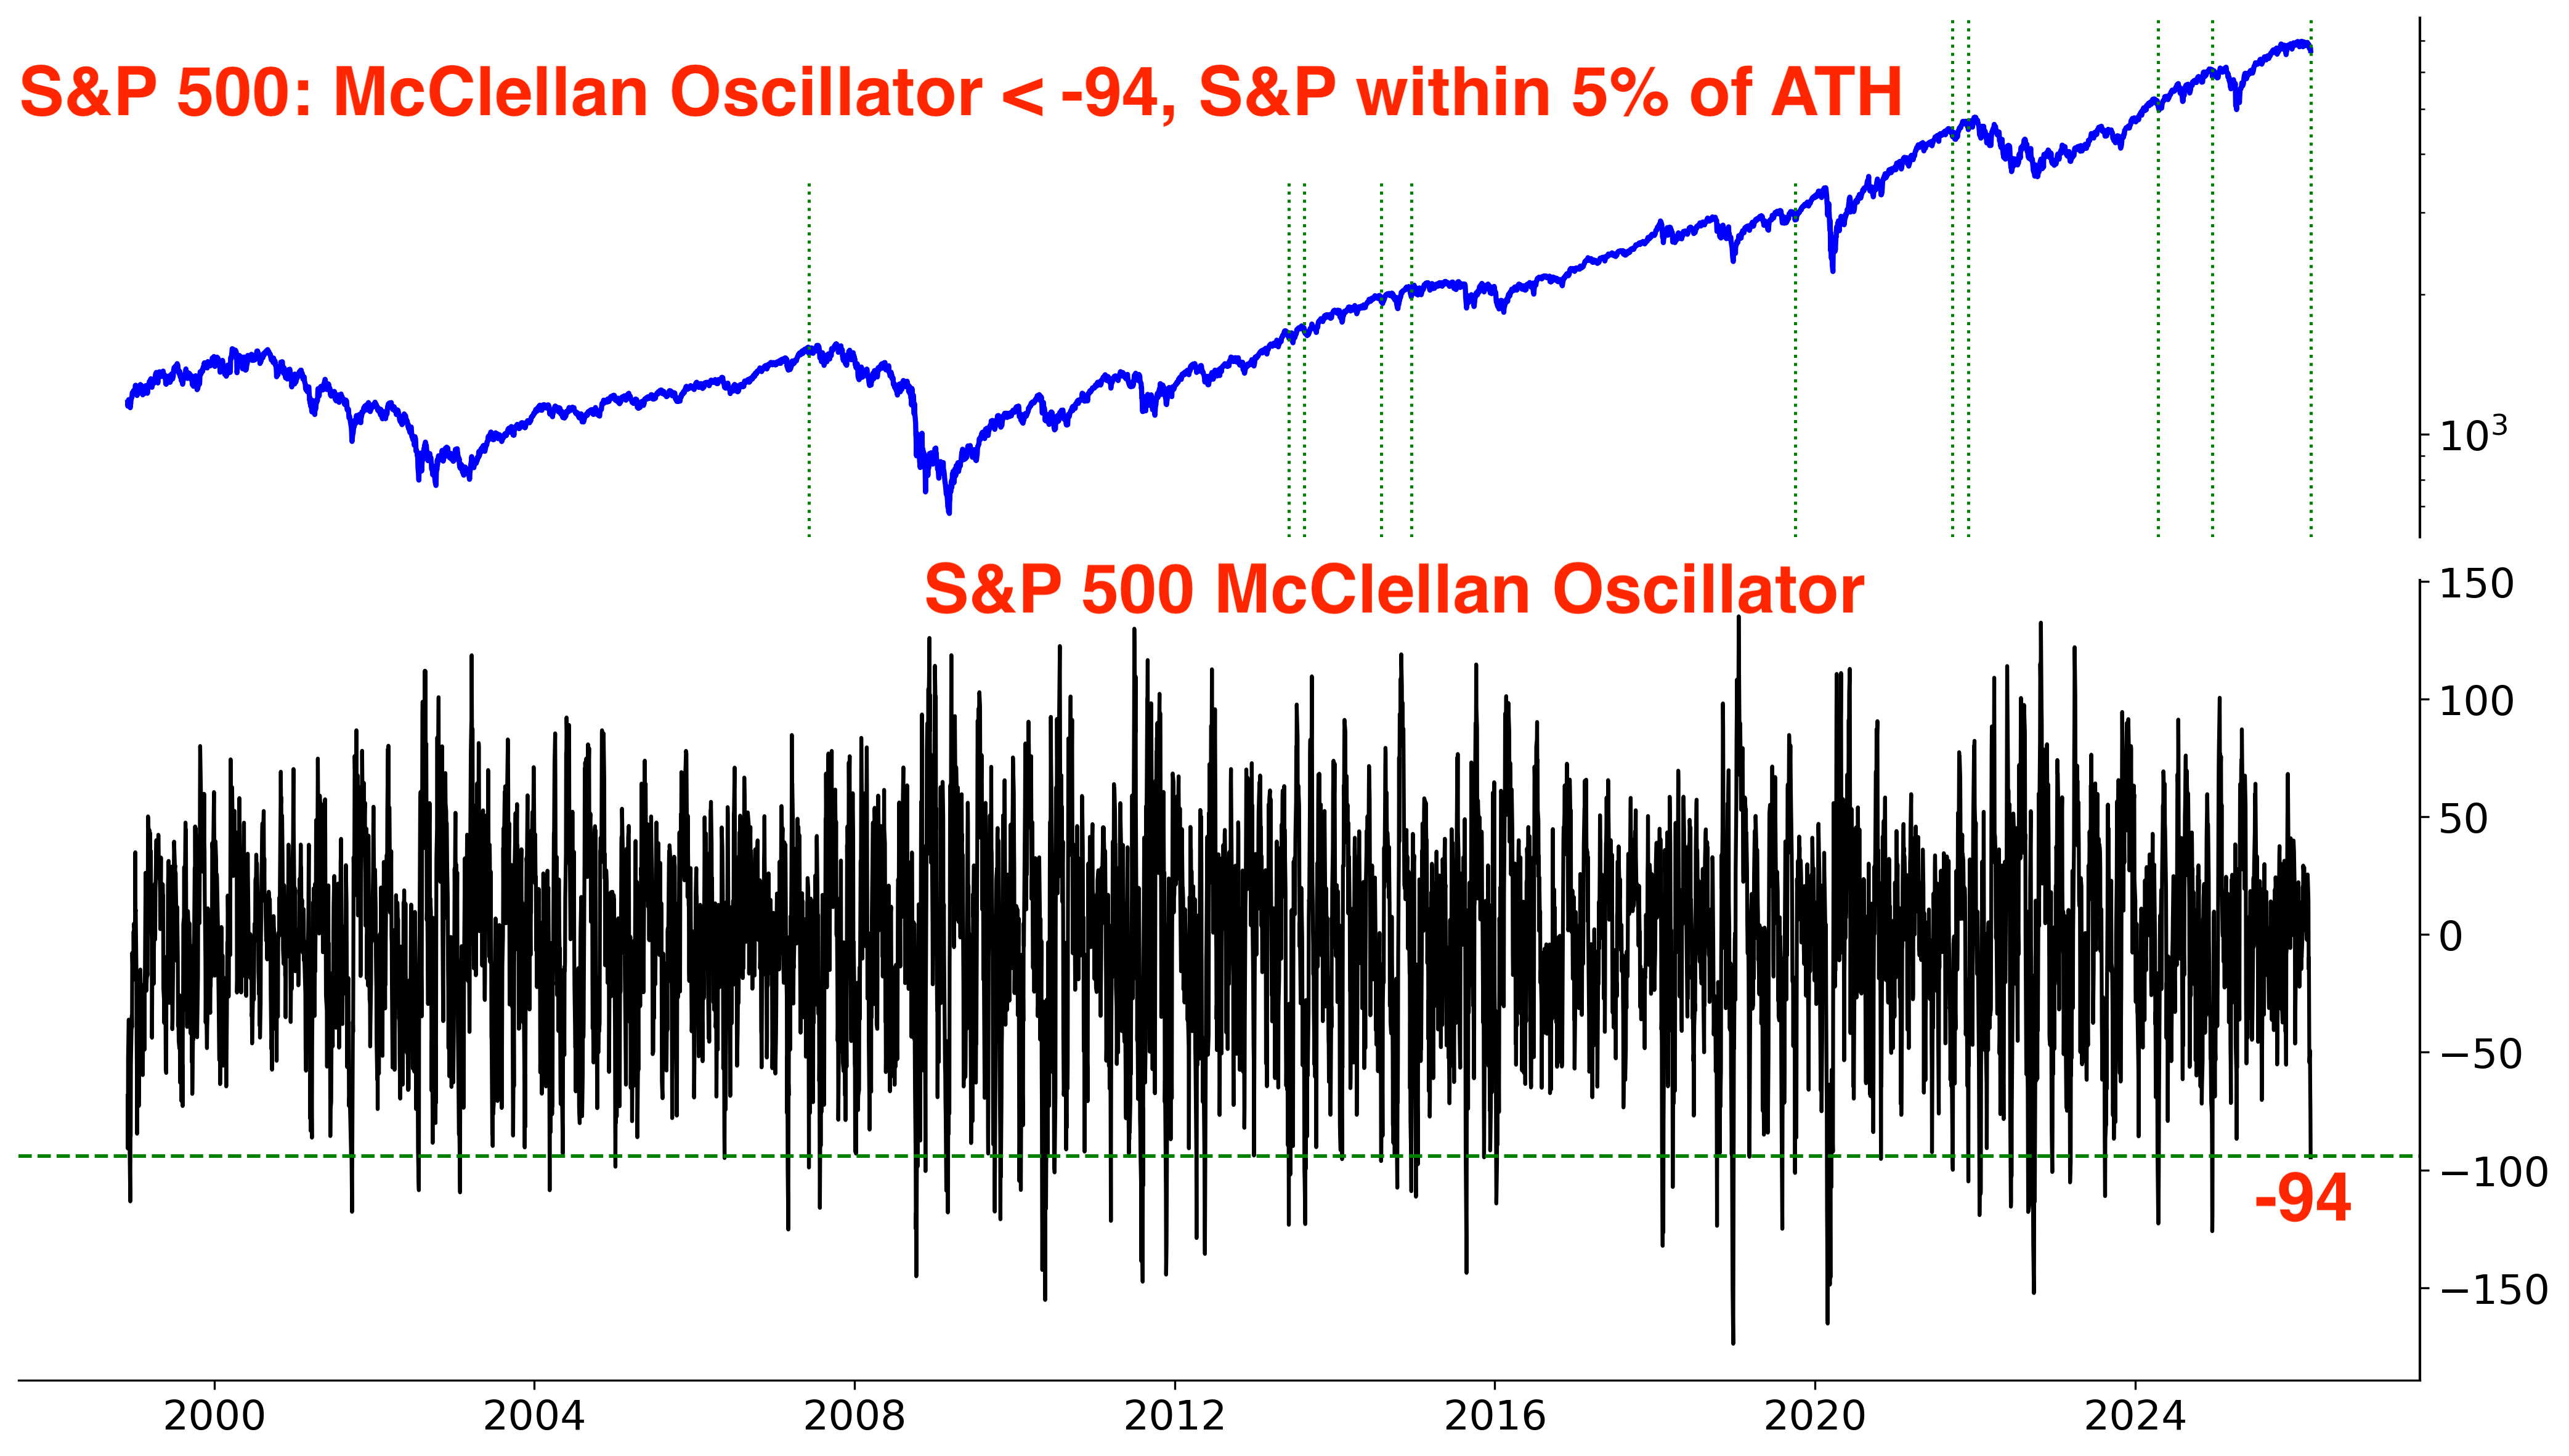
The S&P 500 McClellan Oscillator is below -94. Breadth is very oversold; even moreso than during last April’s Liberation Day crash:
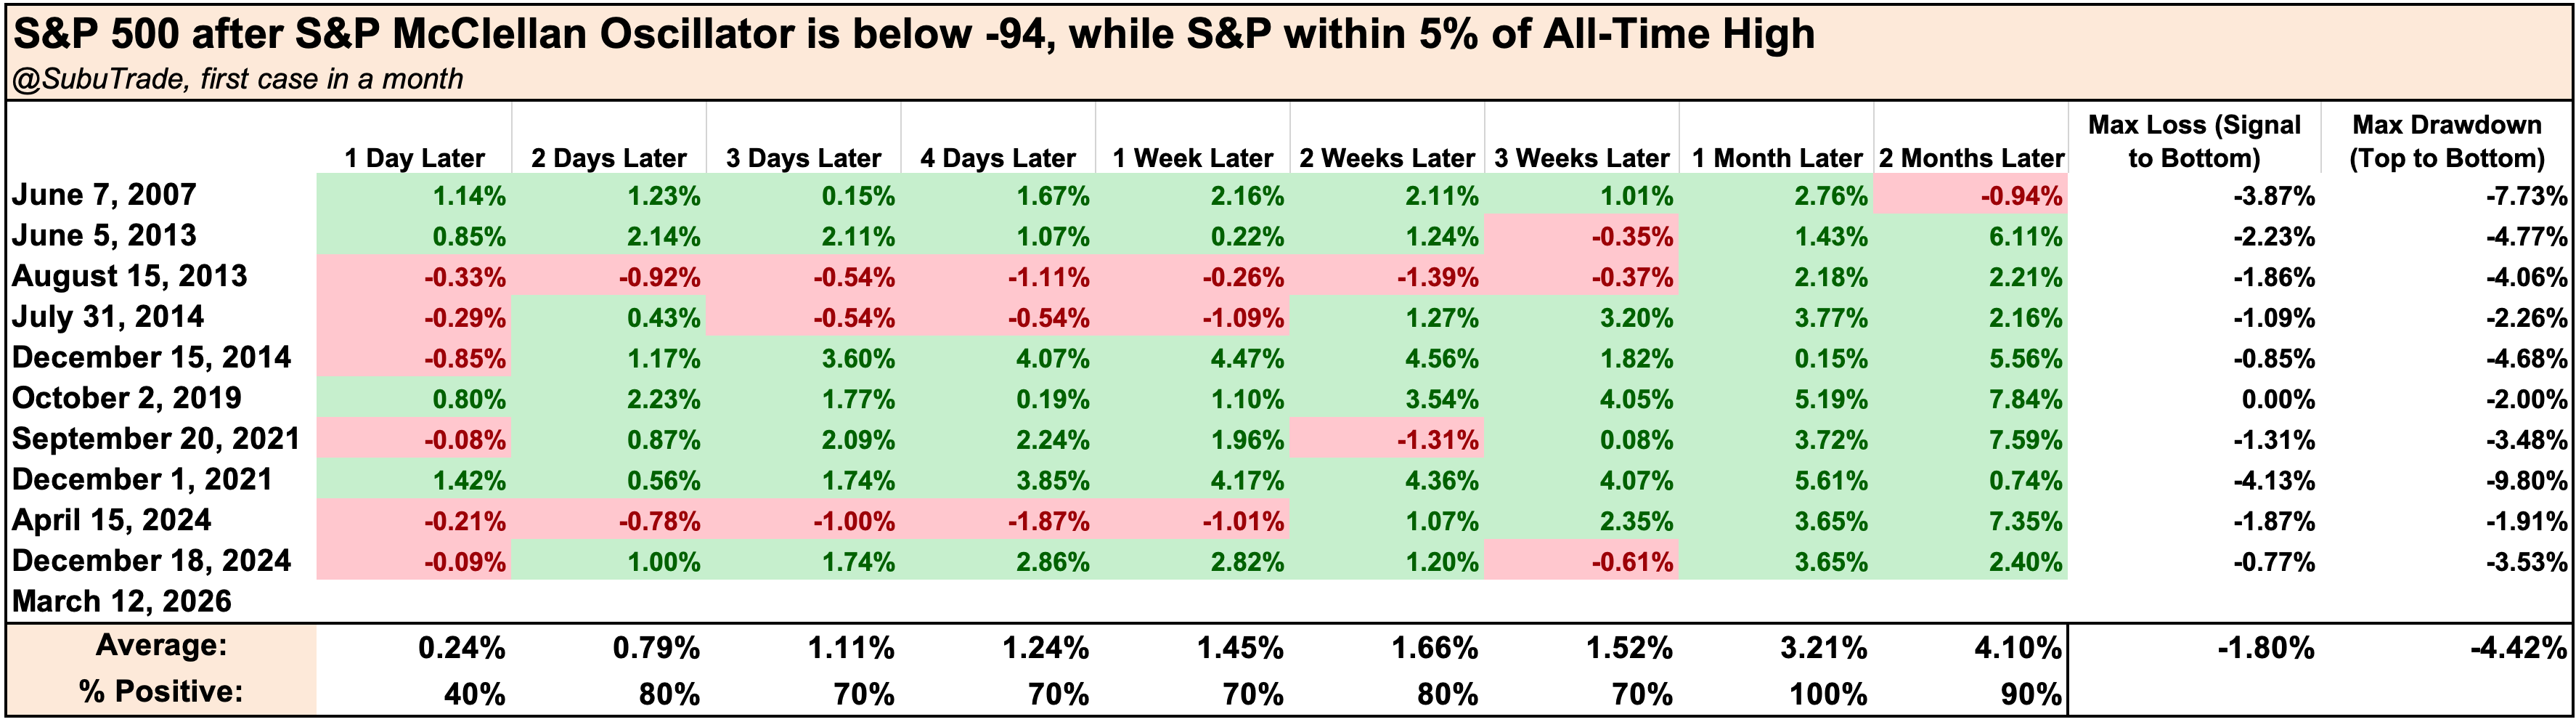
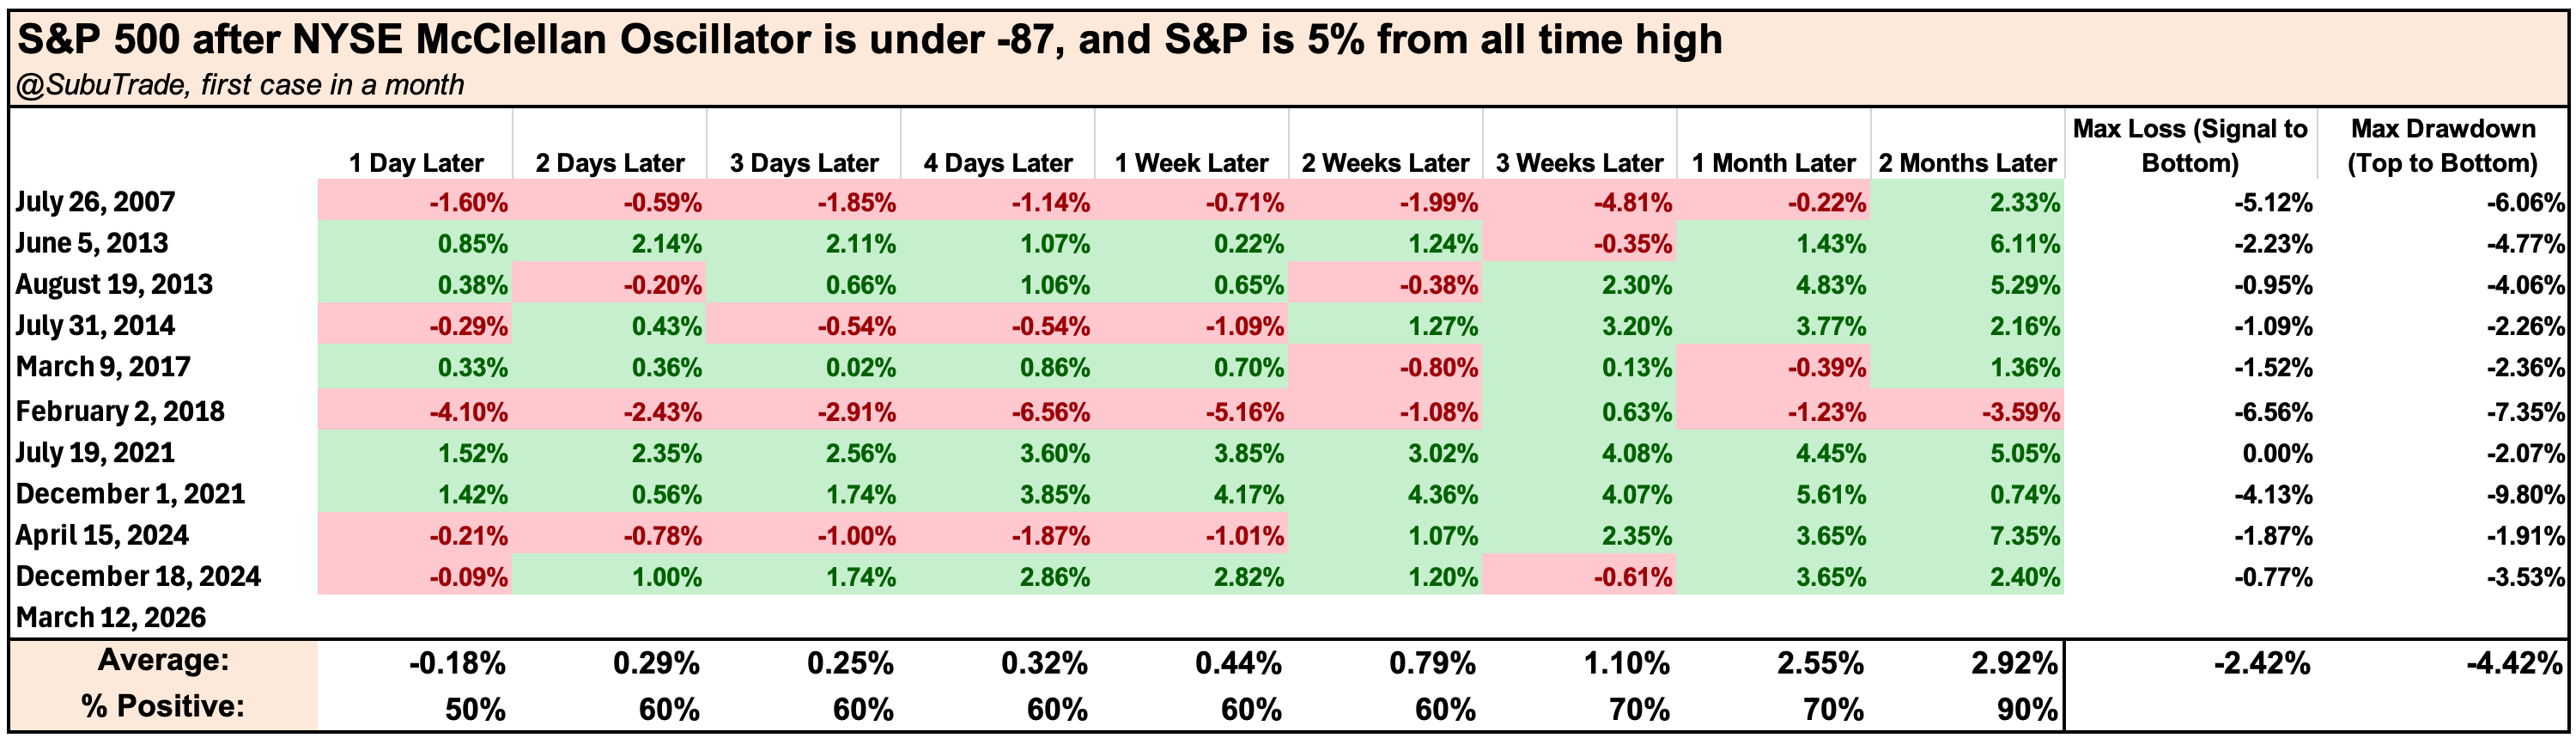
We can filter down for all cases within 5% of an All-Time High:
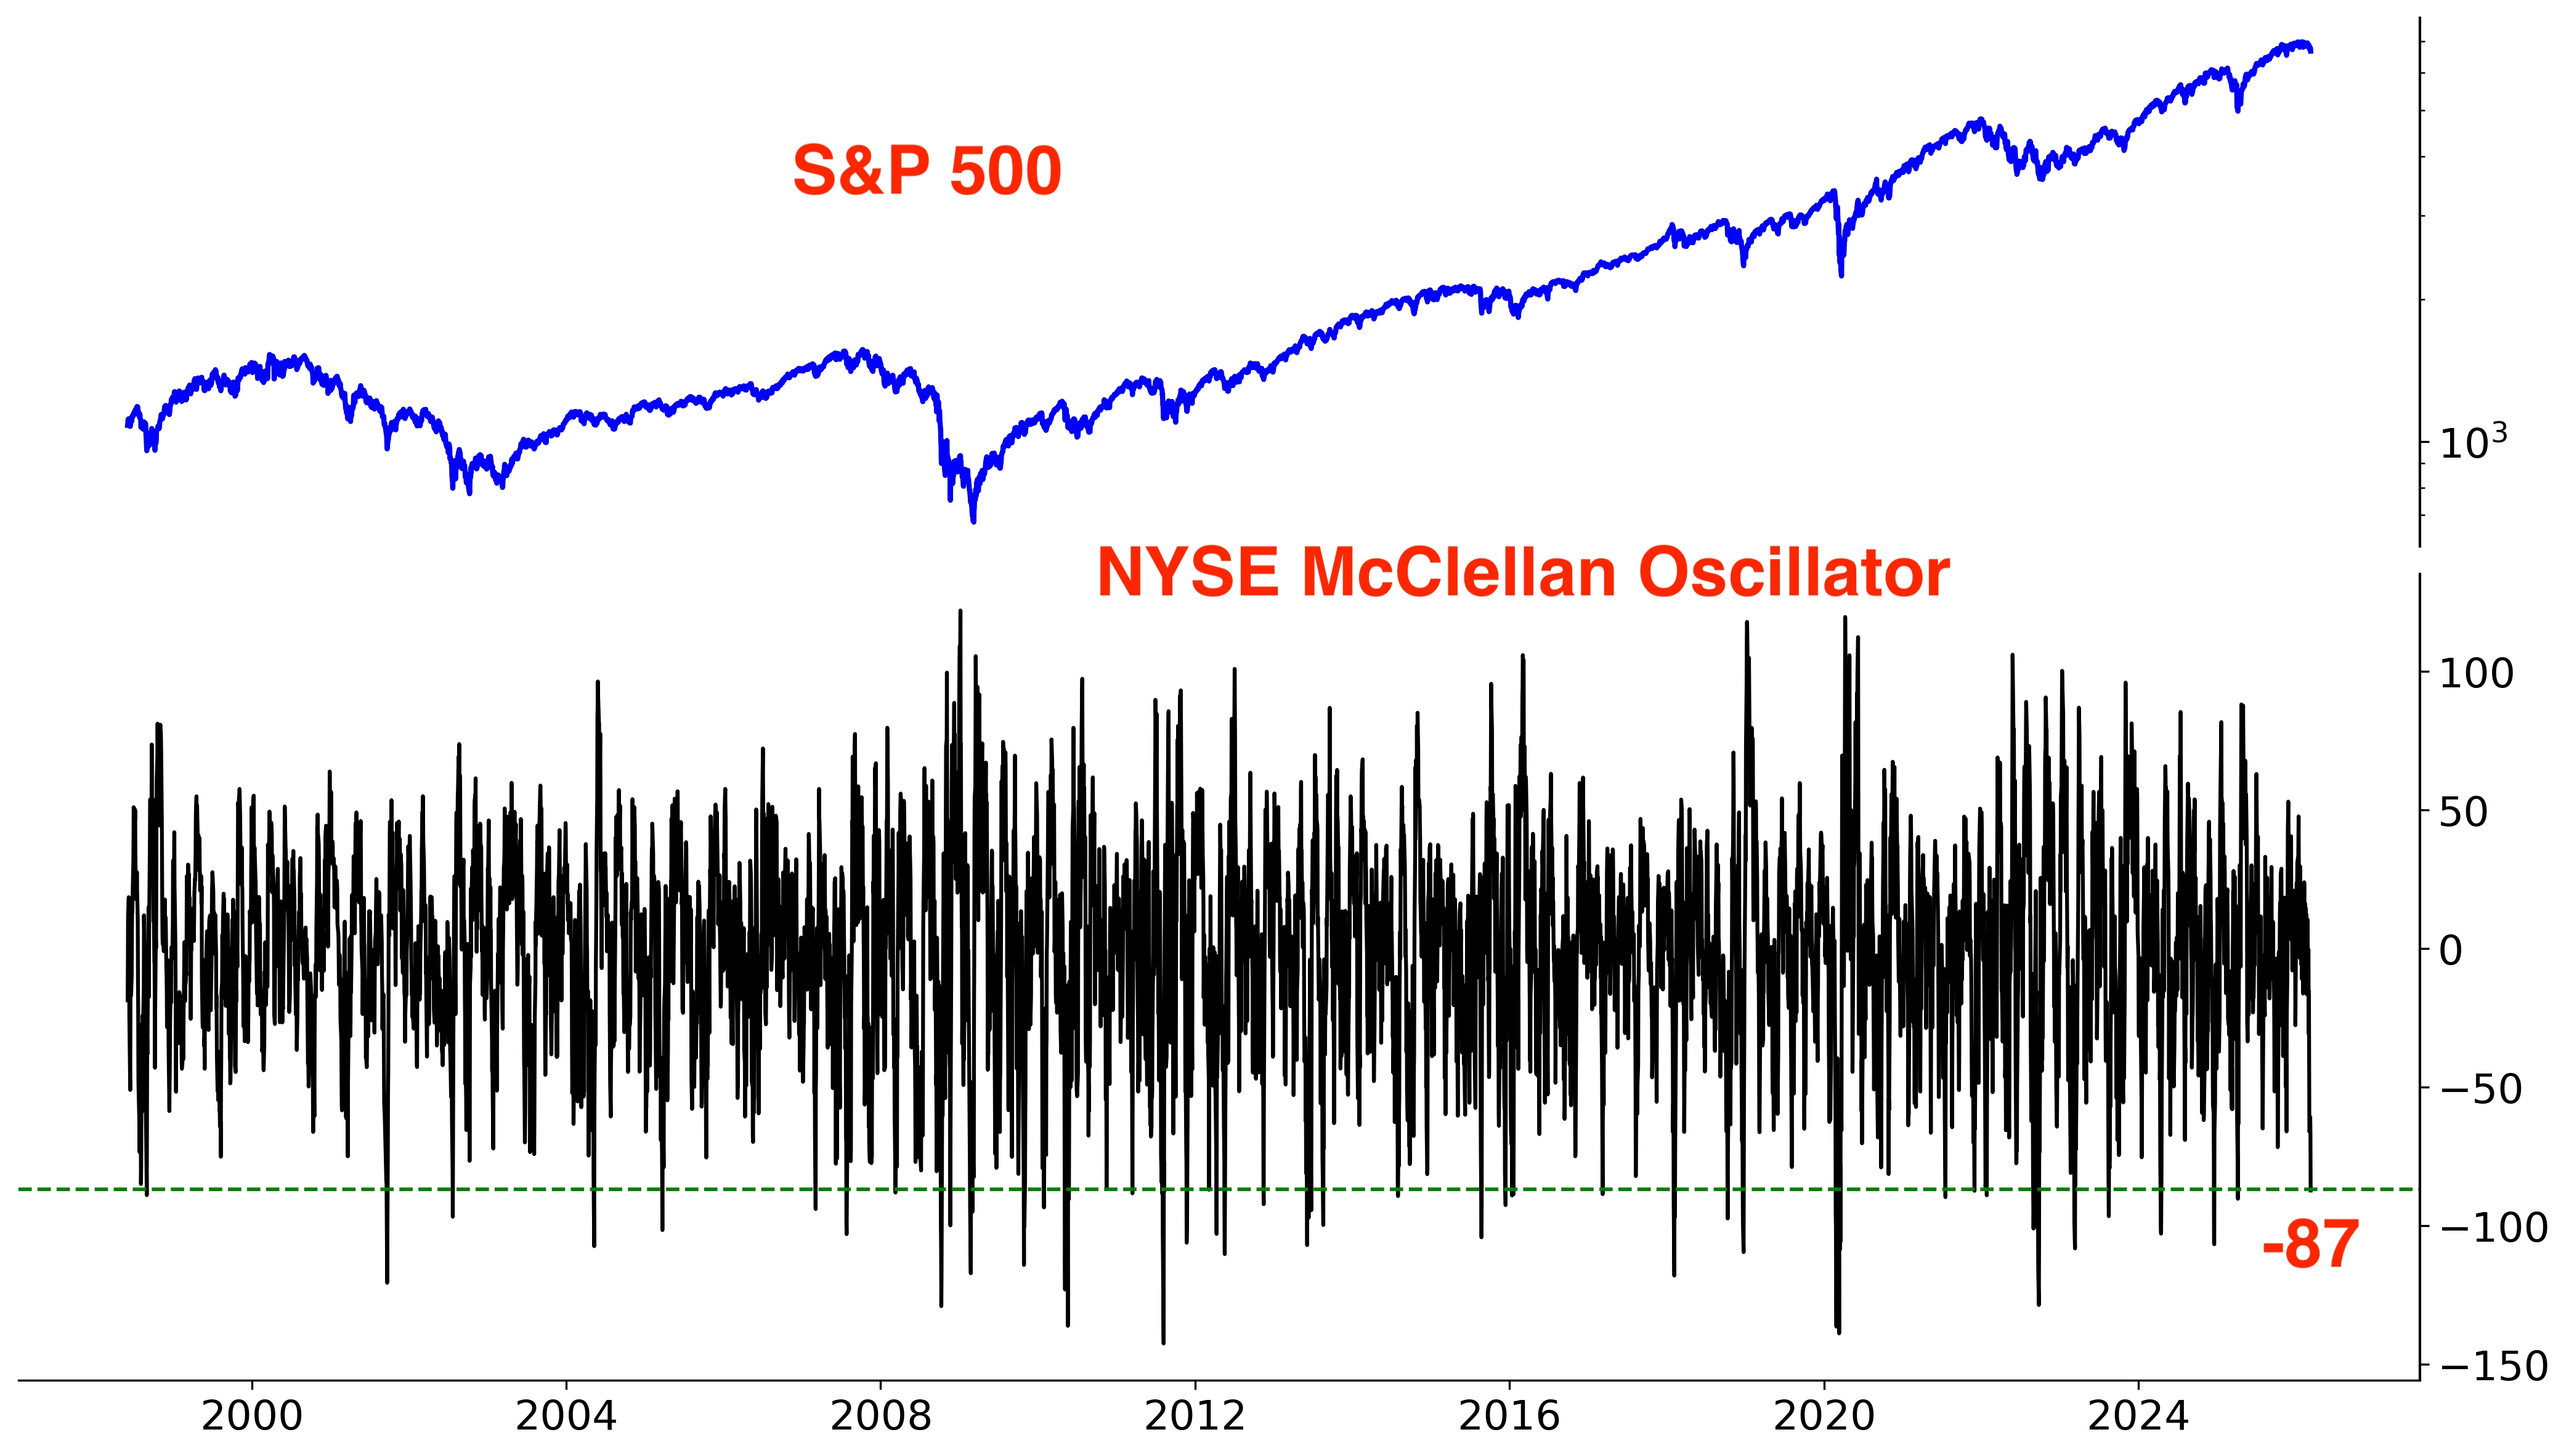
Similarly, the NYSE McClellan Oscillator is also very oversold:
Zweig Breadth Thrust Indicator
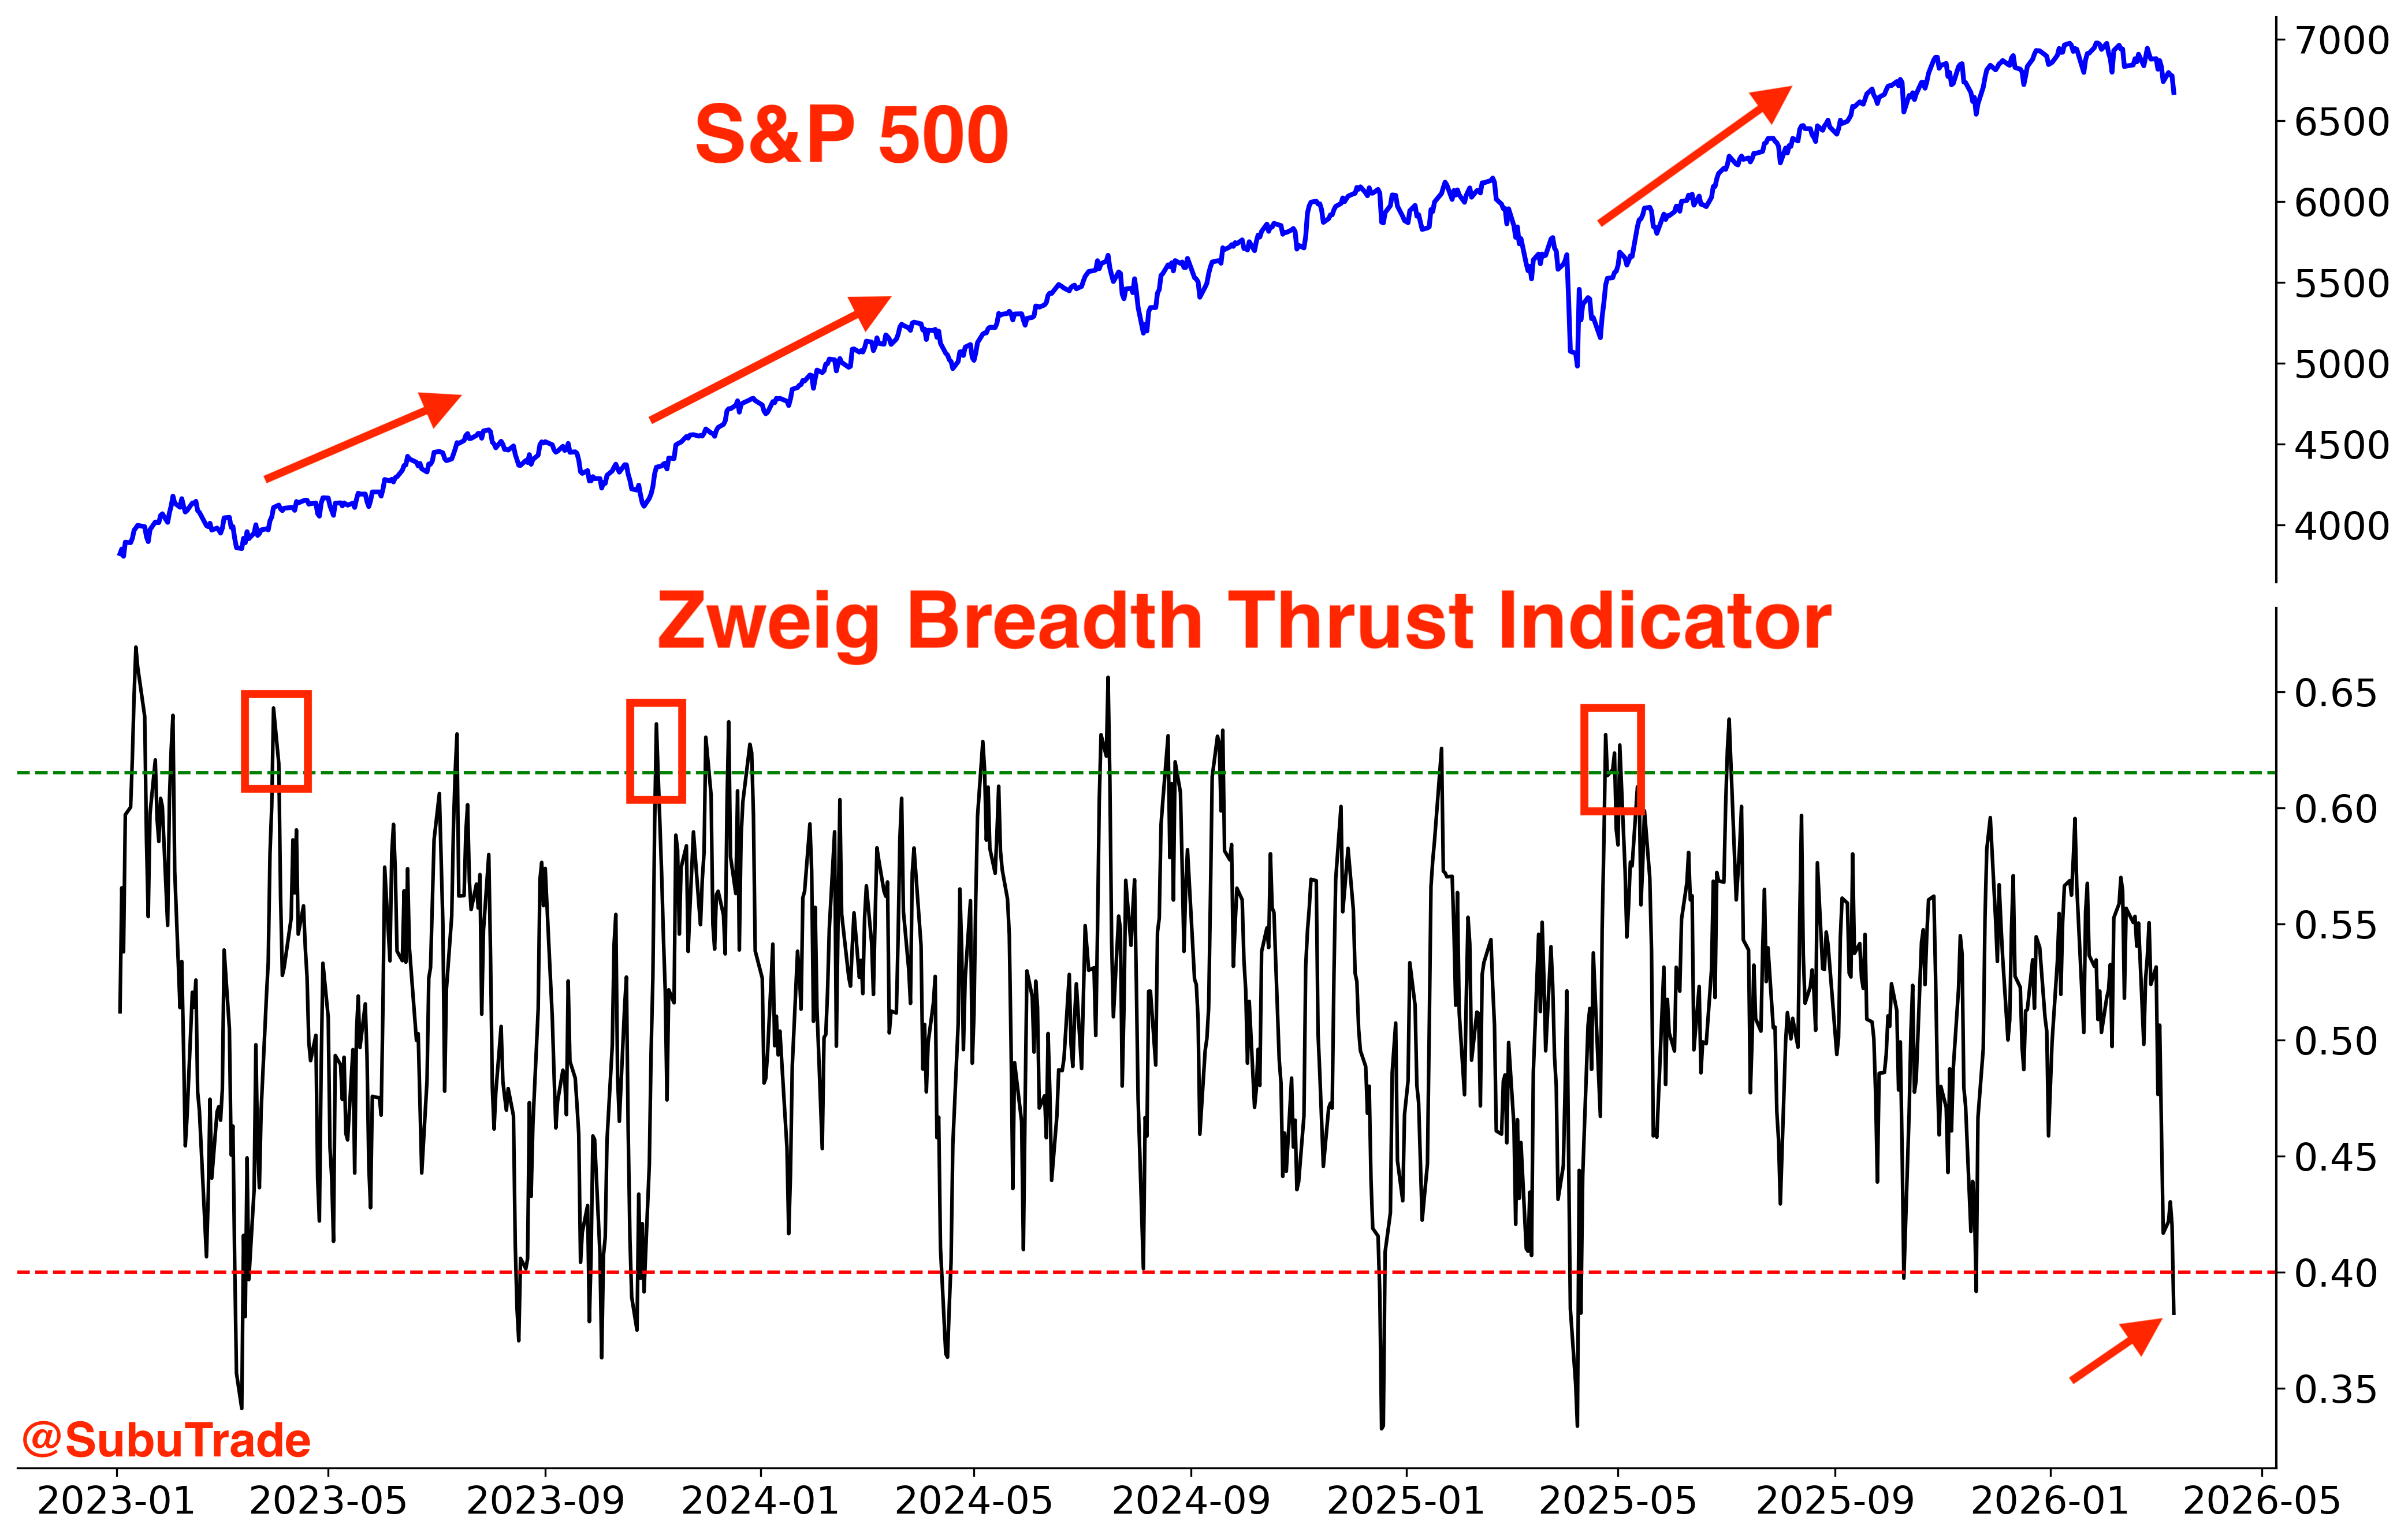
Such oversold breadth has created the setup for a POTENTIAL Zweig Breadth Thrust. There is no guarantee that we will get a Zweig Breadth Thrust - most potential ZBT’s fail to materialize:
Sentiment
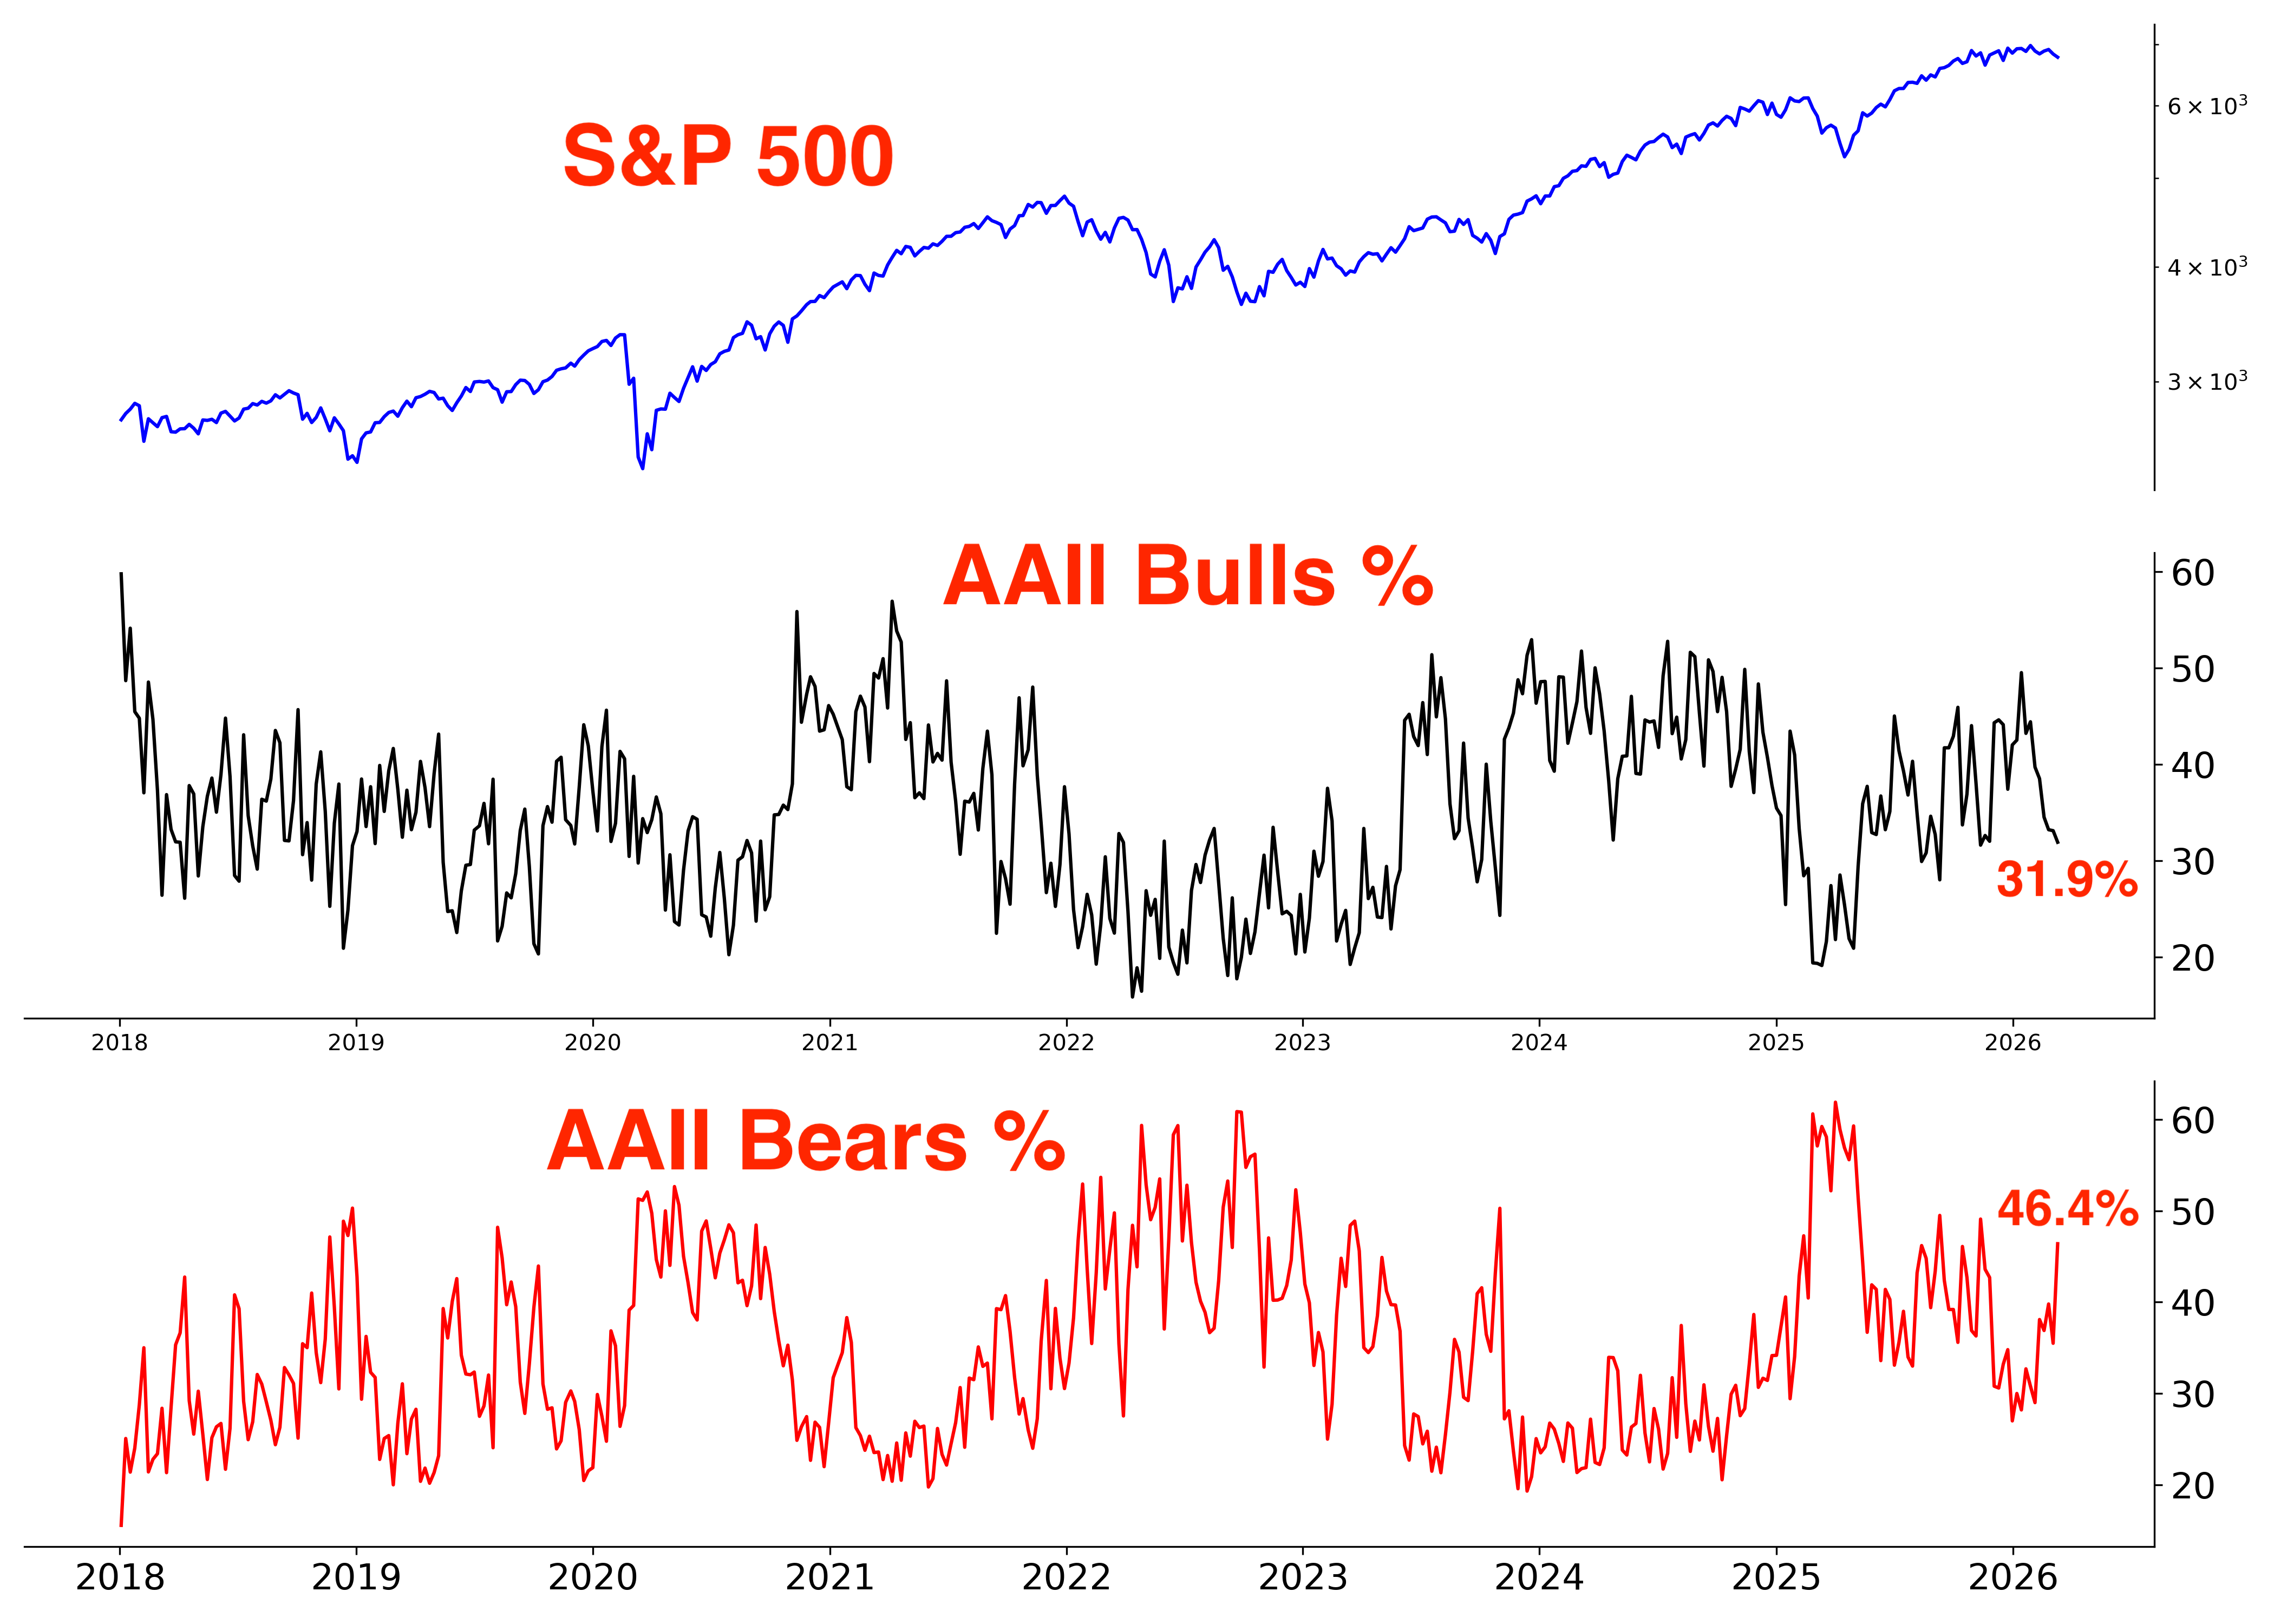
Sentiment is coming down. This is no surprise - sentiment mostly follows price. Price down = sentiment down, price up = sentiment up.
AAII:
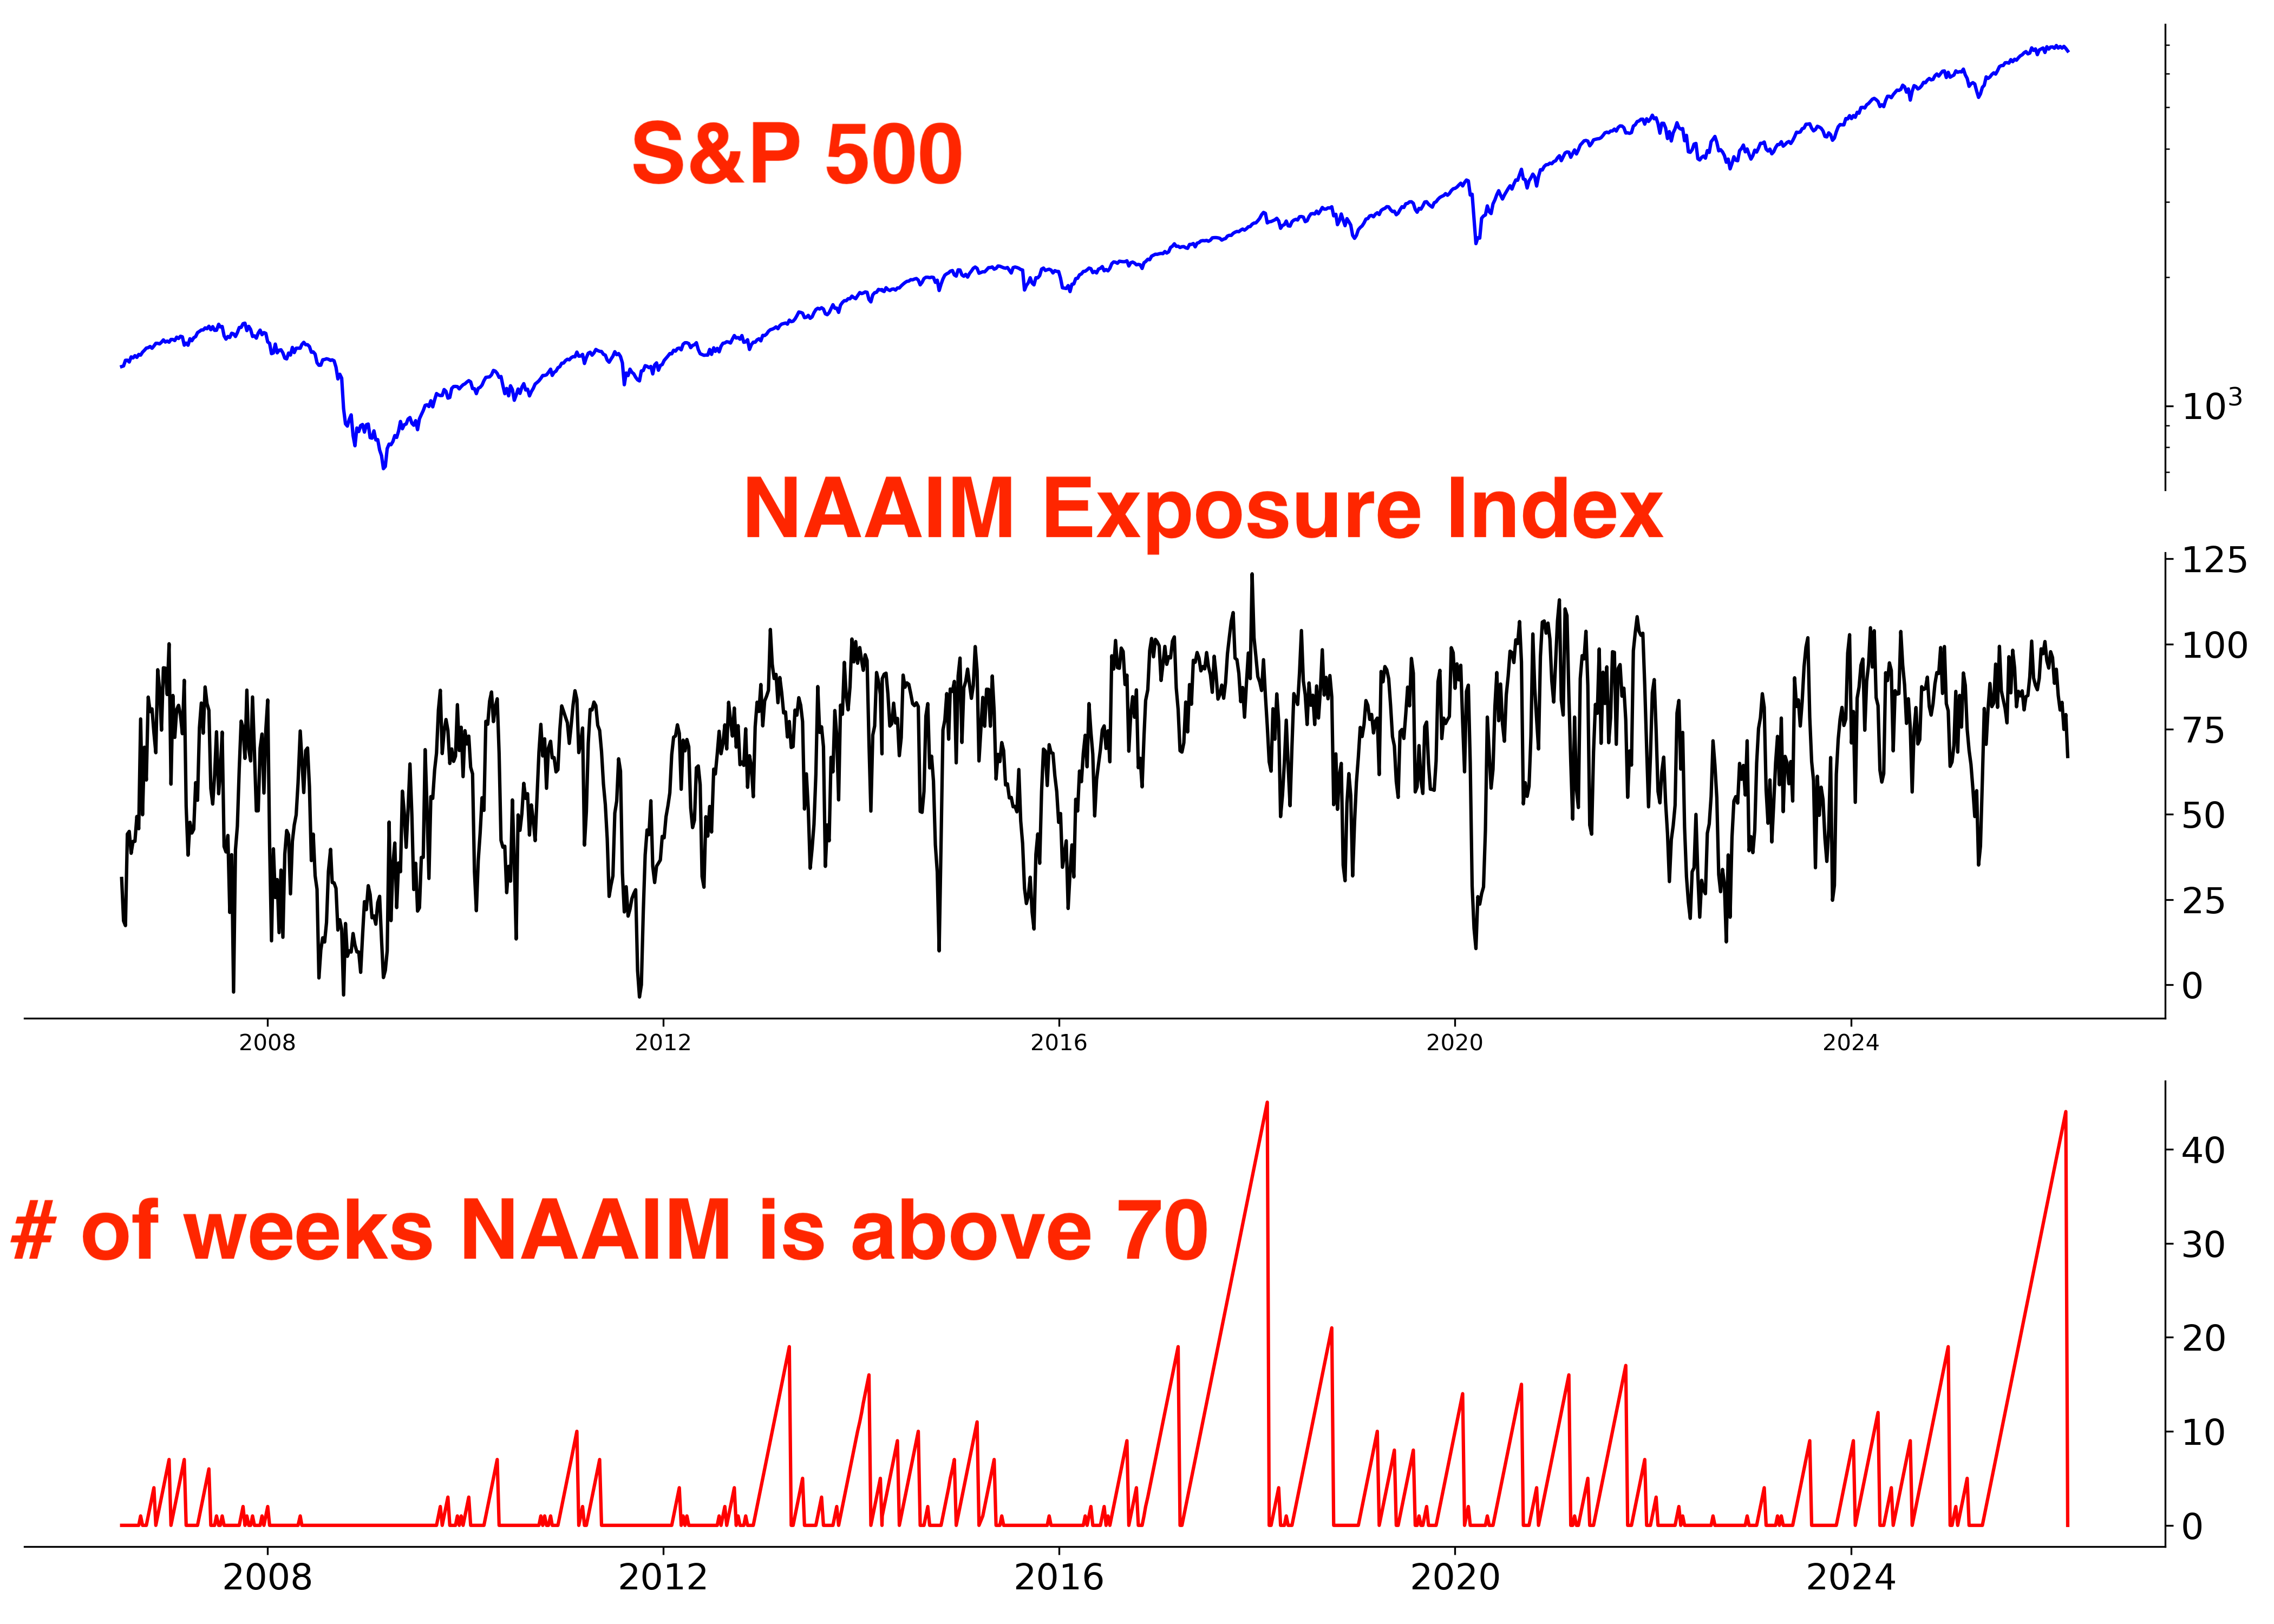
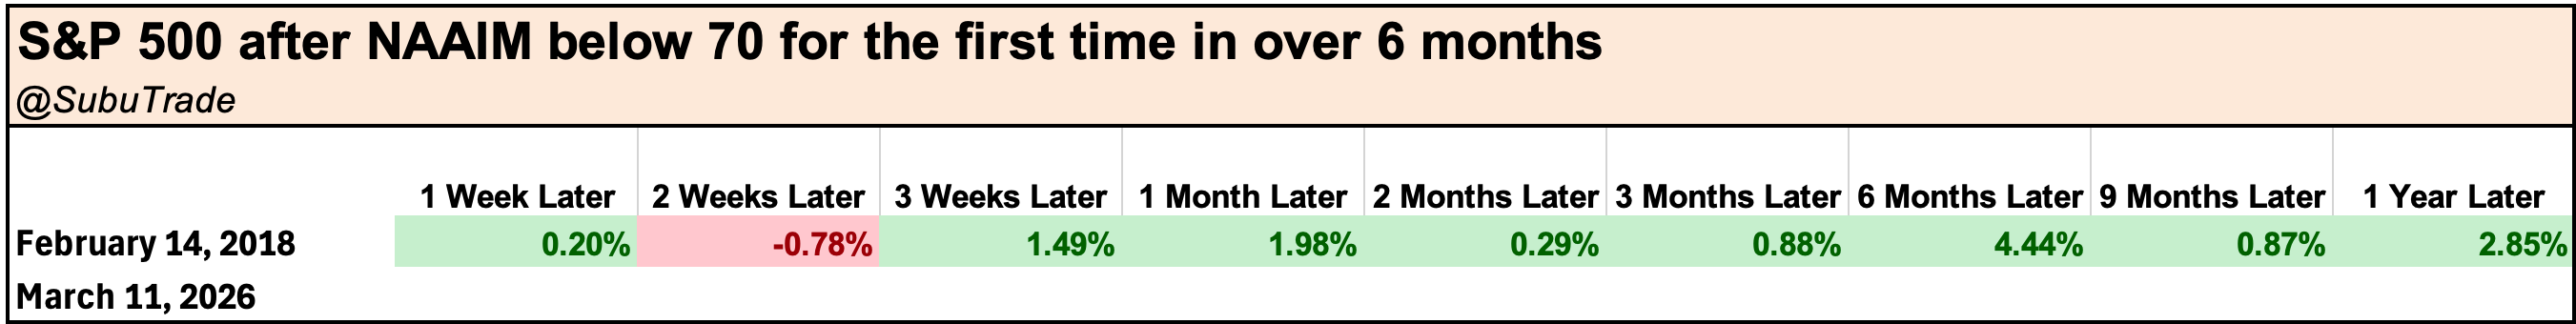
NAAIM Exposure Index:
Seasonality
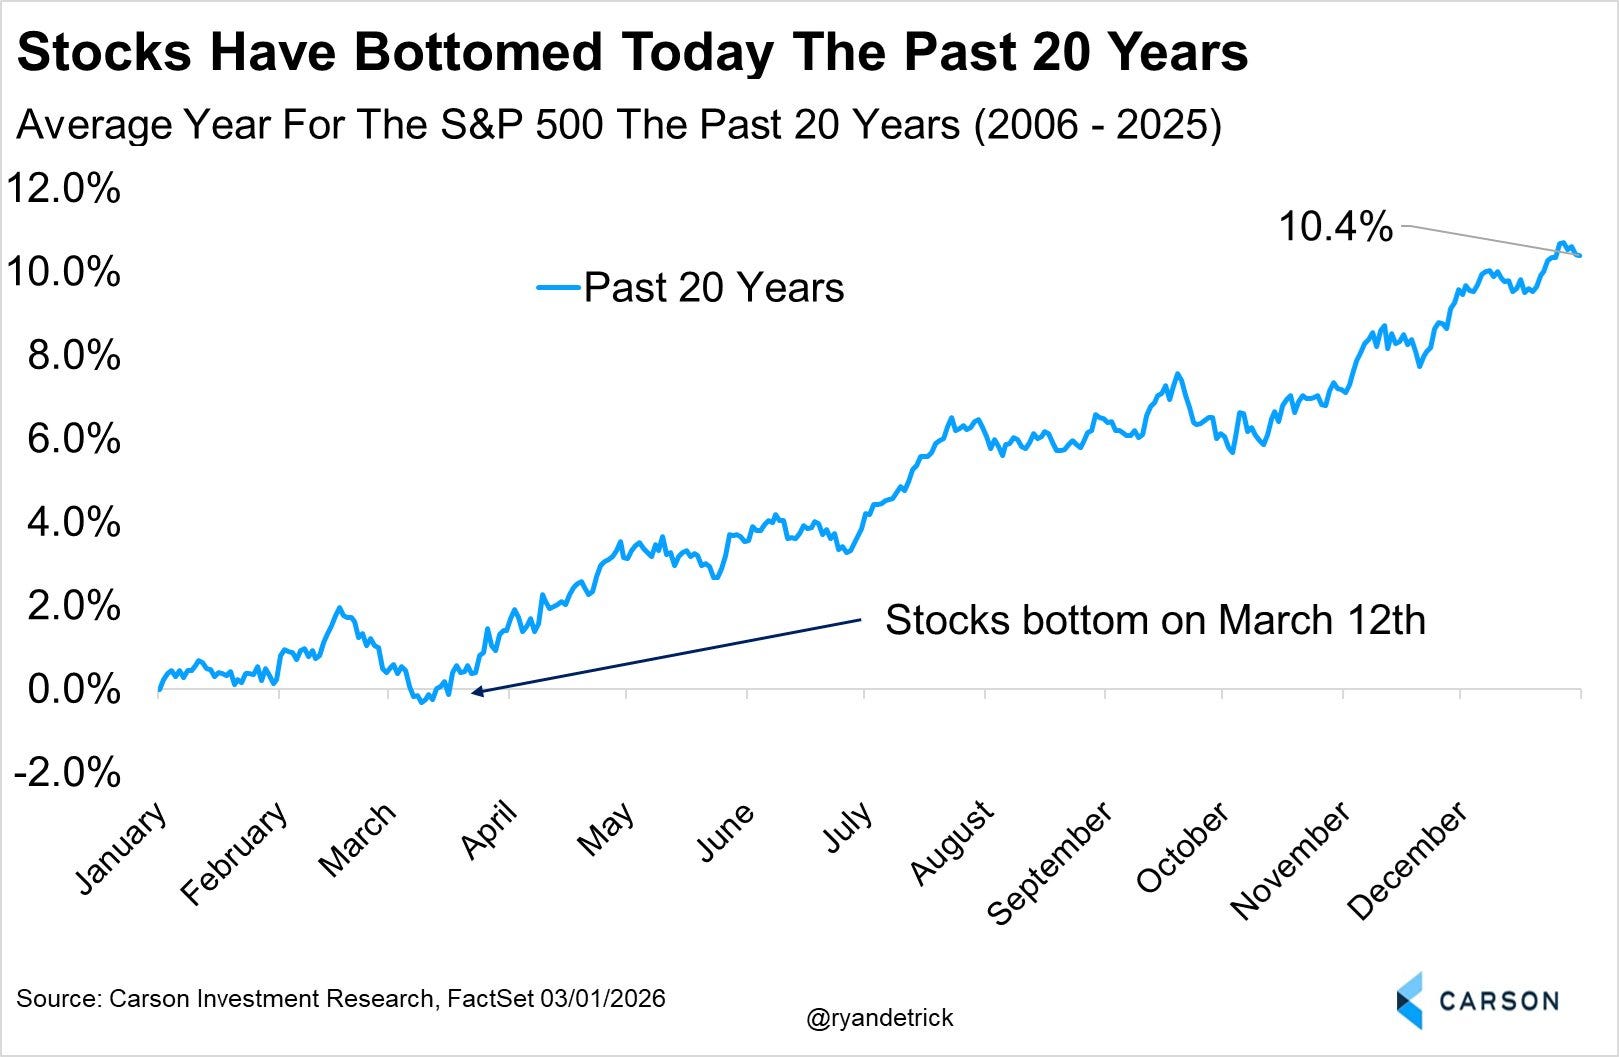
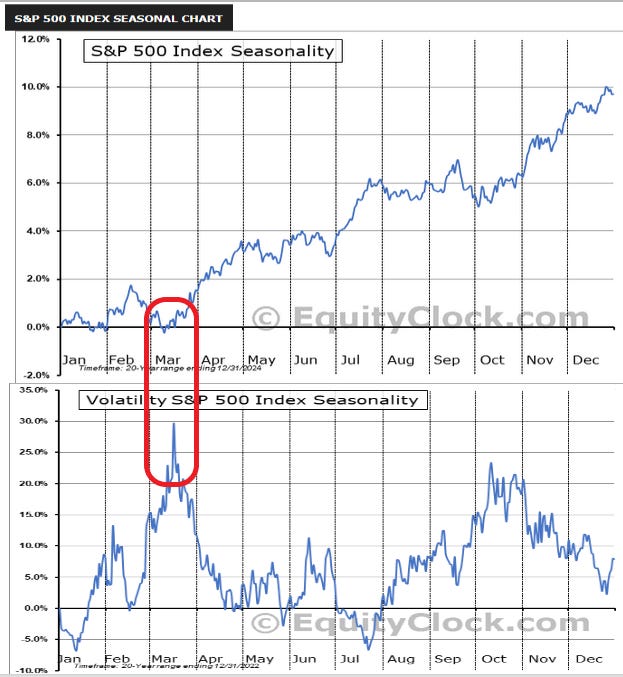
Seasonality is supposedly turning bullish. I am not a fan of seasonality: of all the indicators you can possibly look at, seasonality is the LEAST useful. In my opinion, most of seasonality is just an extreme case of data mining and has little predictive use.
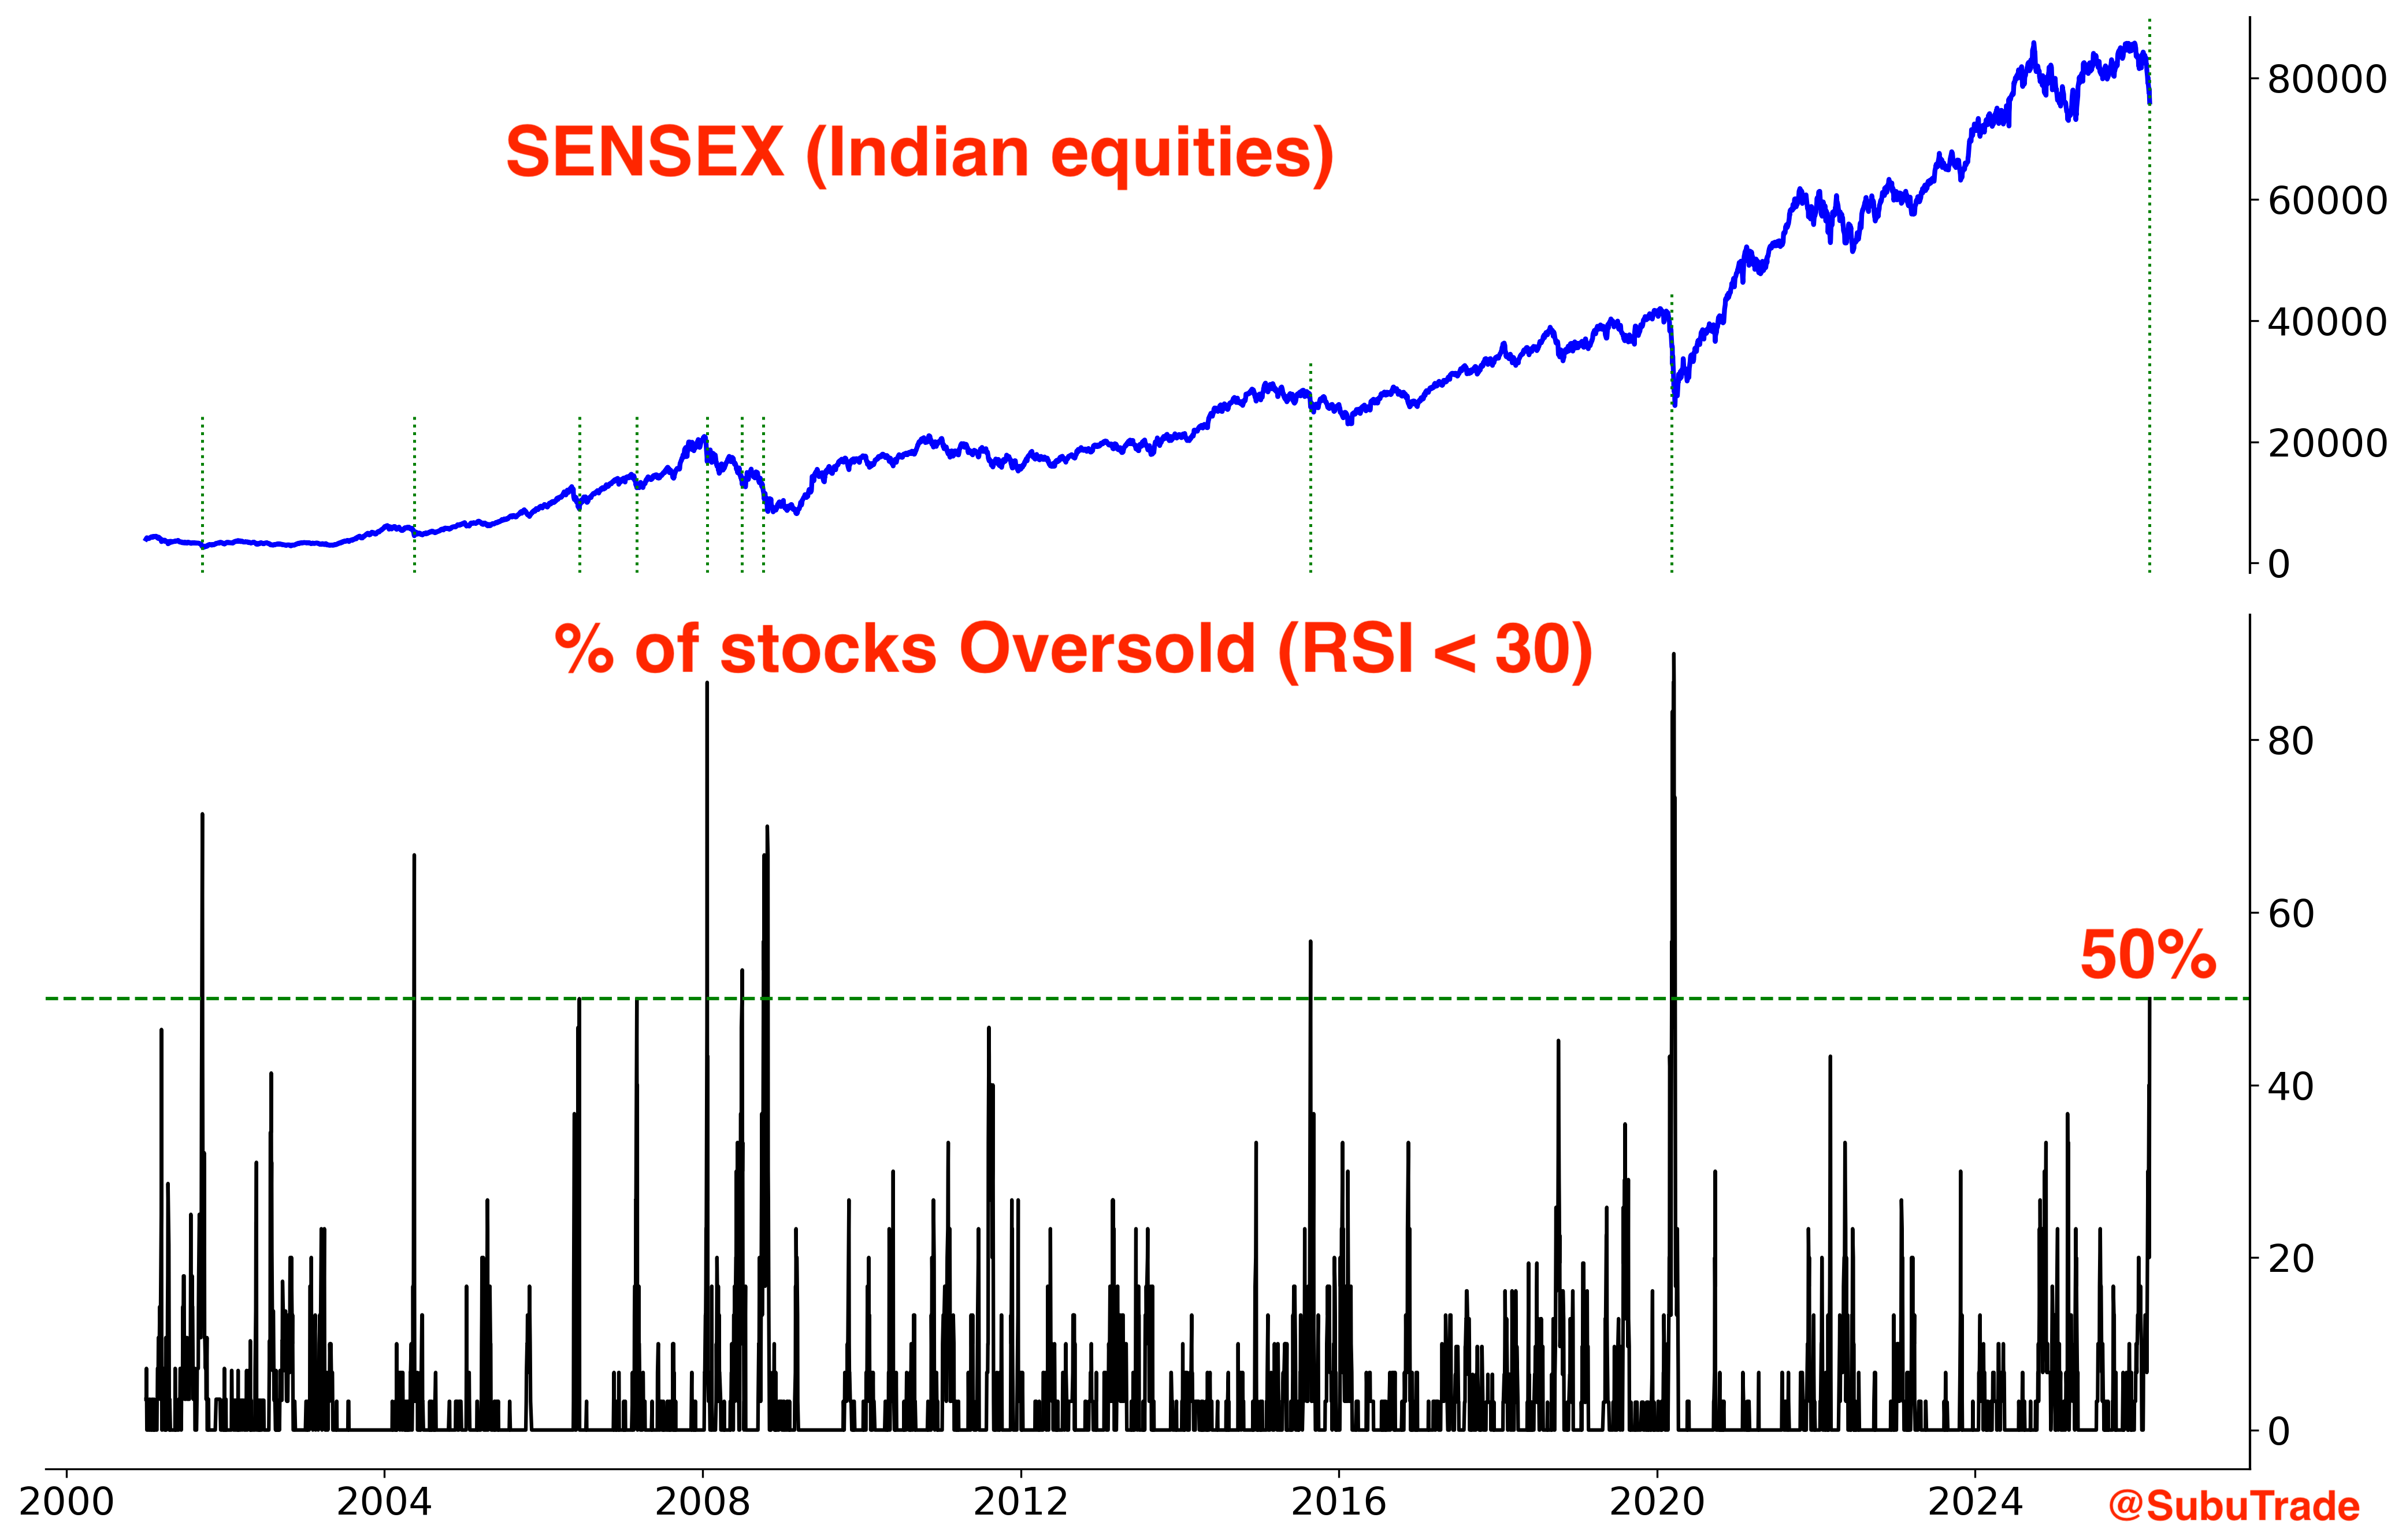
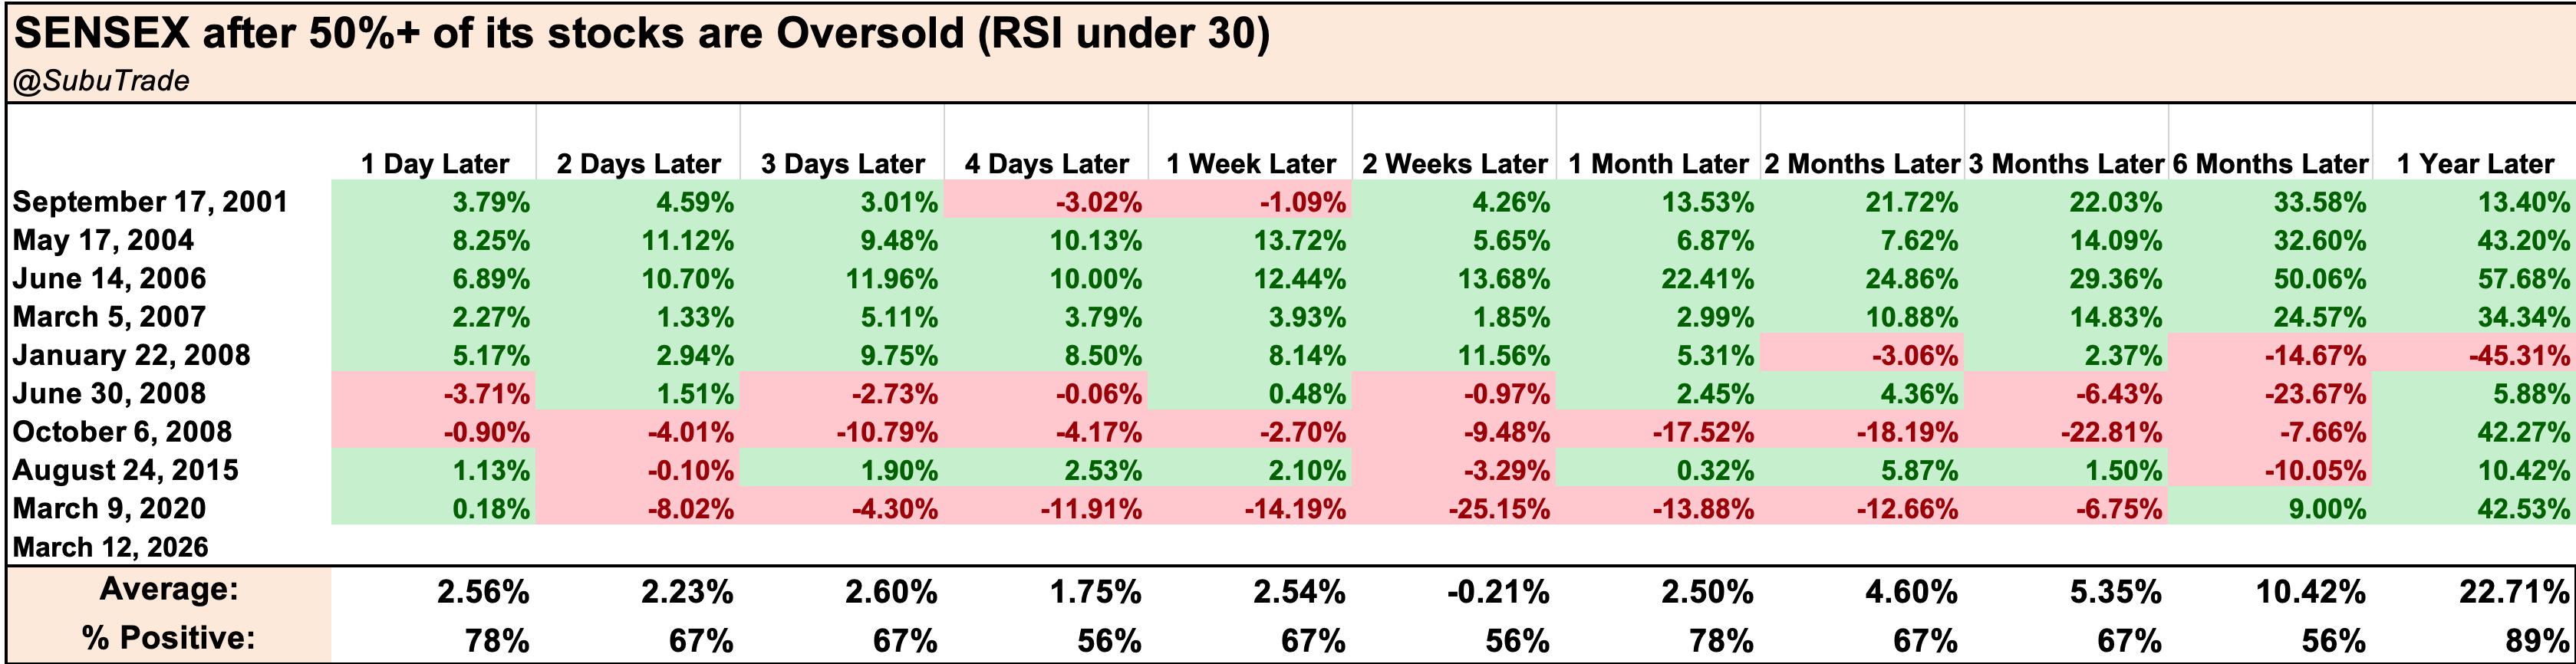
Indian equities
Indian equities have taken a hit from the Iran war. Half of SENSEX stocks are now oversold (RSI under 30):
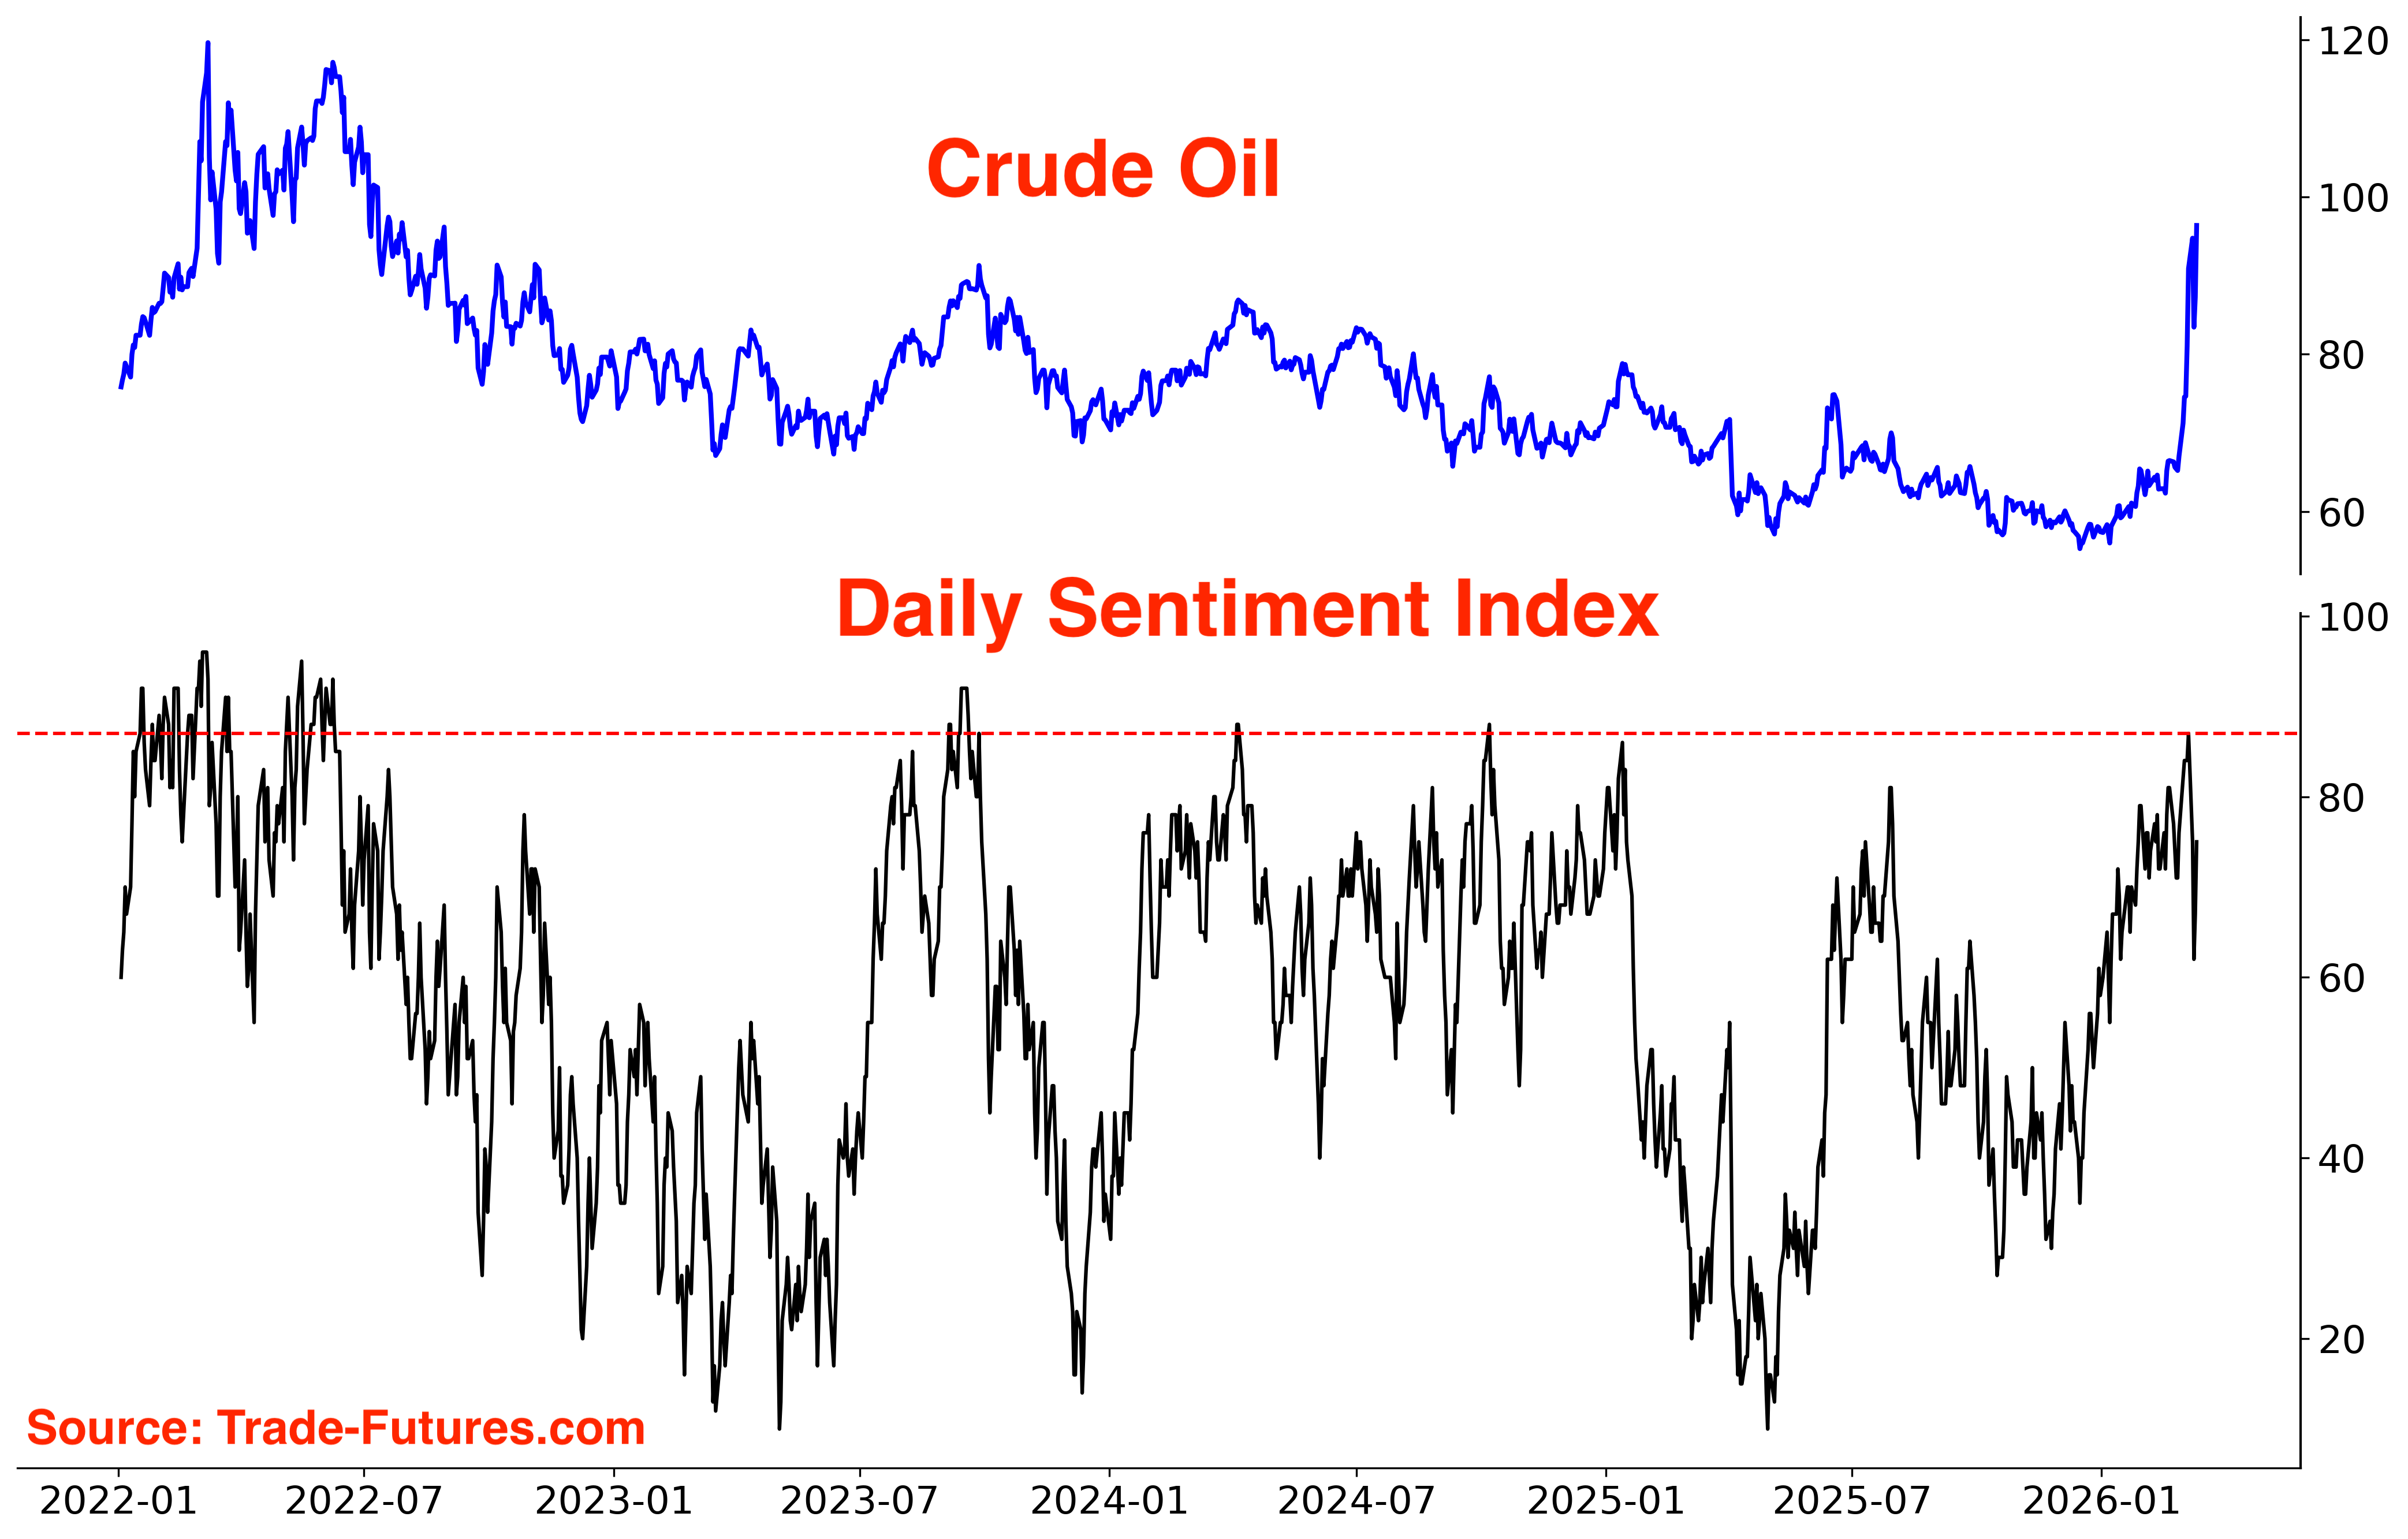
Crude Oil
Oil spiked, and everyone expects it to come back down (just look at the Term Structure). Crude Oil’s Daily Sentiment Index spiked along with price: