
Calm Index, Chaotic Market: Rotate Again?
How we got here vs. Where we're going

Markets are inherently probabilistic and the future is never certain. We can only think in terms of scenarios and odds. In this report, I’ll walk through the most likely forward paths and assign rough probability weightings to each. But before we look at Where we’re going, we need to first examine How we got here.
How we got here
After the Liberation Day lows, equities rallied almost nonstop from April-October, with barely a meaningful pullback. Investors initially dumped equities on tariff fears, then quickly bought back what they had dumped once Trump’s “TACO” narrative took hold.
The relentless bid is demonstrated via massive inflows into the 10 largest equity ETFs.
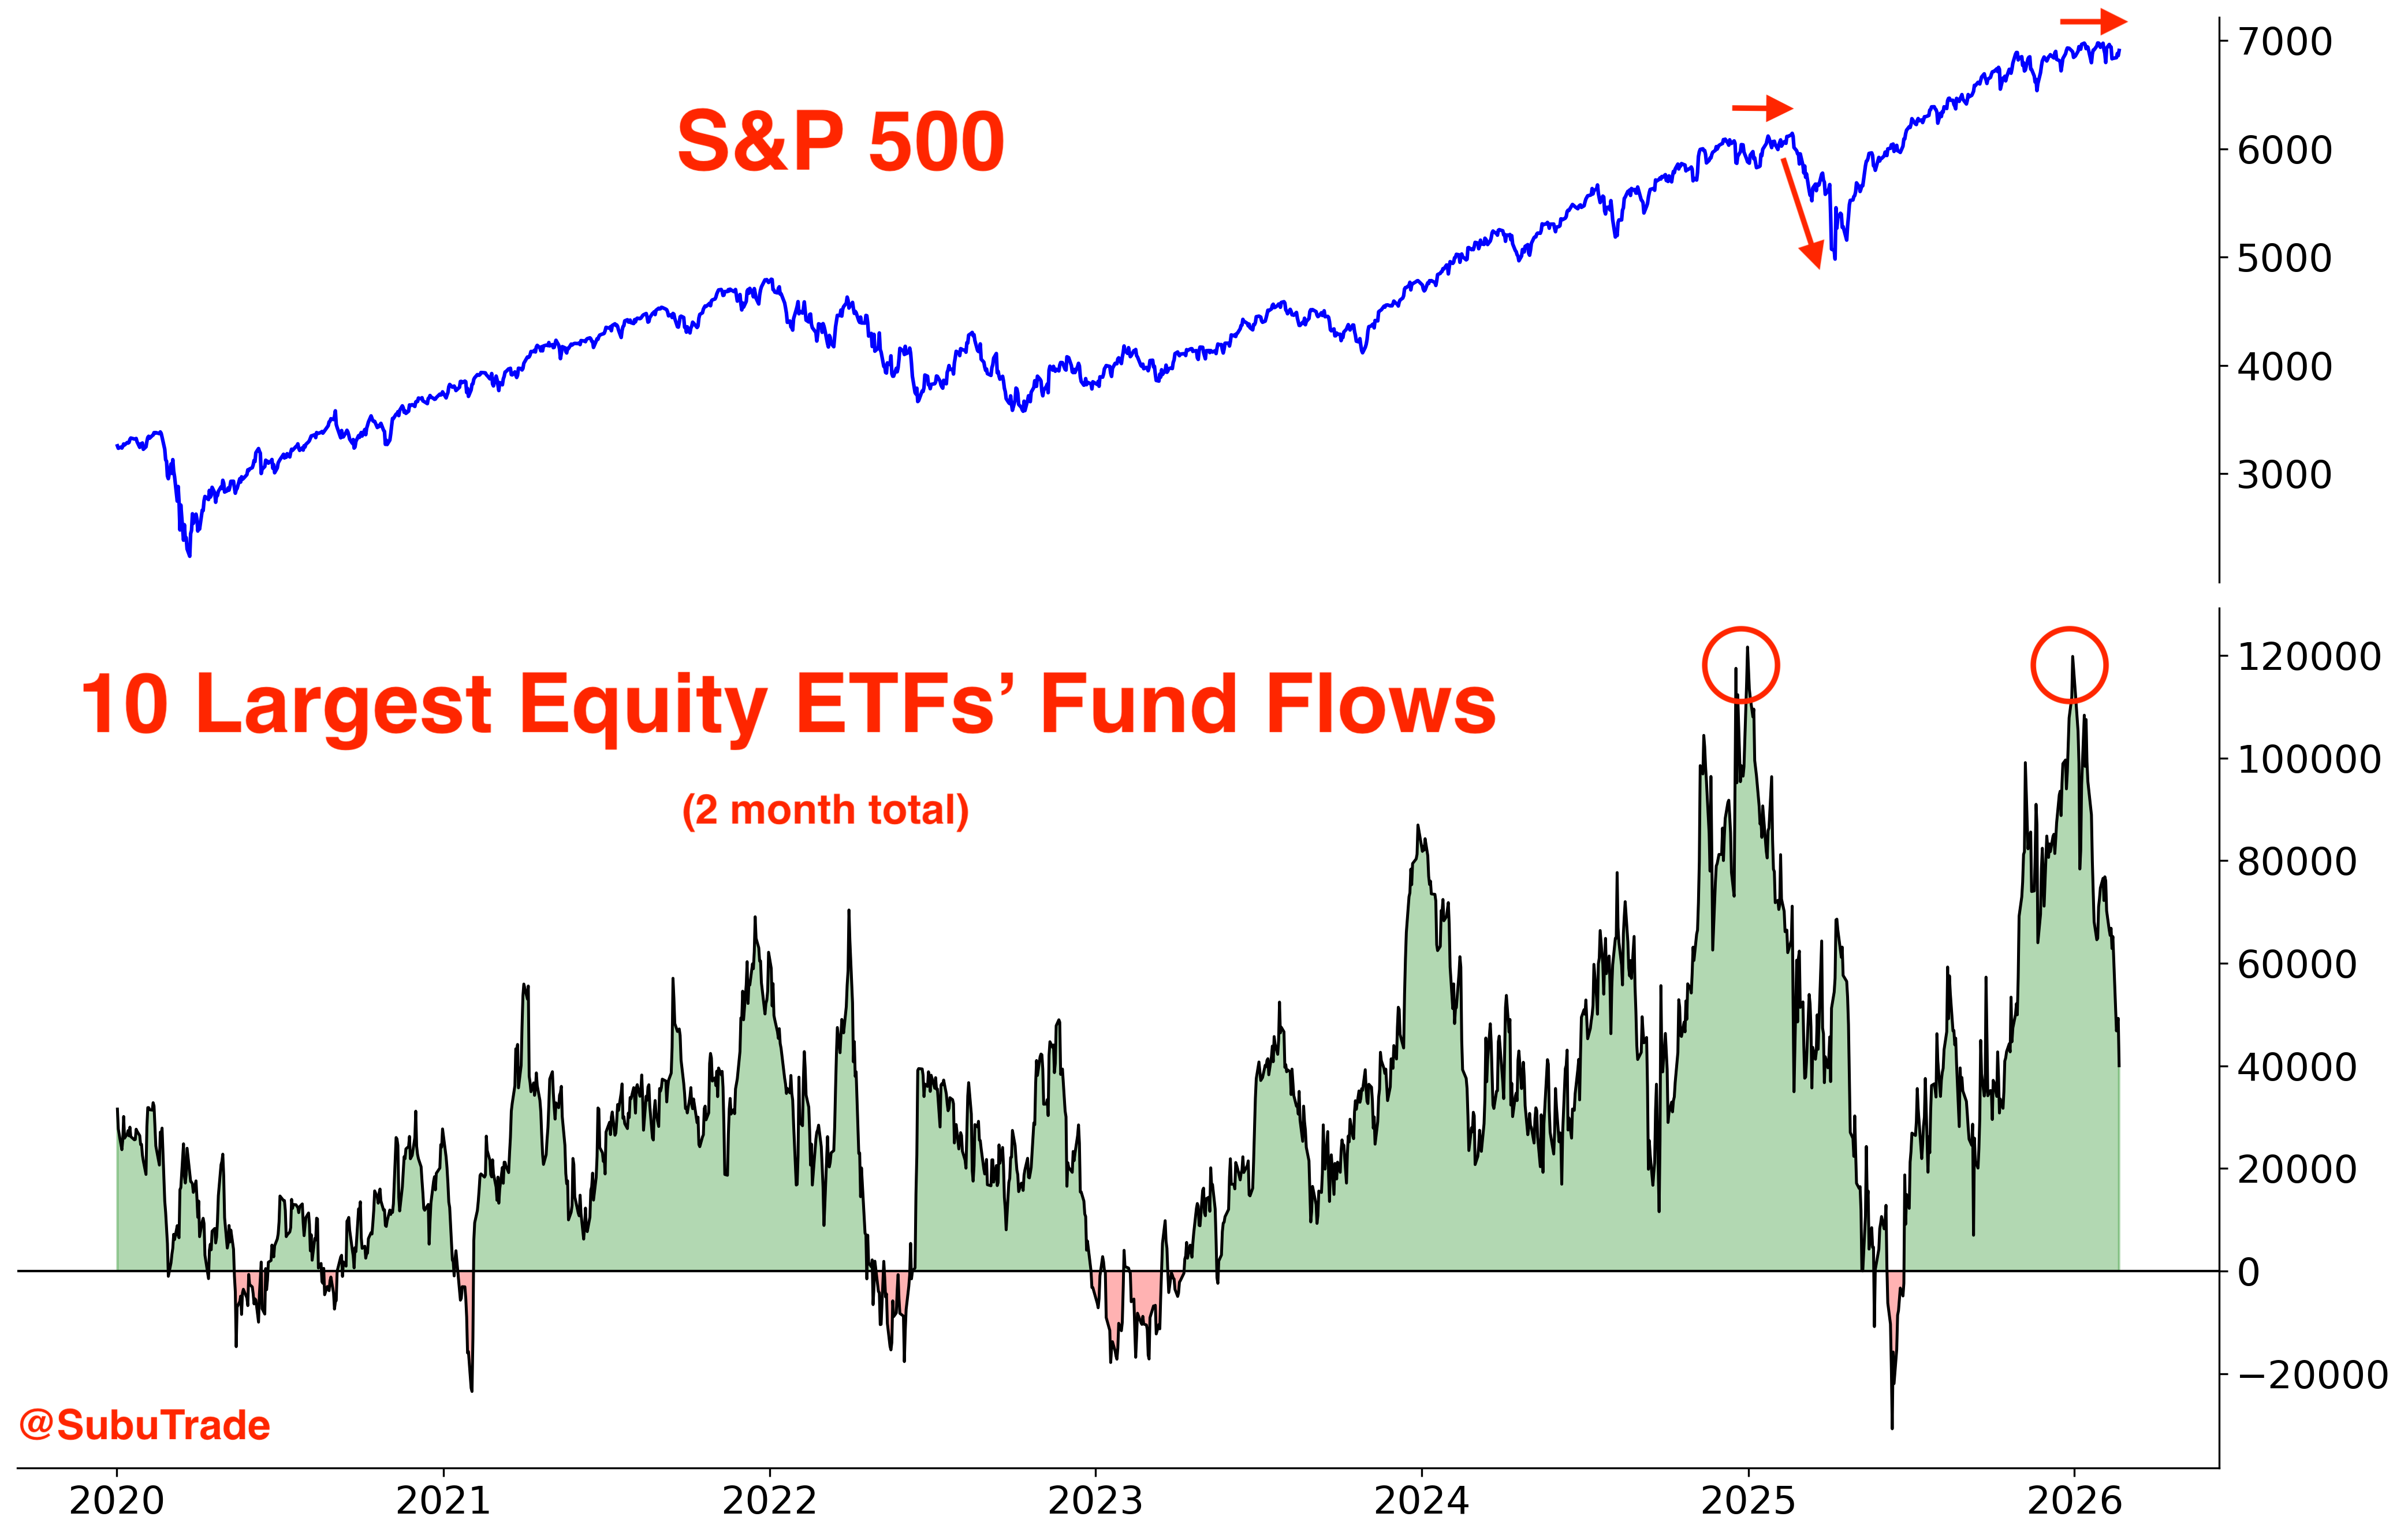
By October 2025, inflows had reached levels comparable to late-2024.
Back in late-2024, U.S. equities moved sideways for several months before collapsing on Trump’s tariff shock. So far, we’ve replicated the first phase of that pattern: since October 2025, the S&P 500 has mostly chopped sideways, making marginal new all-time highs along the way.
In other words, to work off the speculative excess seen by October 2025, we’ve had a “Correction in Time” (sideways) instead of a “Correction in Price” (down) at the S&P 500 index level.
It’s unlikely that the S&P 500 repeats the second phase of that pattern (the crash). Without a major exogenous shock like tariffs, there’s little justification for a huge crash right now.
VIX: extreme positioning slowly being unwound
In December, I began highlighting the extreme short-VIX positioning among Asset Managers. The only other time positioning was this net-short was July 2024, just one month before VIX spiked in early-August 2024.
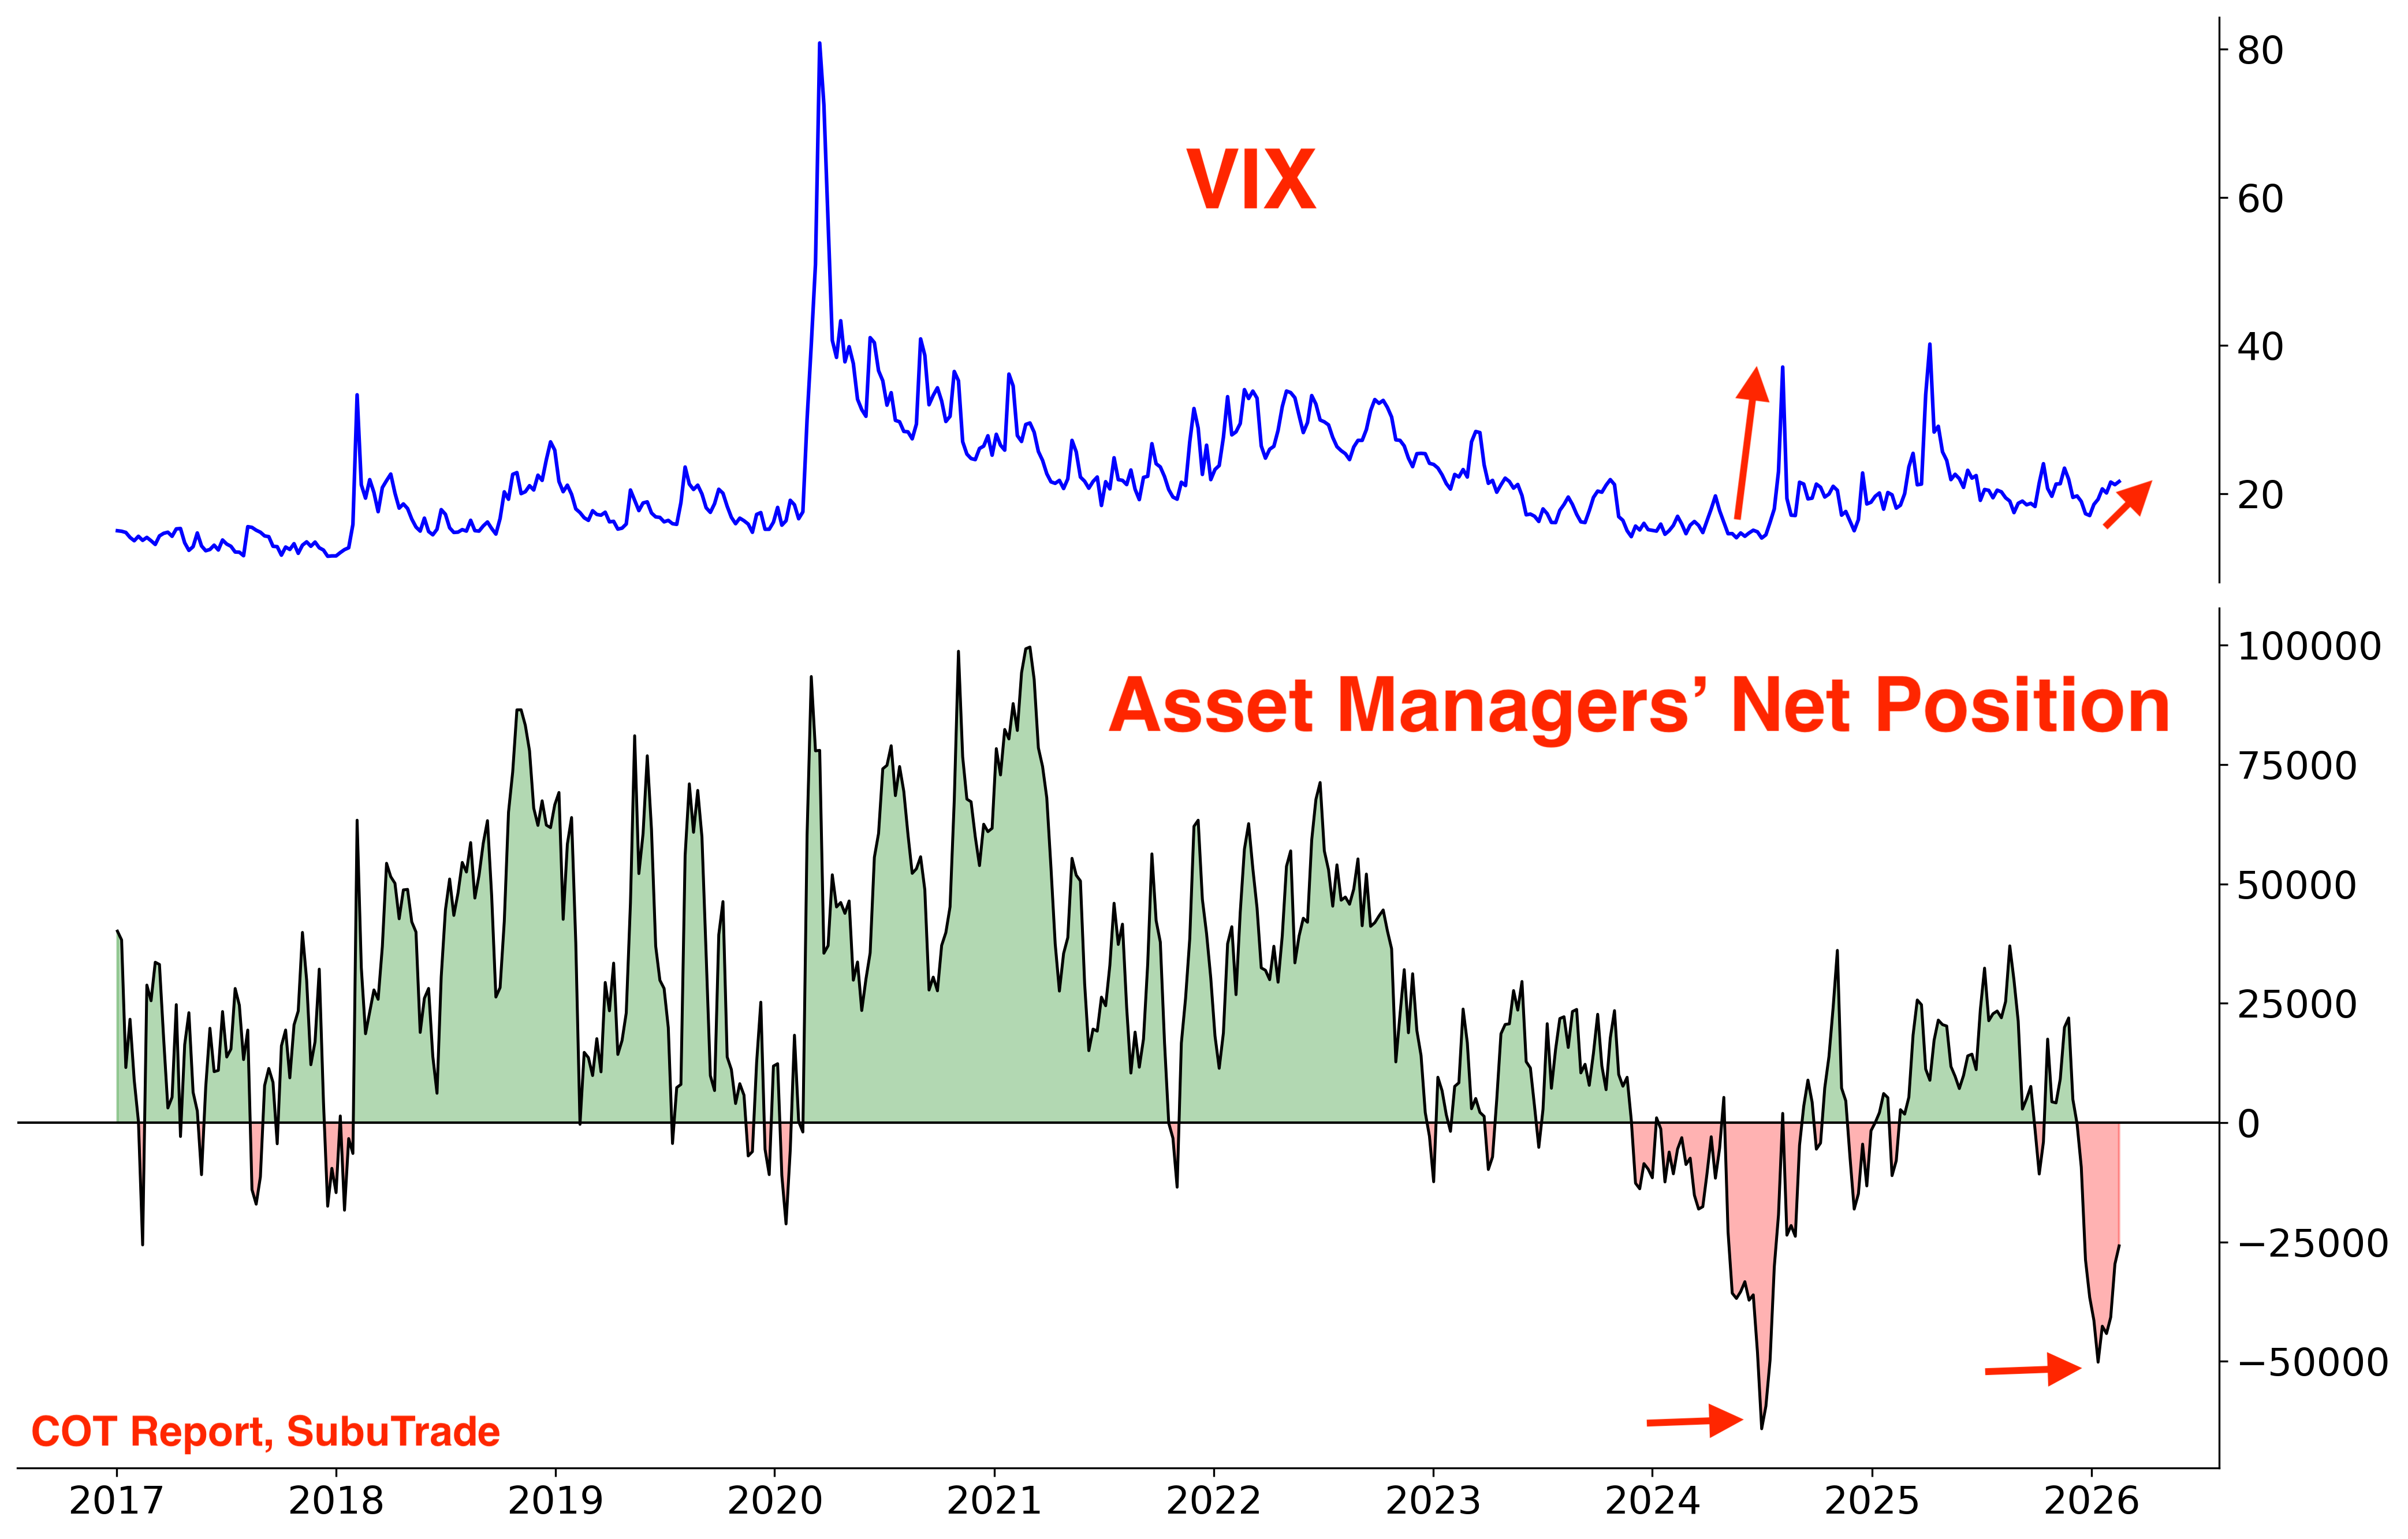
So far, we haven’t seen a volatility spike like August 2024. Instead, VIX slowly drifted higher in the past 2 months, settling just under 20.
Where we’re going
Options
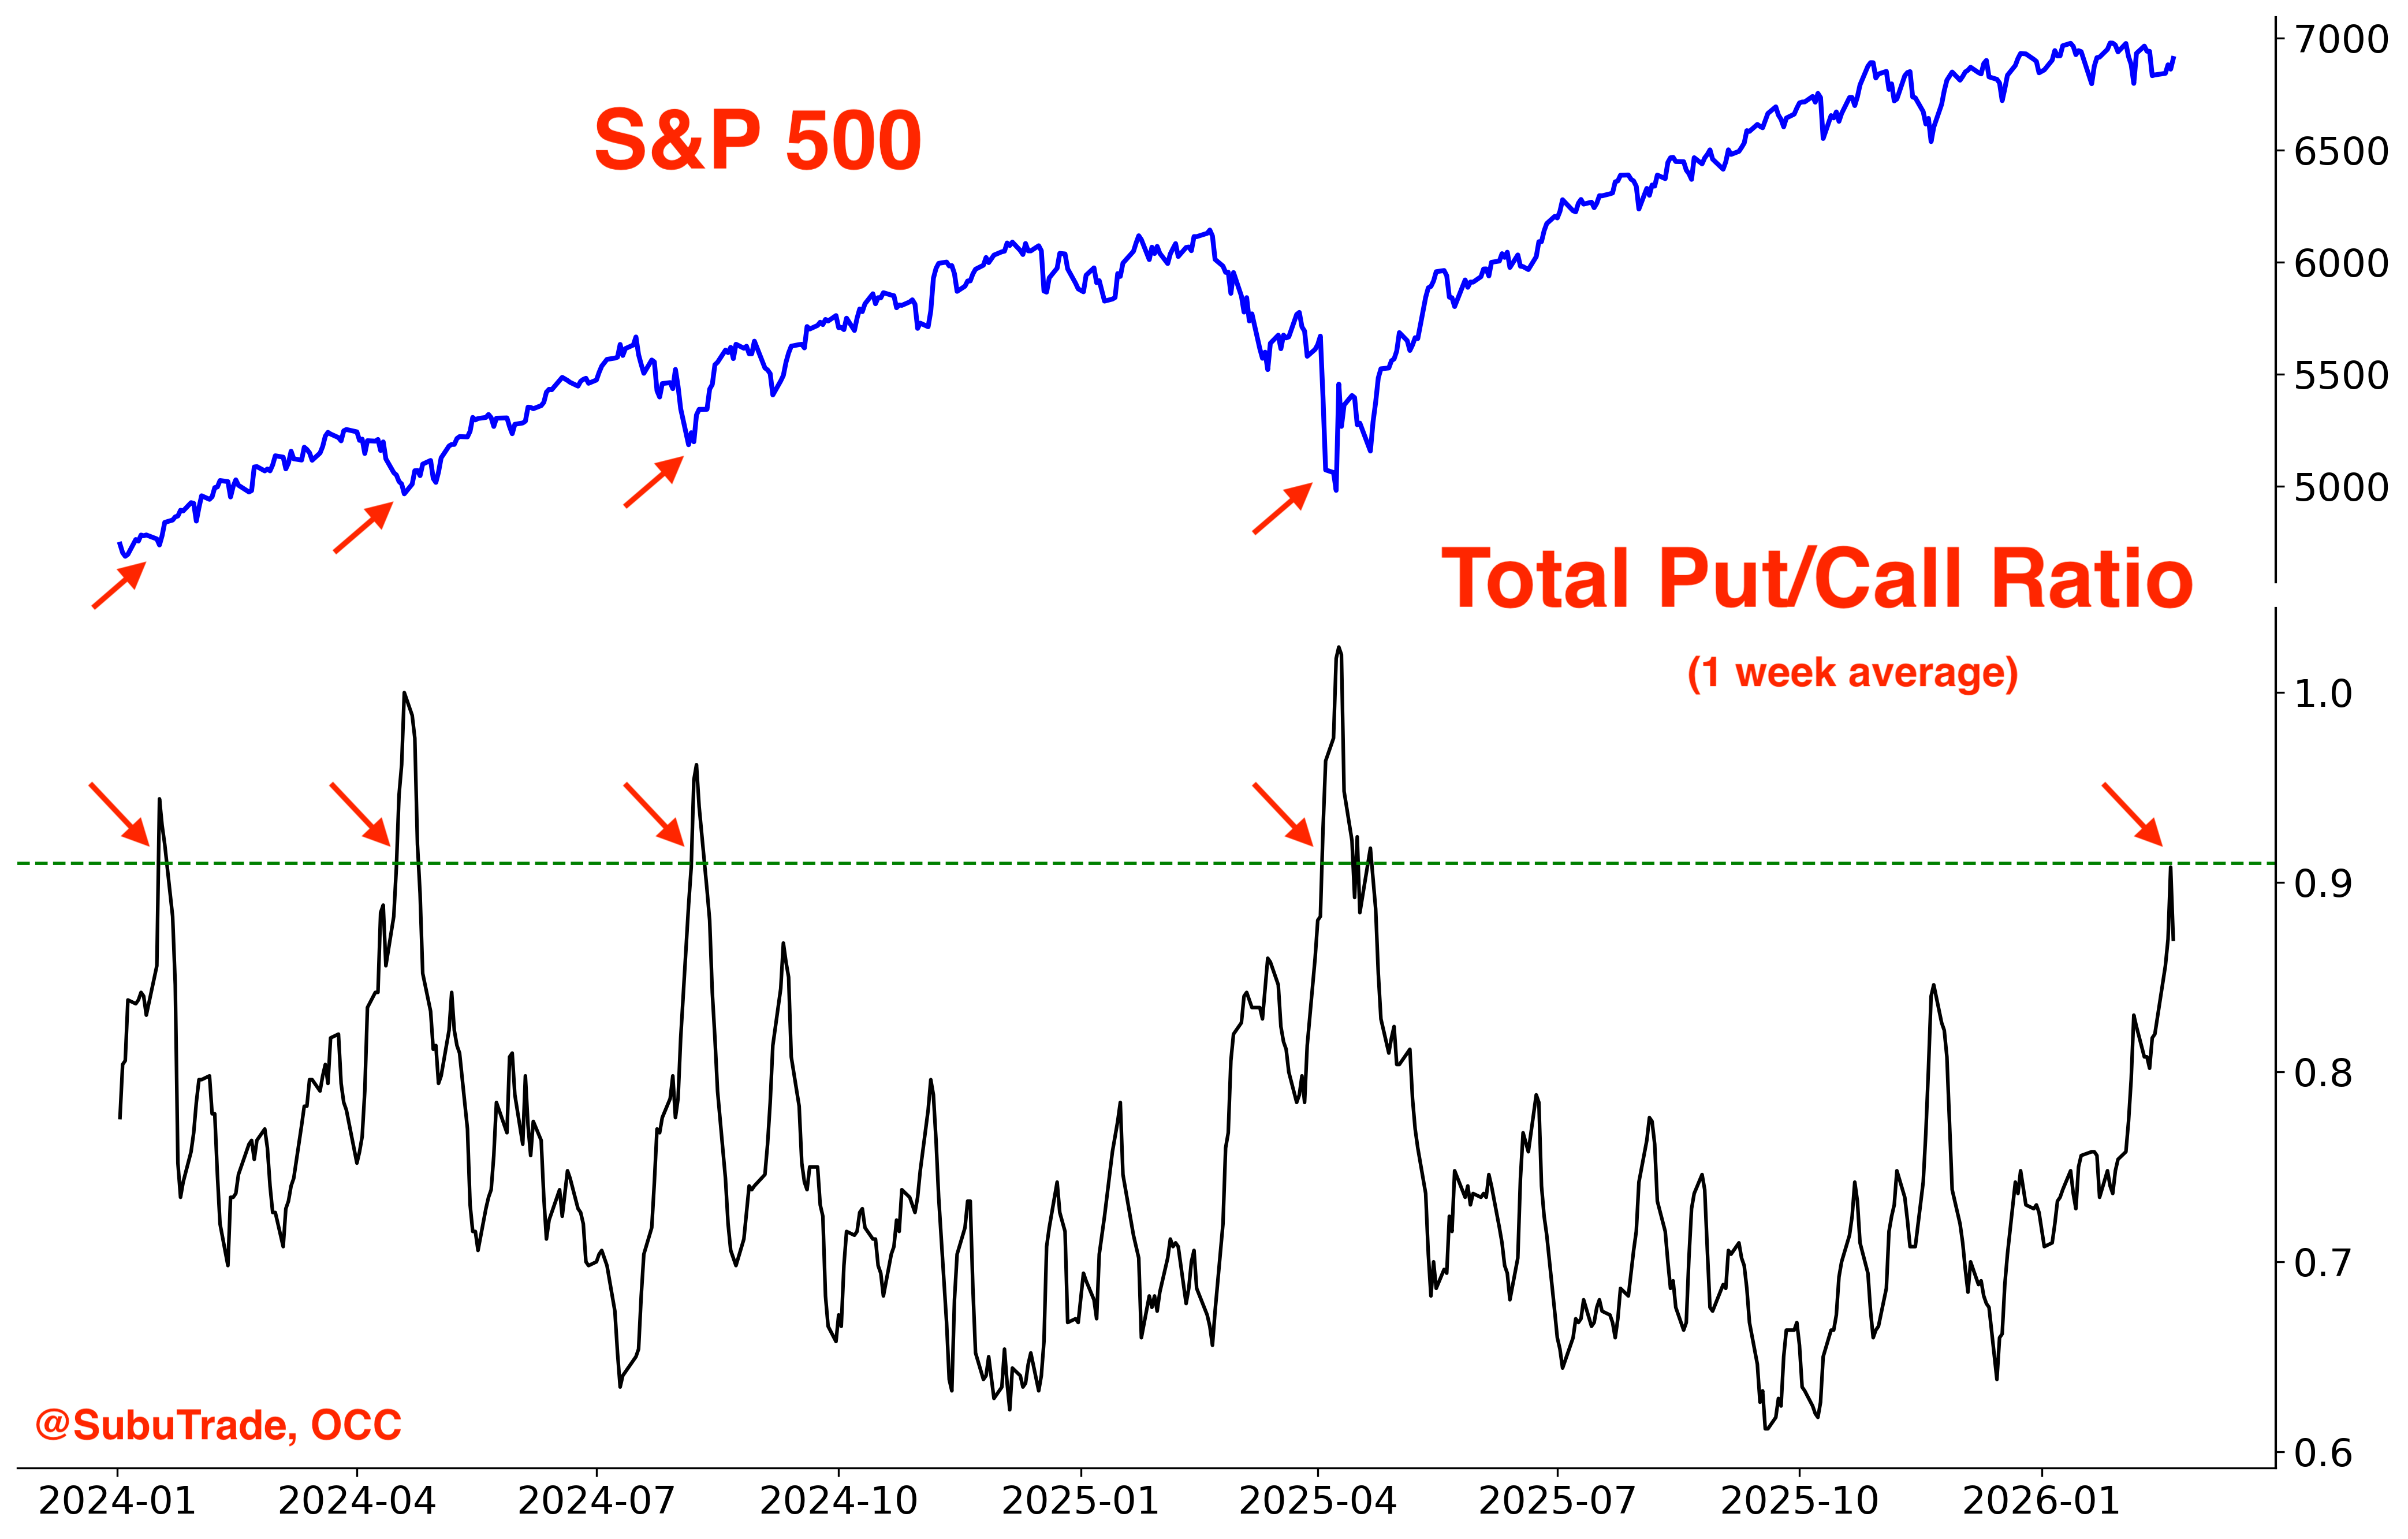
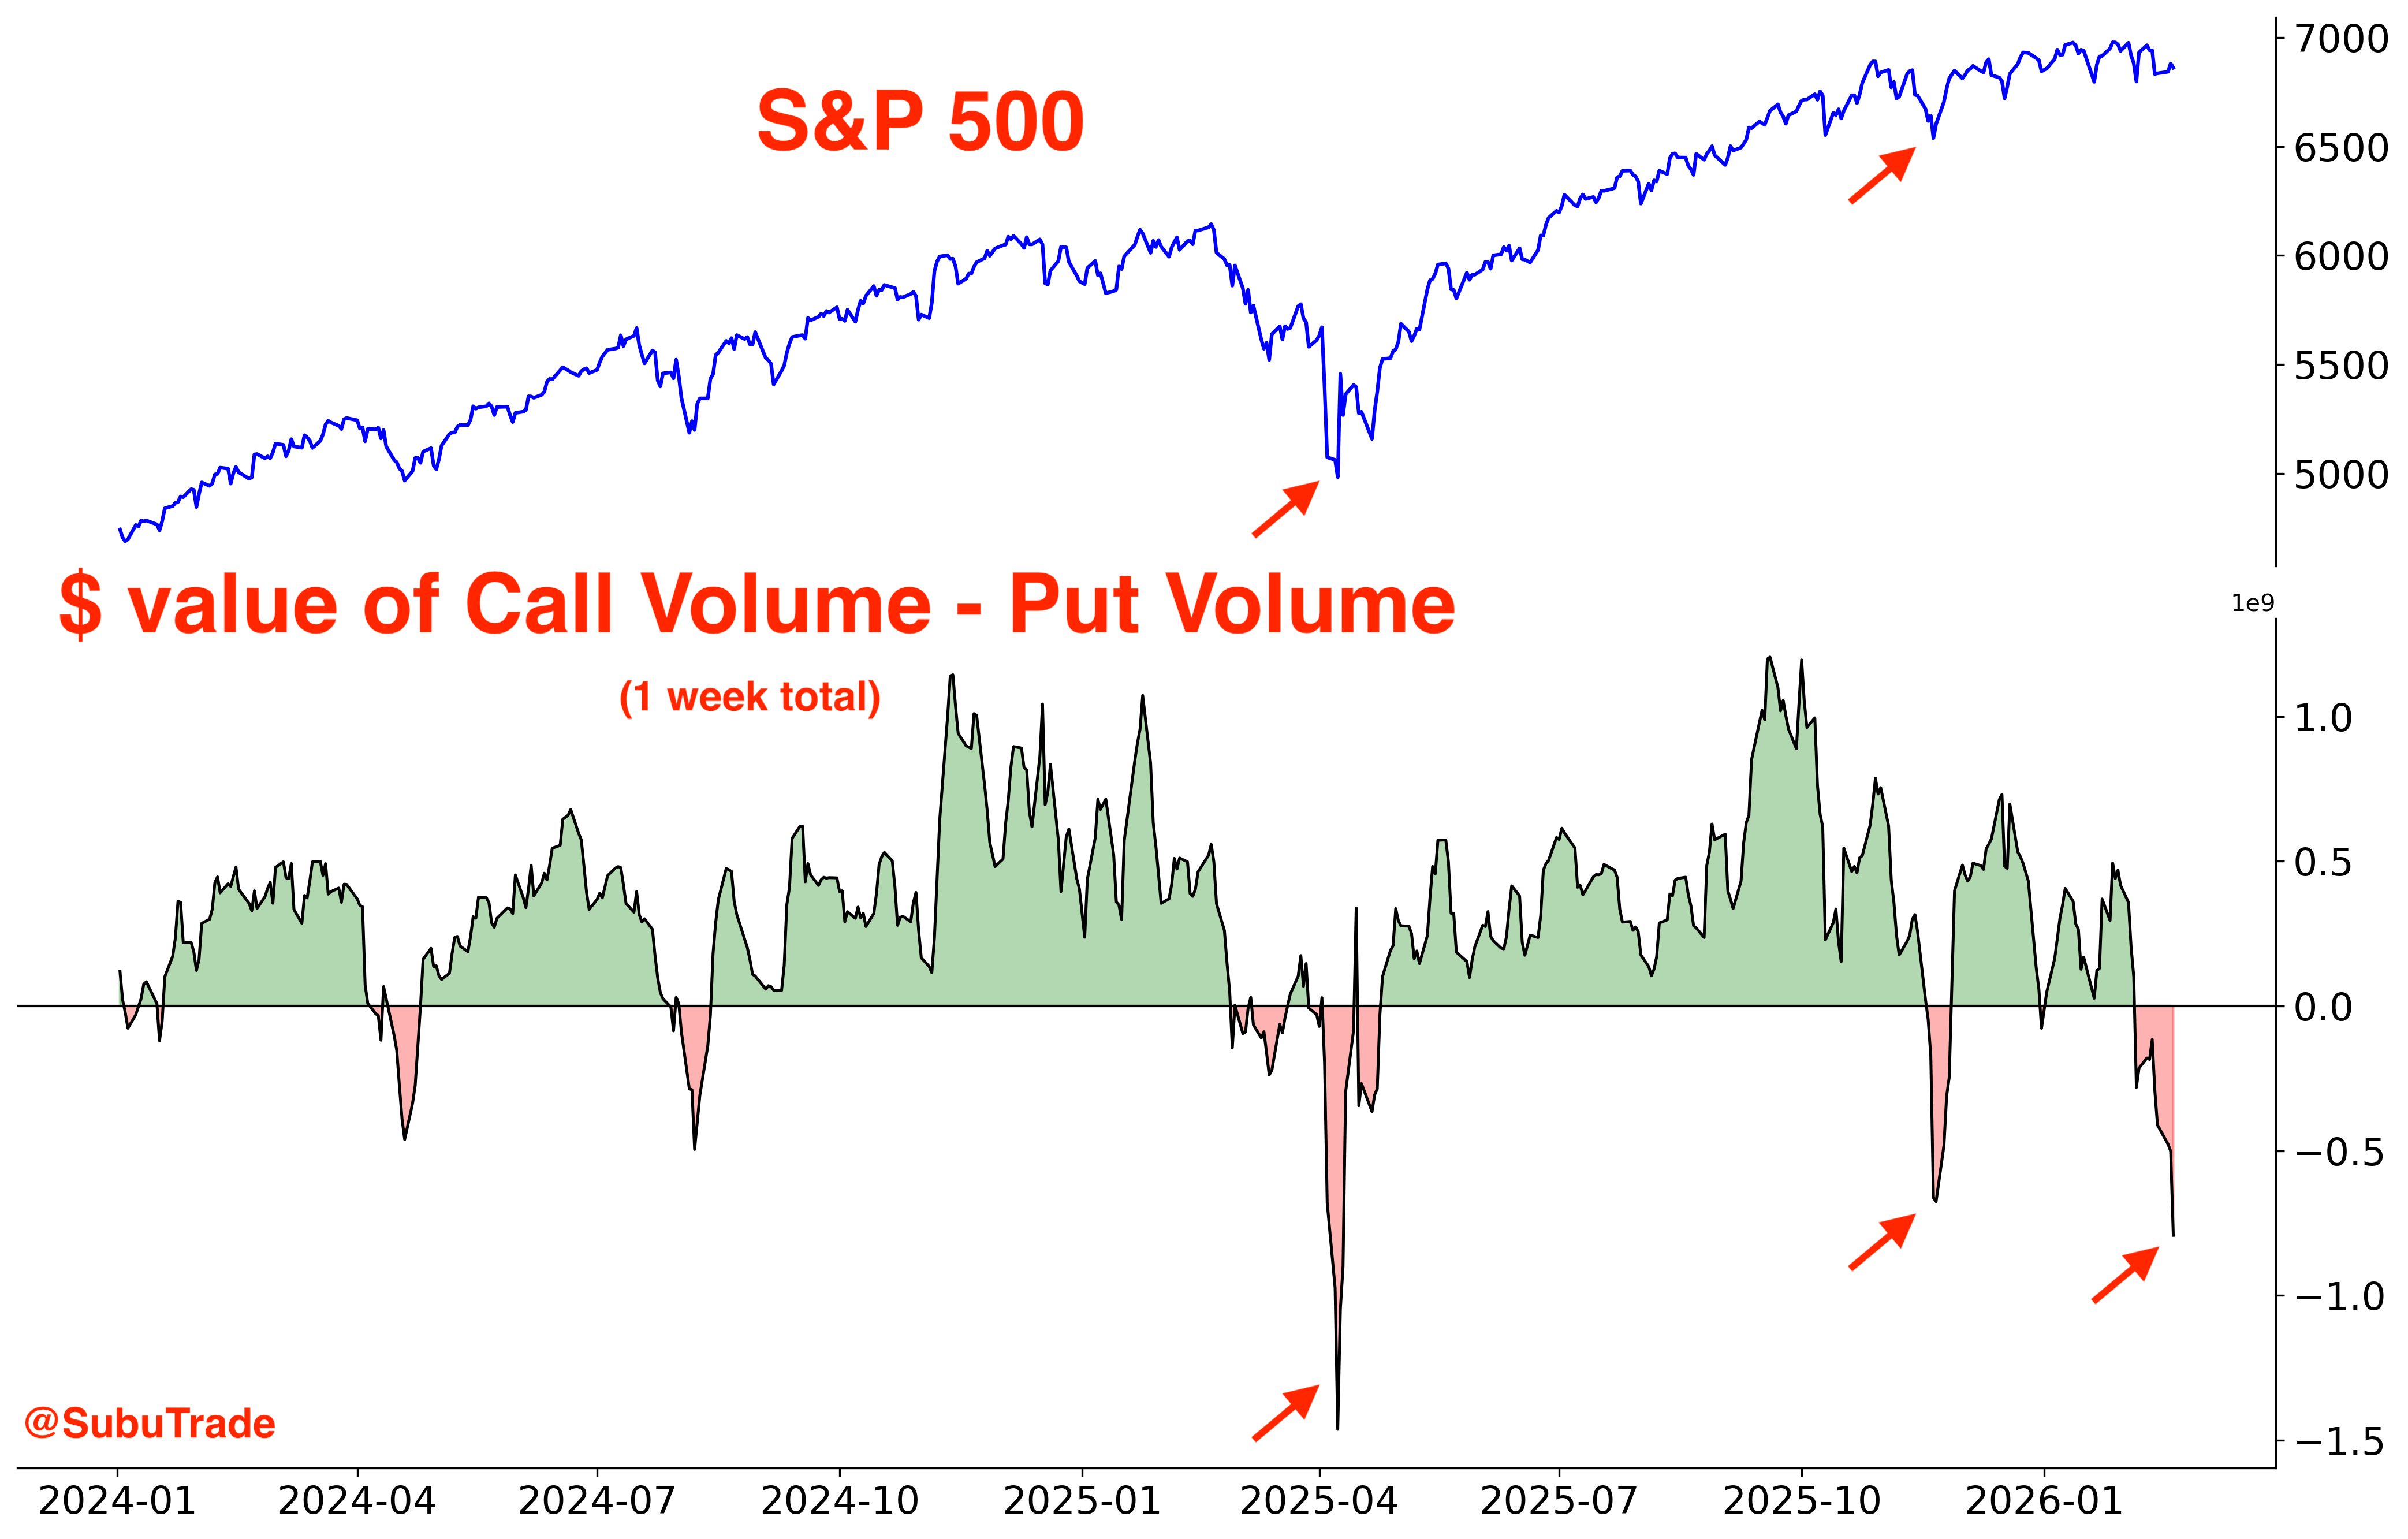
As I noted on X, the Total Put/Call Ratio surged to its highest level since Liberation Day. This figure includes options activity across all U.S. exchanges (not just the CBOE, which is the Put/Call ratio more often cited on social media).
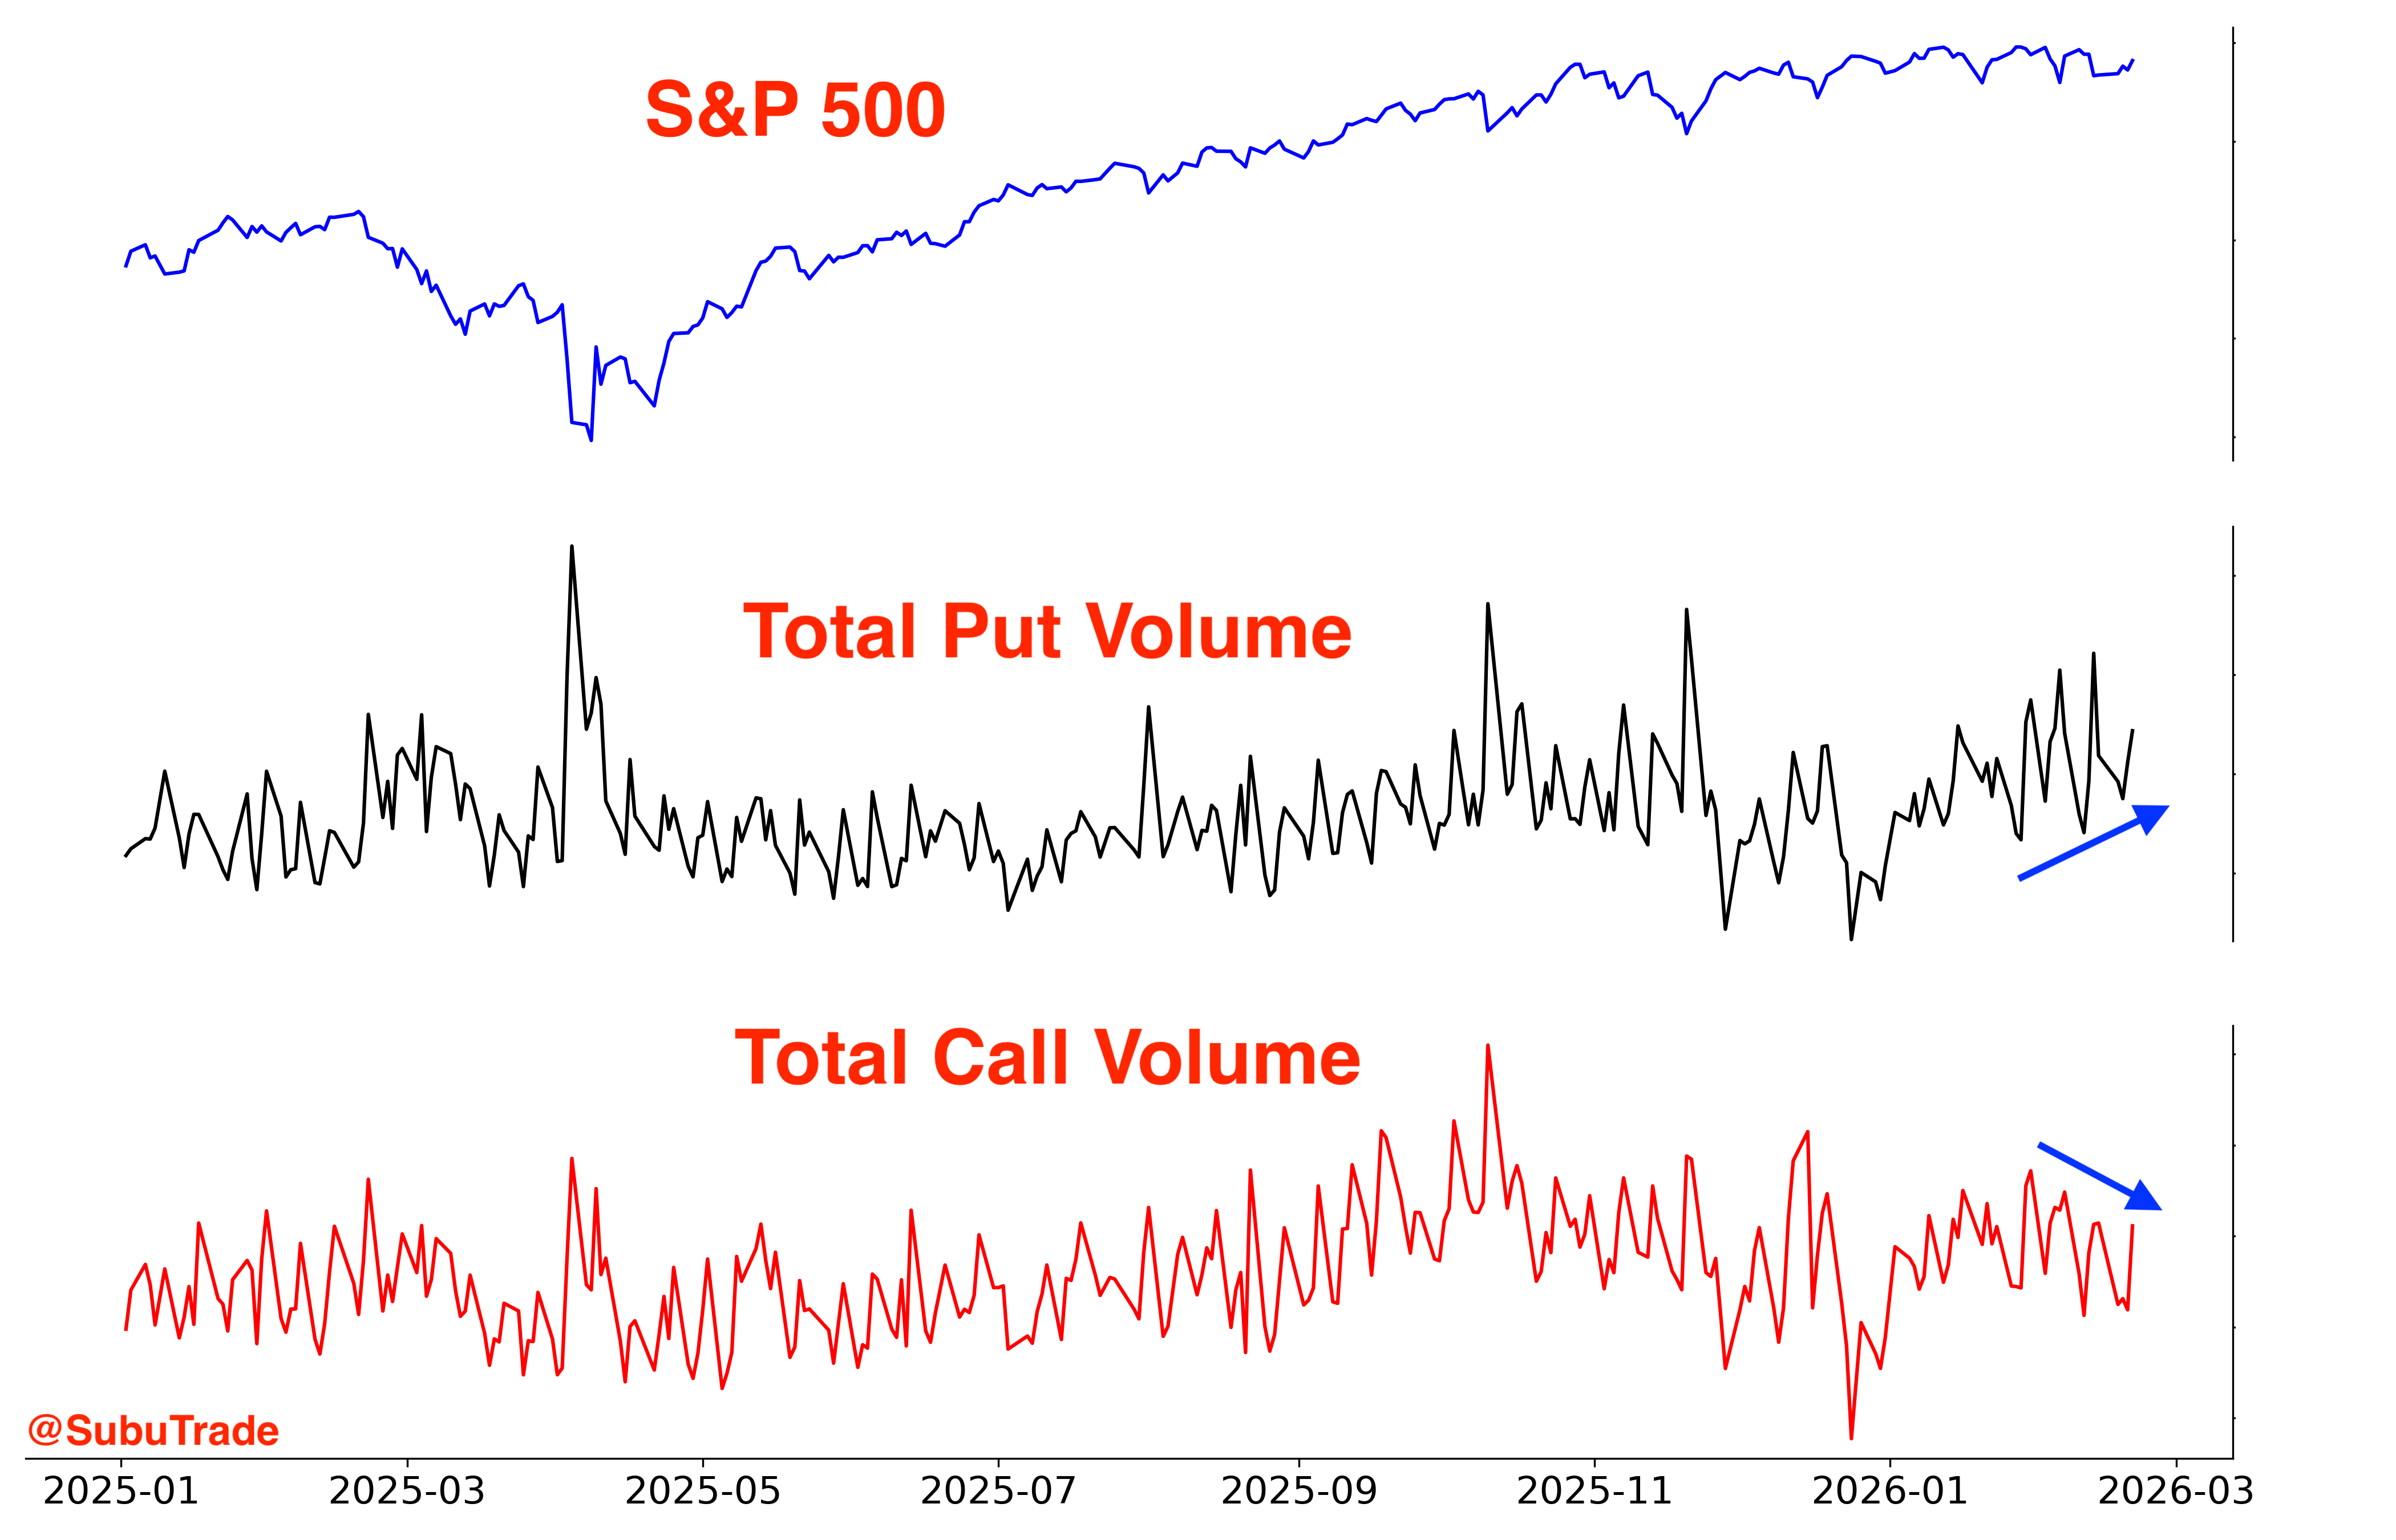
Why is the ratio rising? Put volume is gradually increasing while Call volume is decreasing.
Another way to analyze options data is to look beyond options volumes and examine total dollars transacted. To calculate this, we multiply the volume at each strike by the price those options traded at.
By that measure, significantly more $ flowed into Puts than Calls over the past week: the most since Liberation Day.
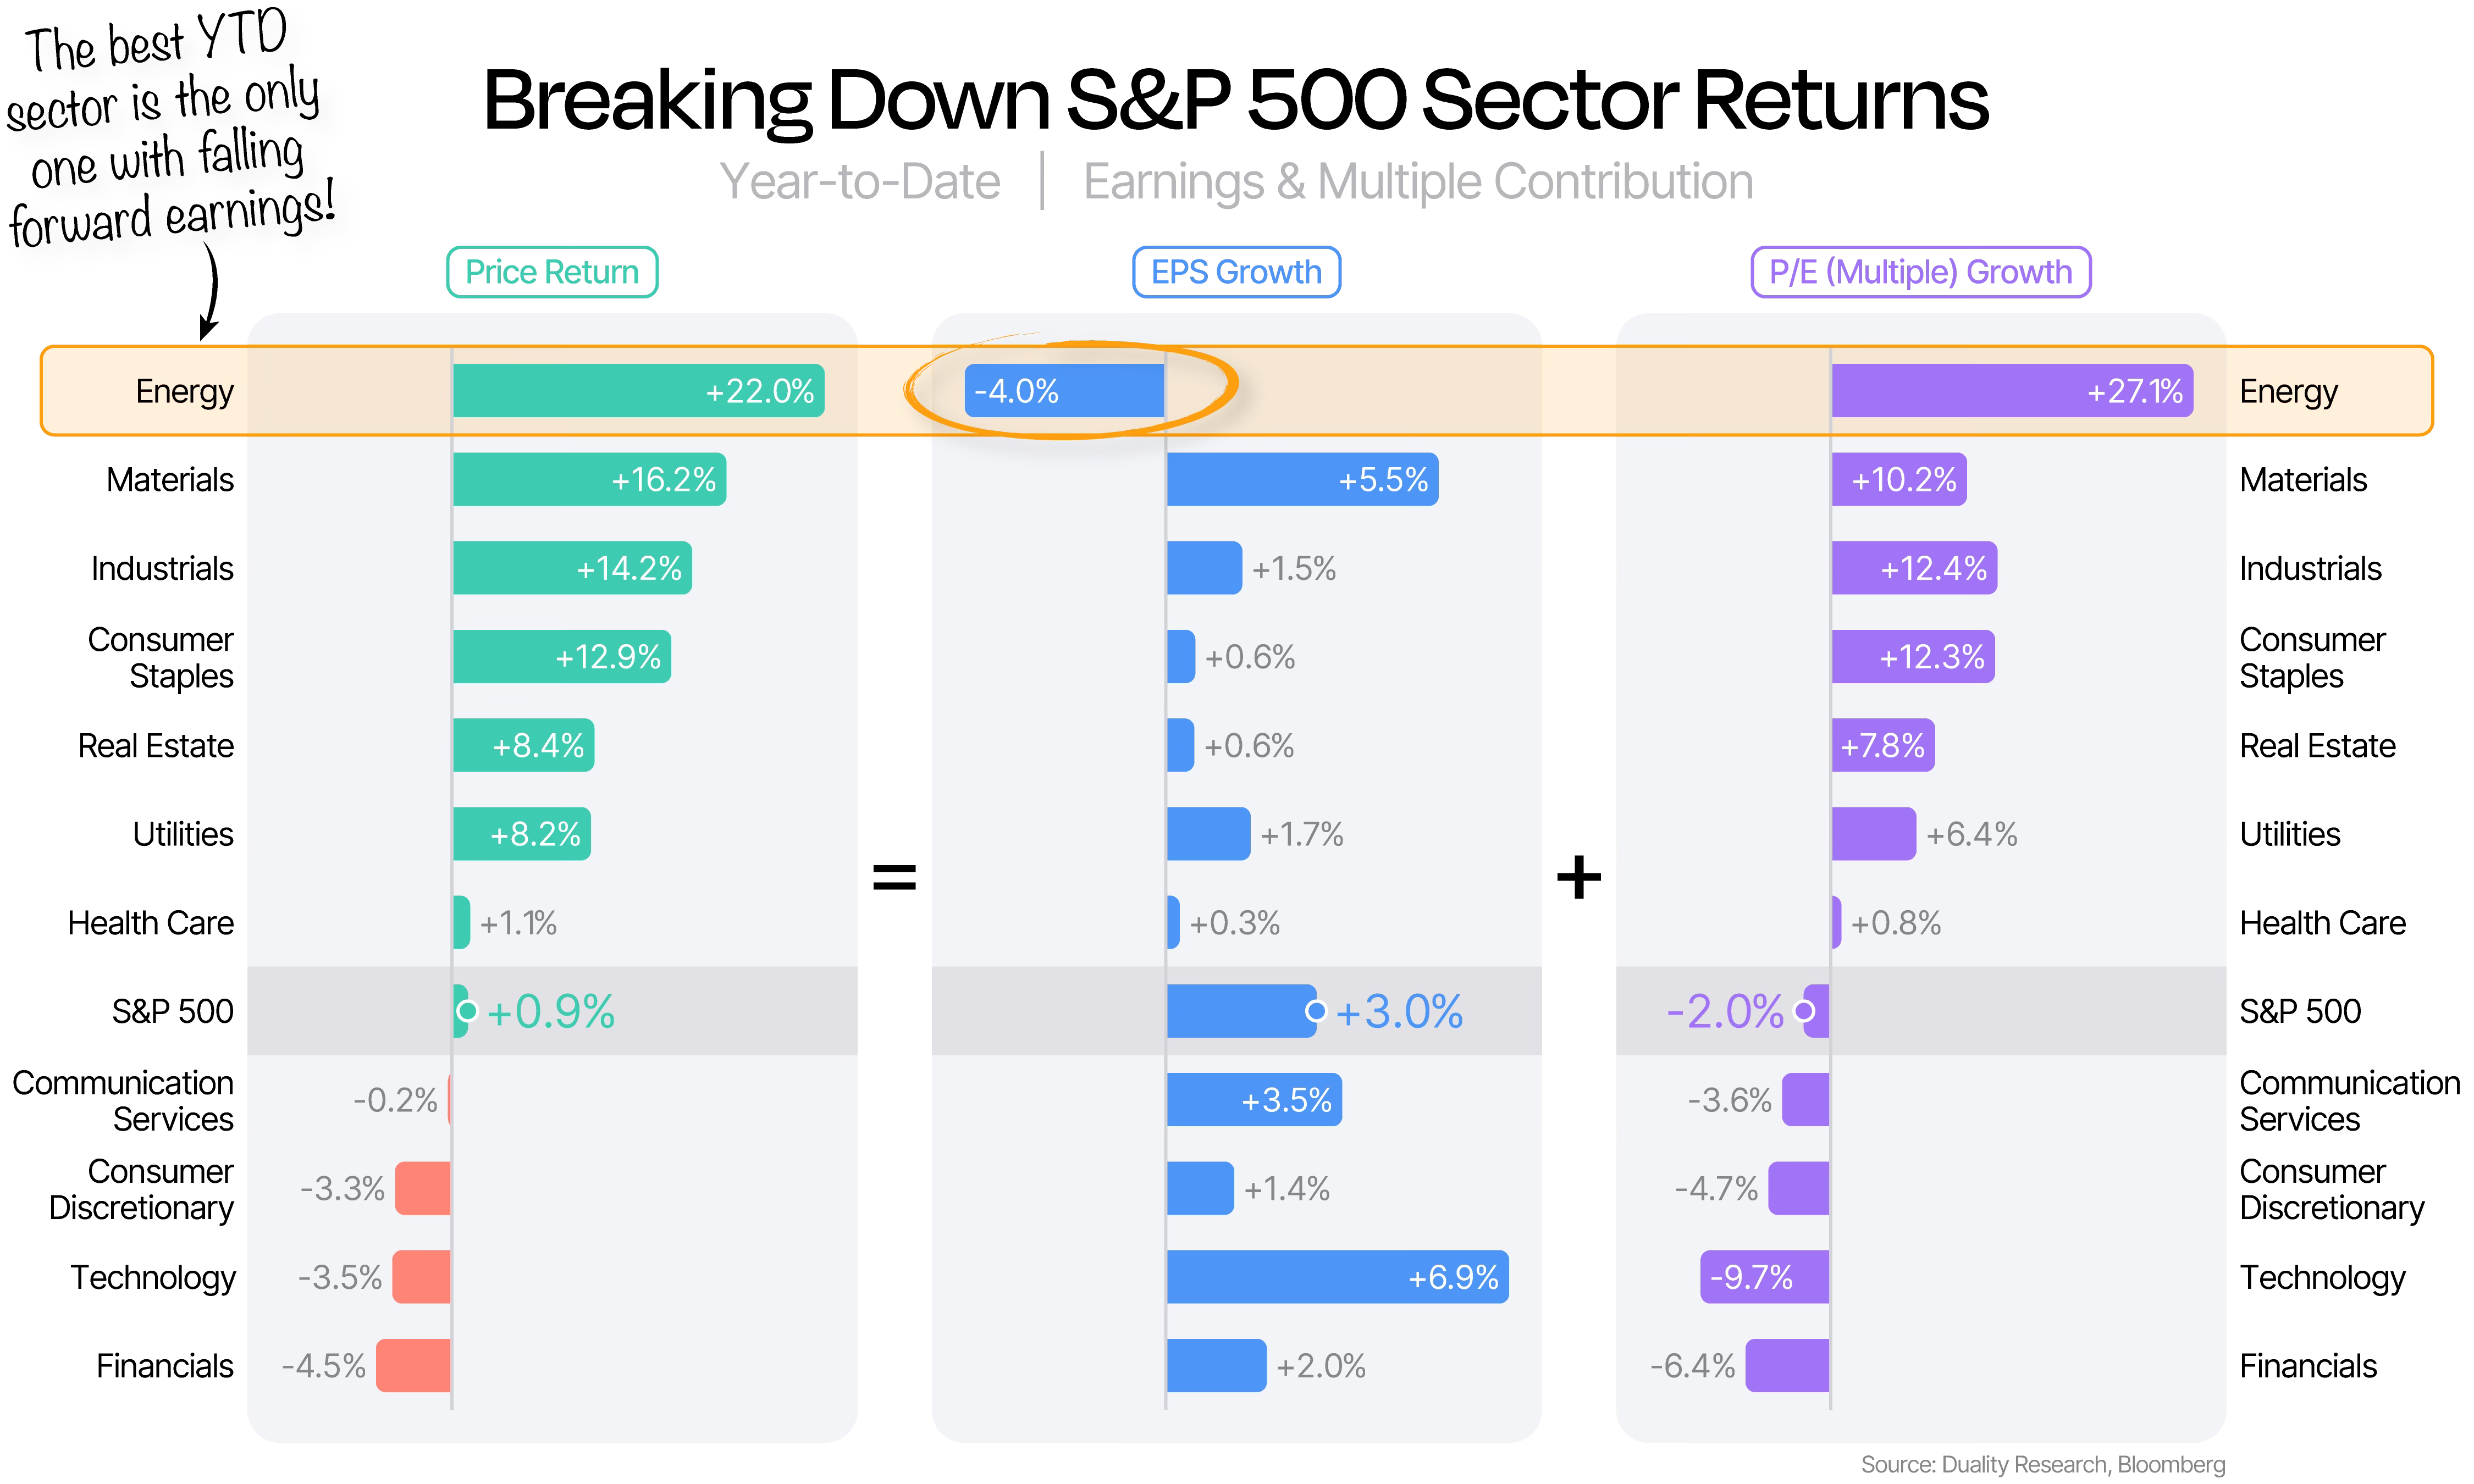
The S&P 500 may look calm - almost boring - at the index level. But beneath the surface, there’s significant turbulence. Some sectors and themes have declined sharply, while others surged.
This is extreme sector rotation. The Hindenburg Omen reflects just how bifurcated the market has become: an incredibly split tape.
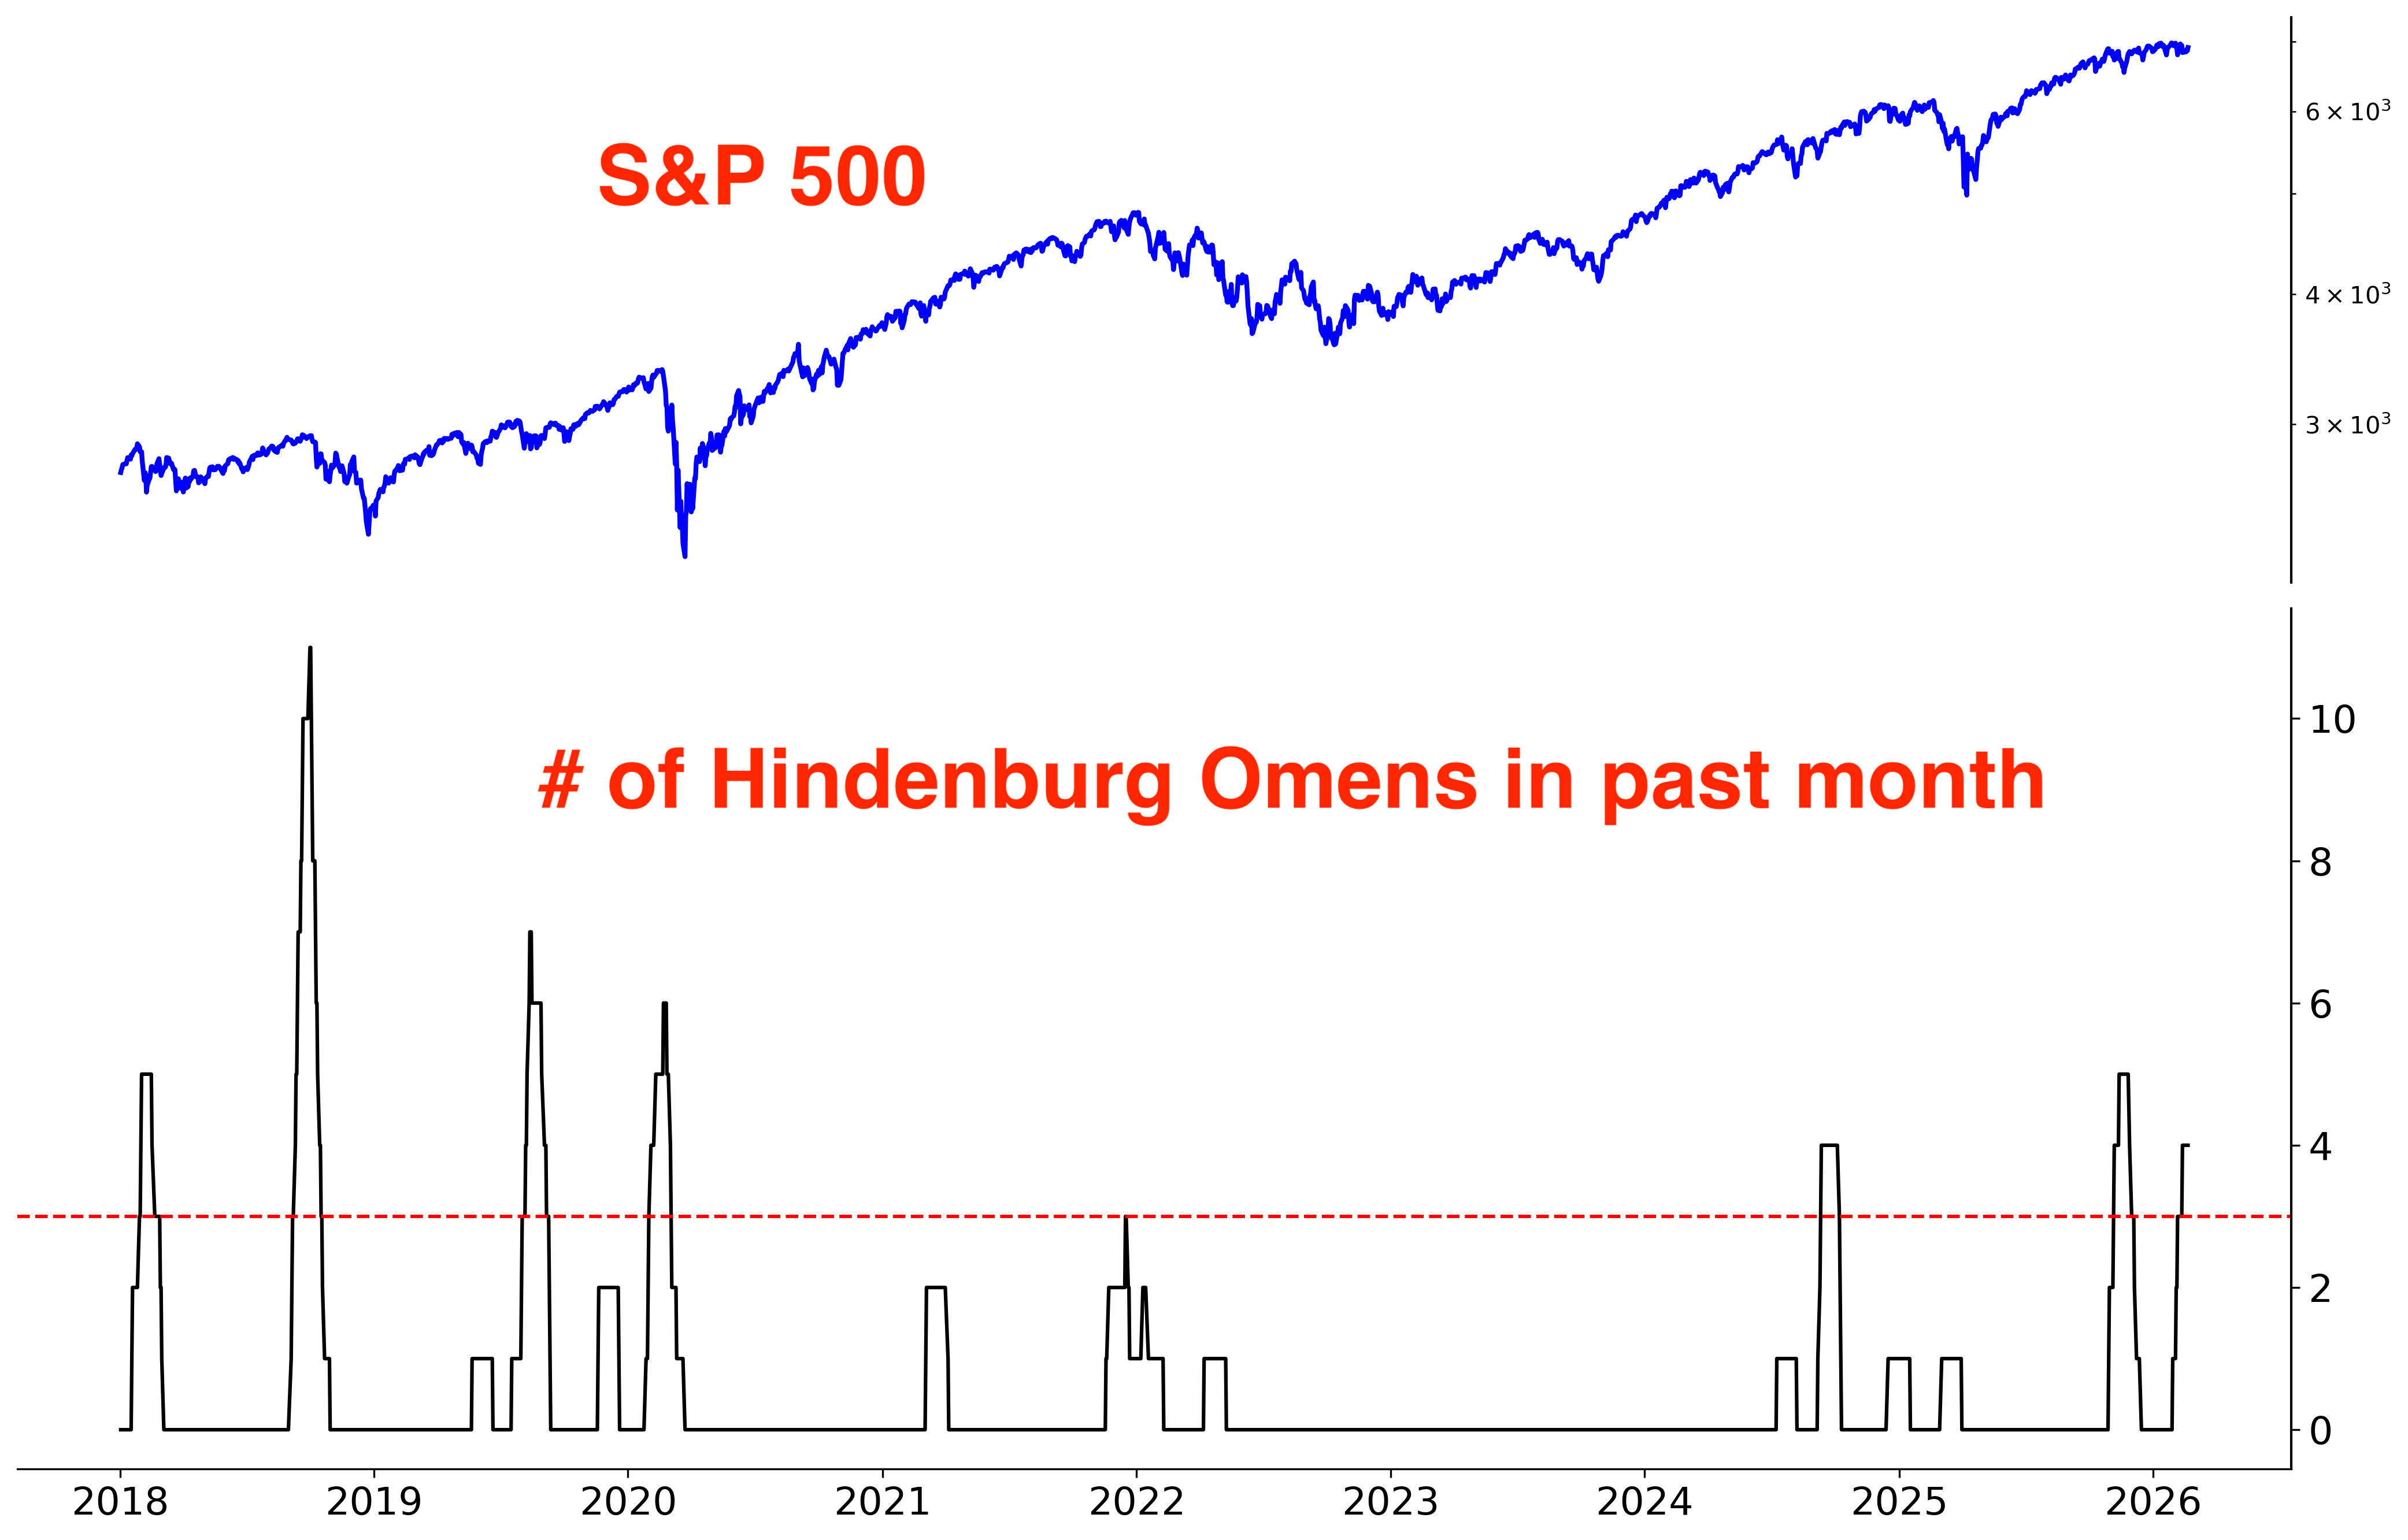
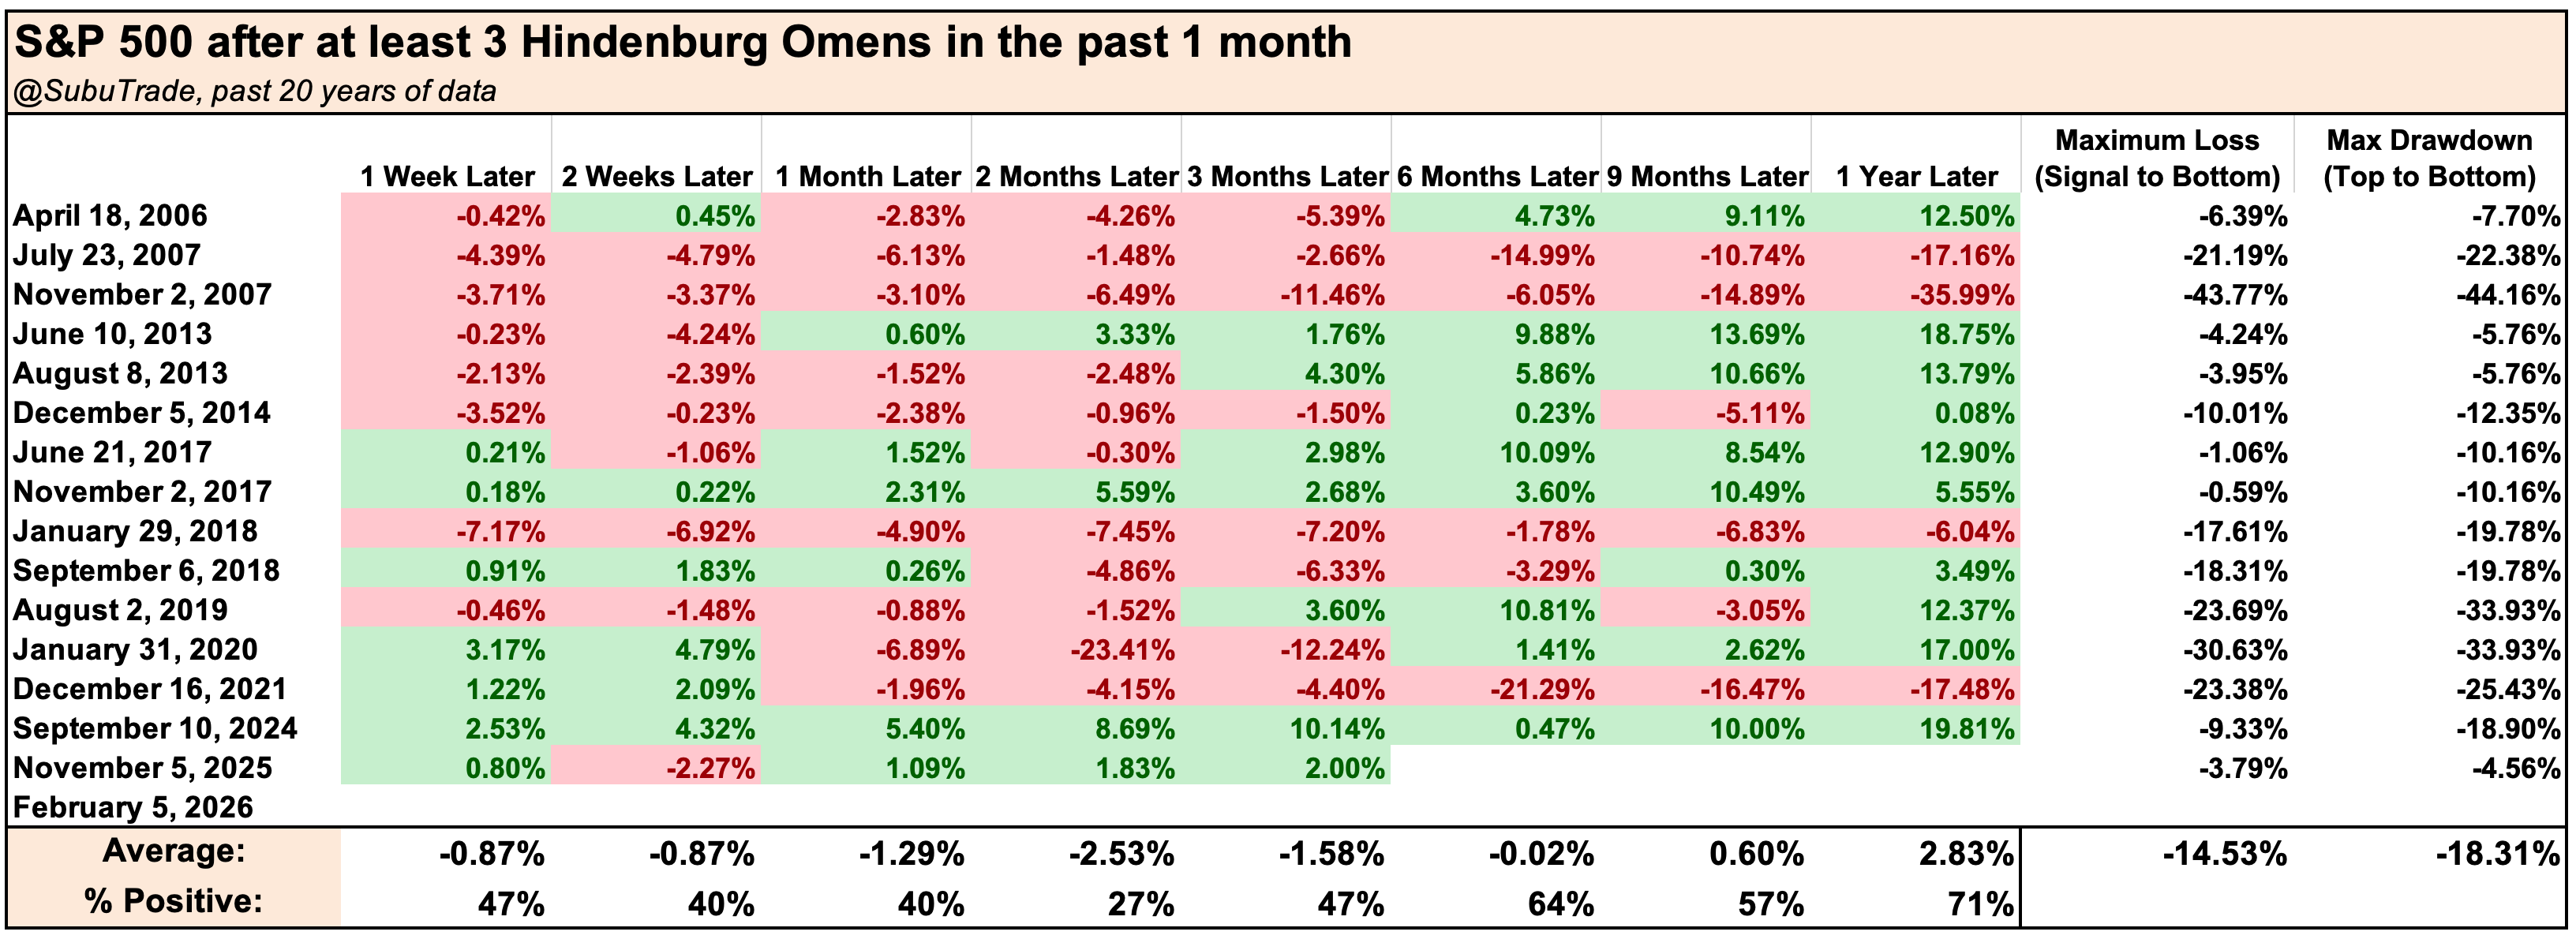
When people hear “Hindenburg Omen,” they assume it signals a market crash is imminent. That’s wrong.
While some Hindenburg Omens are followed by crashes, most are followed by pullbacks and corrections. The average 2-3 month forward return after a Hindenburg Omen is only slightly negative: significantly worse than “random”, but not always catastrophic.
This time, we’ve seen the more constructive outcome.
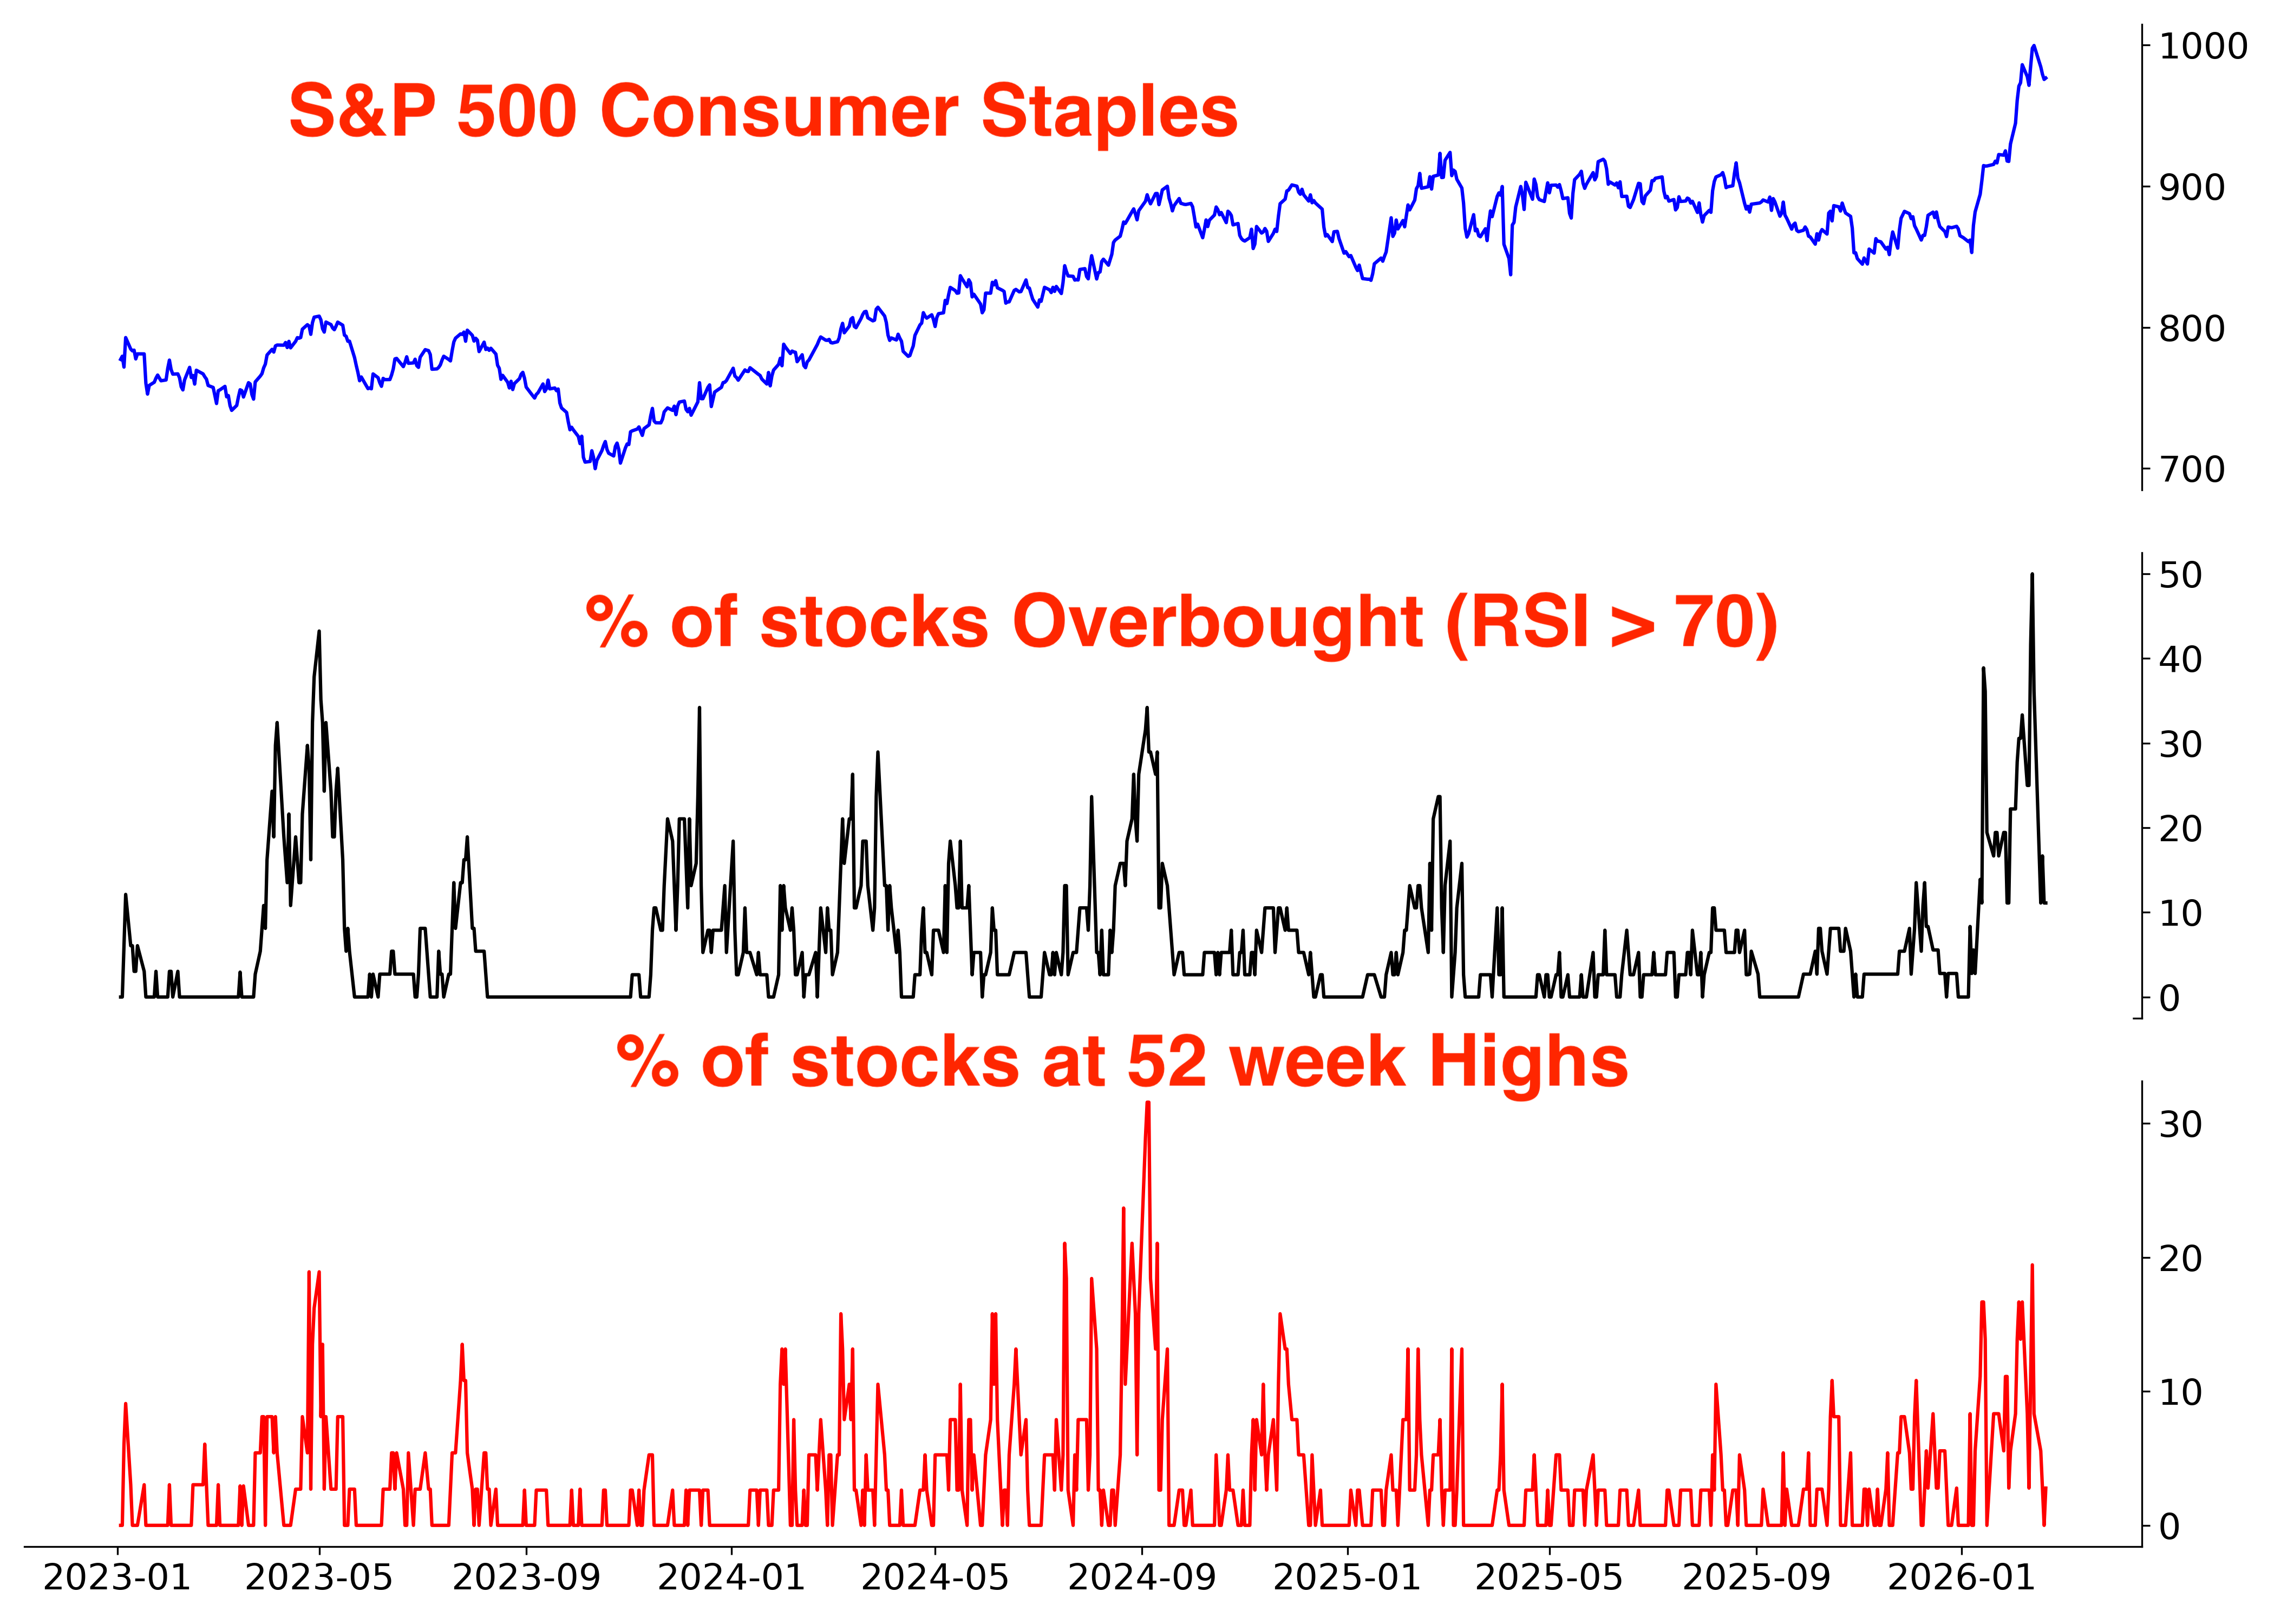
Since the first Hindenburg Omen appeared in late-October 2025, previously high-flyers were sold, while laggards like Consumer Staples and Energy surged. That’s a healthier reset: a correction through time and sector leadership, not a broad index-level crash.
Speaking of rotation amongst sectors…
What’s been bought vs. what’s been sold
What’s been sold off (and now being bought)
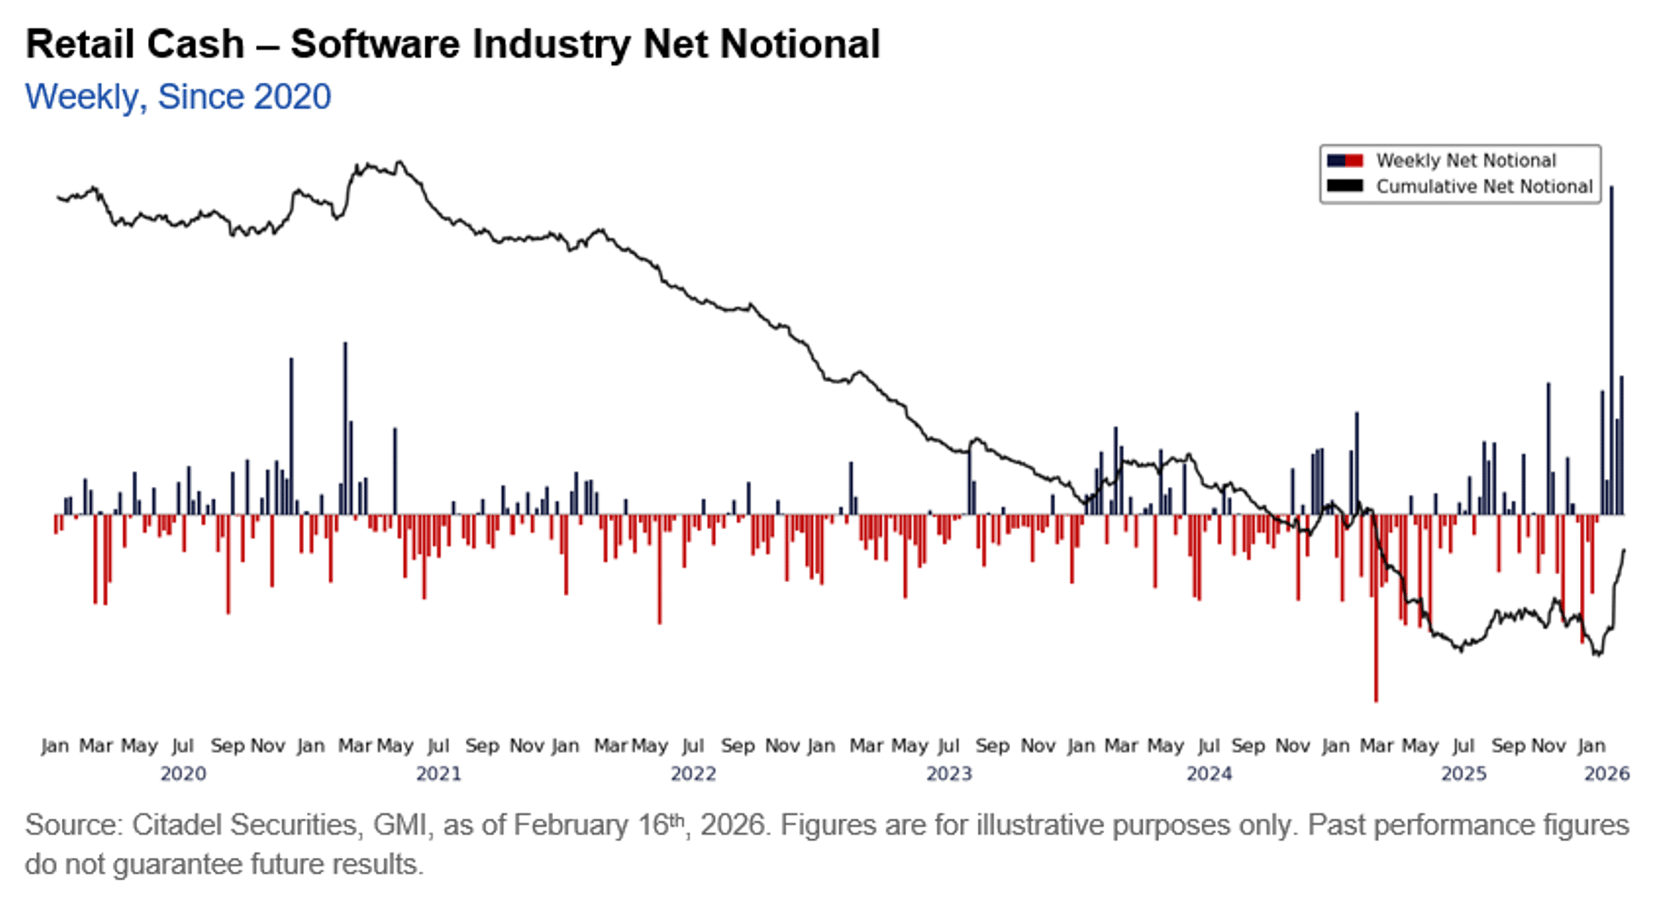
Software stocks sold off sharply on fears that AI could disrupt their business models and earnings. The selloff was extreme, with RSI dropping below 20.
Such oversold conditions tend to attract mean-reversion traders, and this time they stepped in aggressively. Since the February 5 bottom, software etf IGV has seen record inflows as dip-buyers piled in.
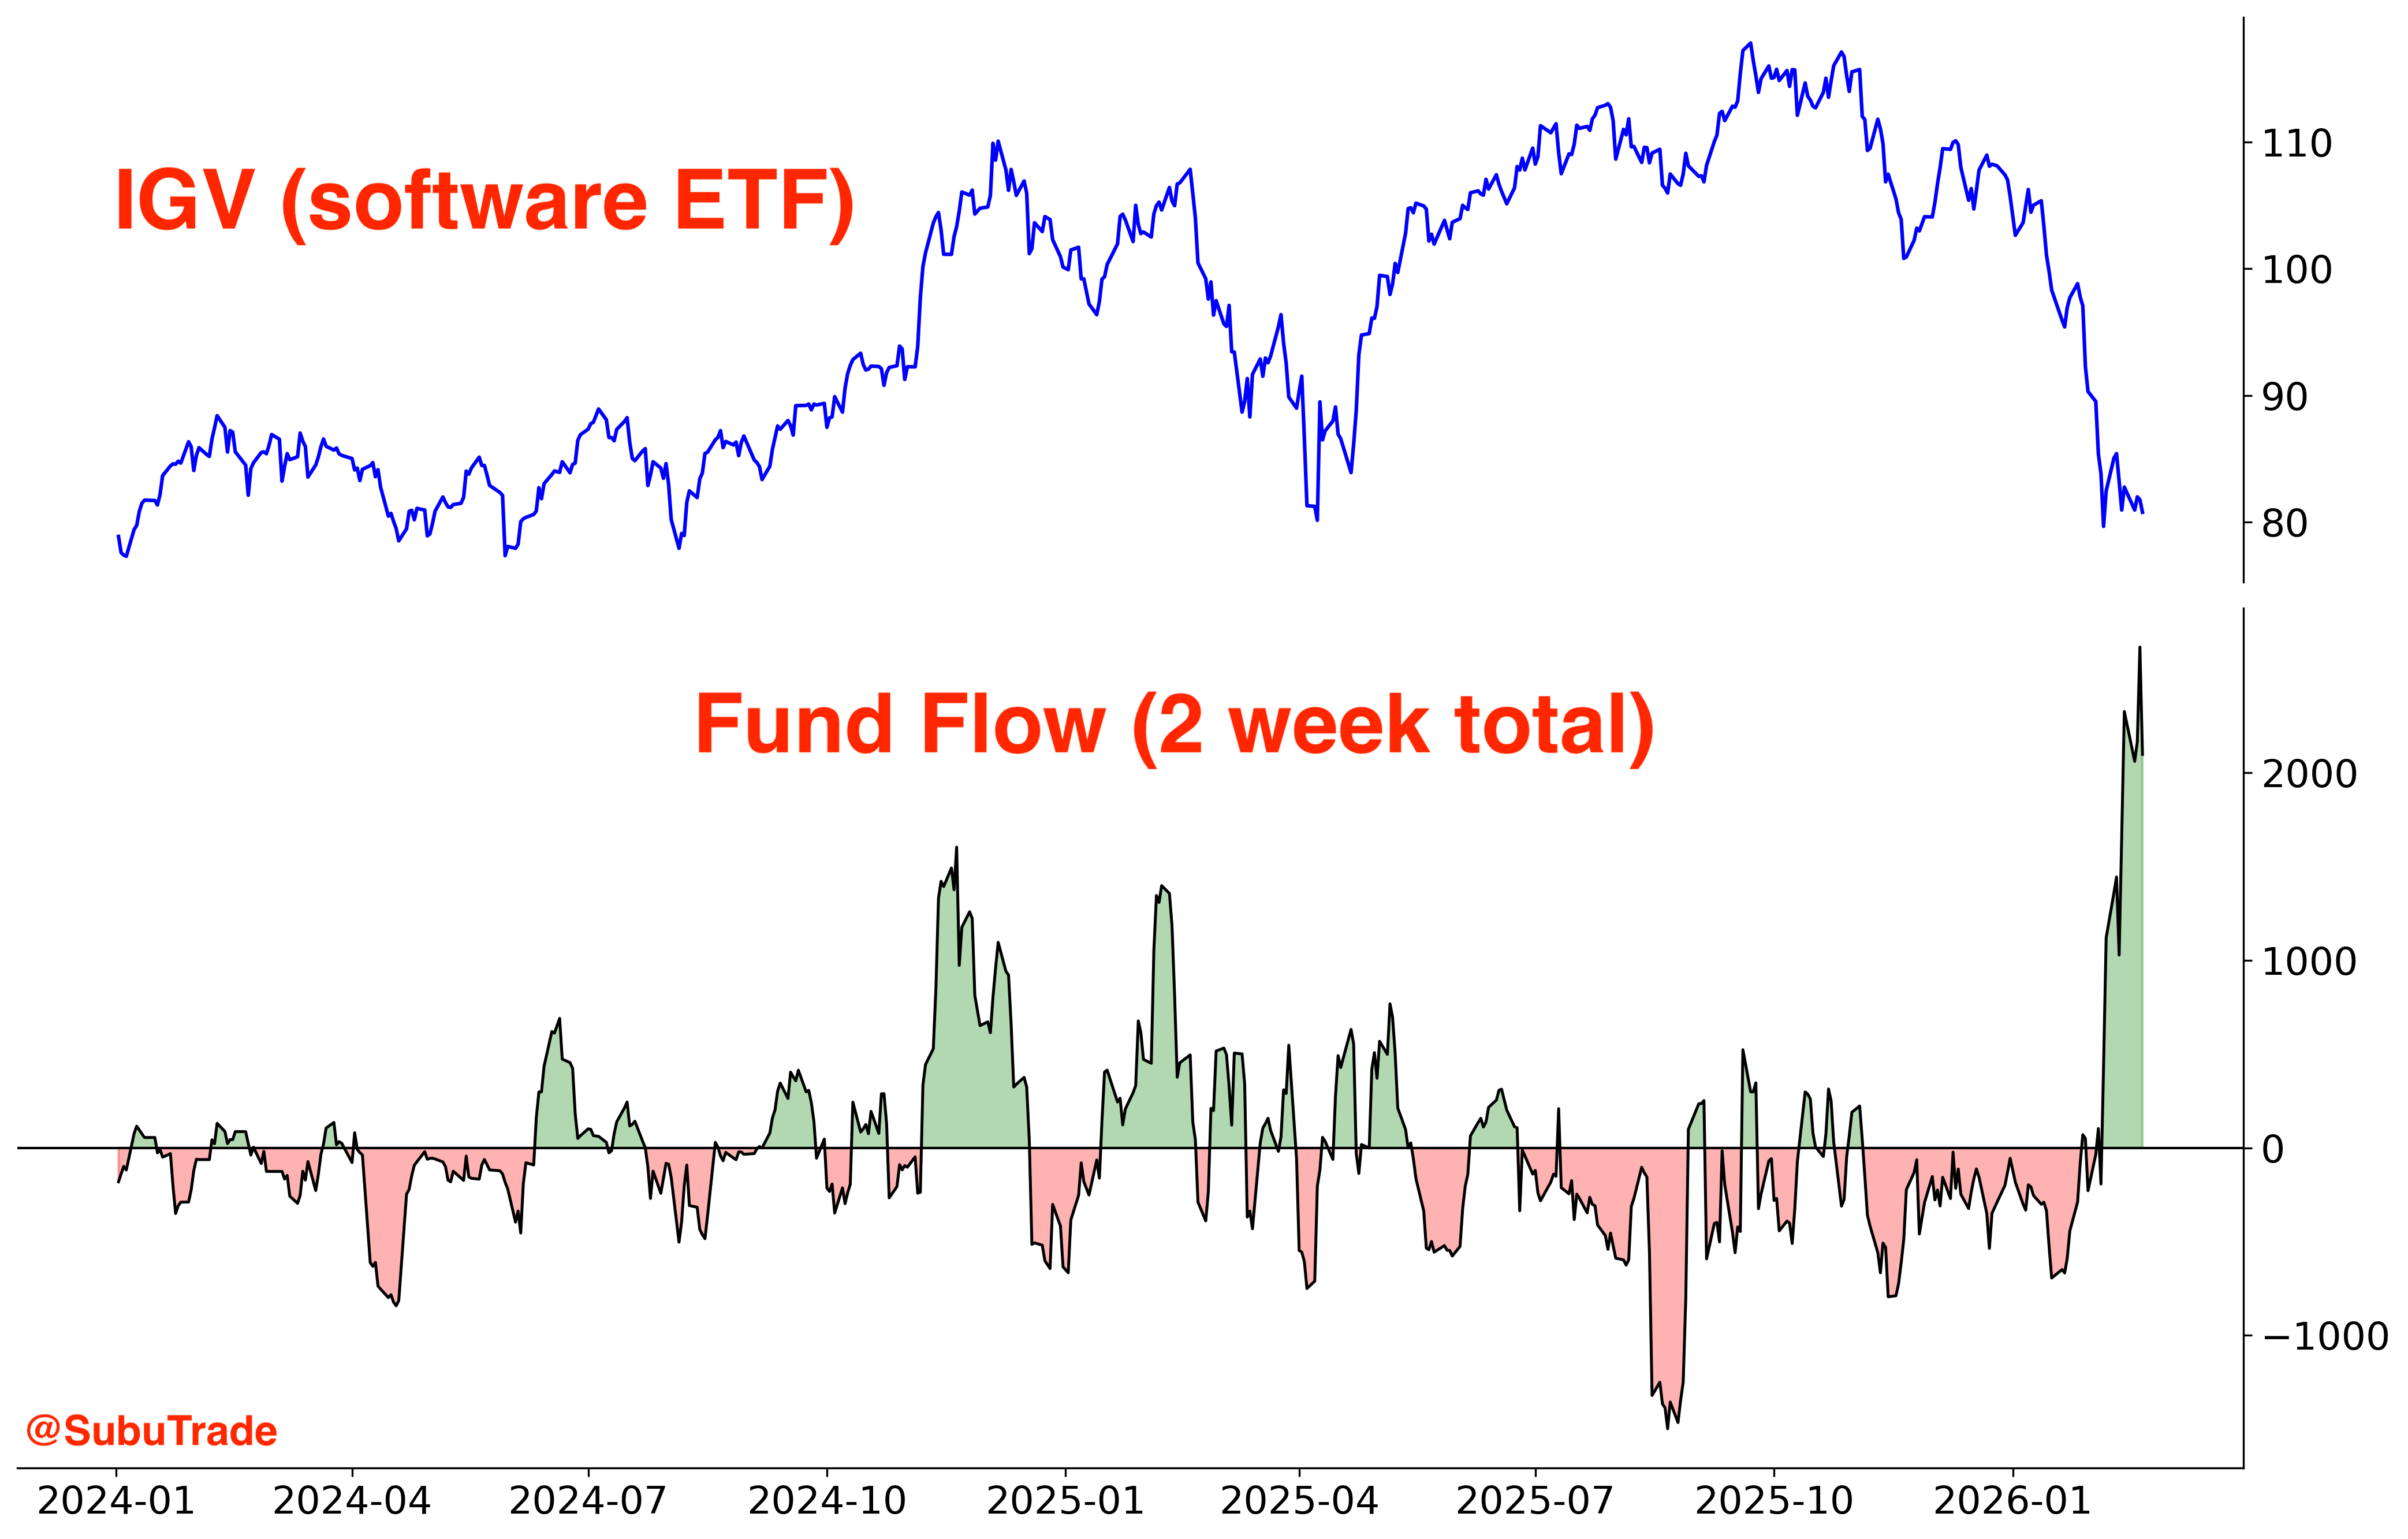
Citadel’s data confirms this: Retail investors have been massive buyers of software names.
This raises an important question: if dip buyers are so aggressive, why haven’t software stocks staged a powerful bounce?
Because Retail buying is being offset by heavy Institutional selling. Institutions are using the bounce to reduce exposure, offloading shares to eager dip buyers.
As a rule of thumb, I’m wary of markets that become deeply oversold but fail to bounce vigorously. This is not a major bearish signal, but it is a warning sign for bulls.
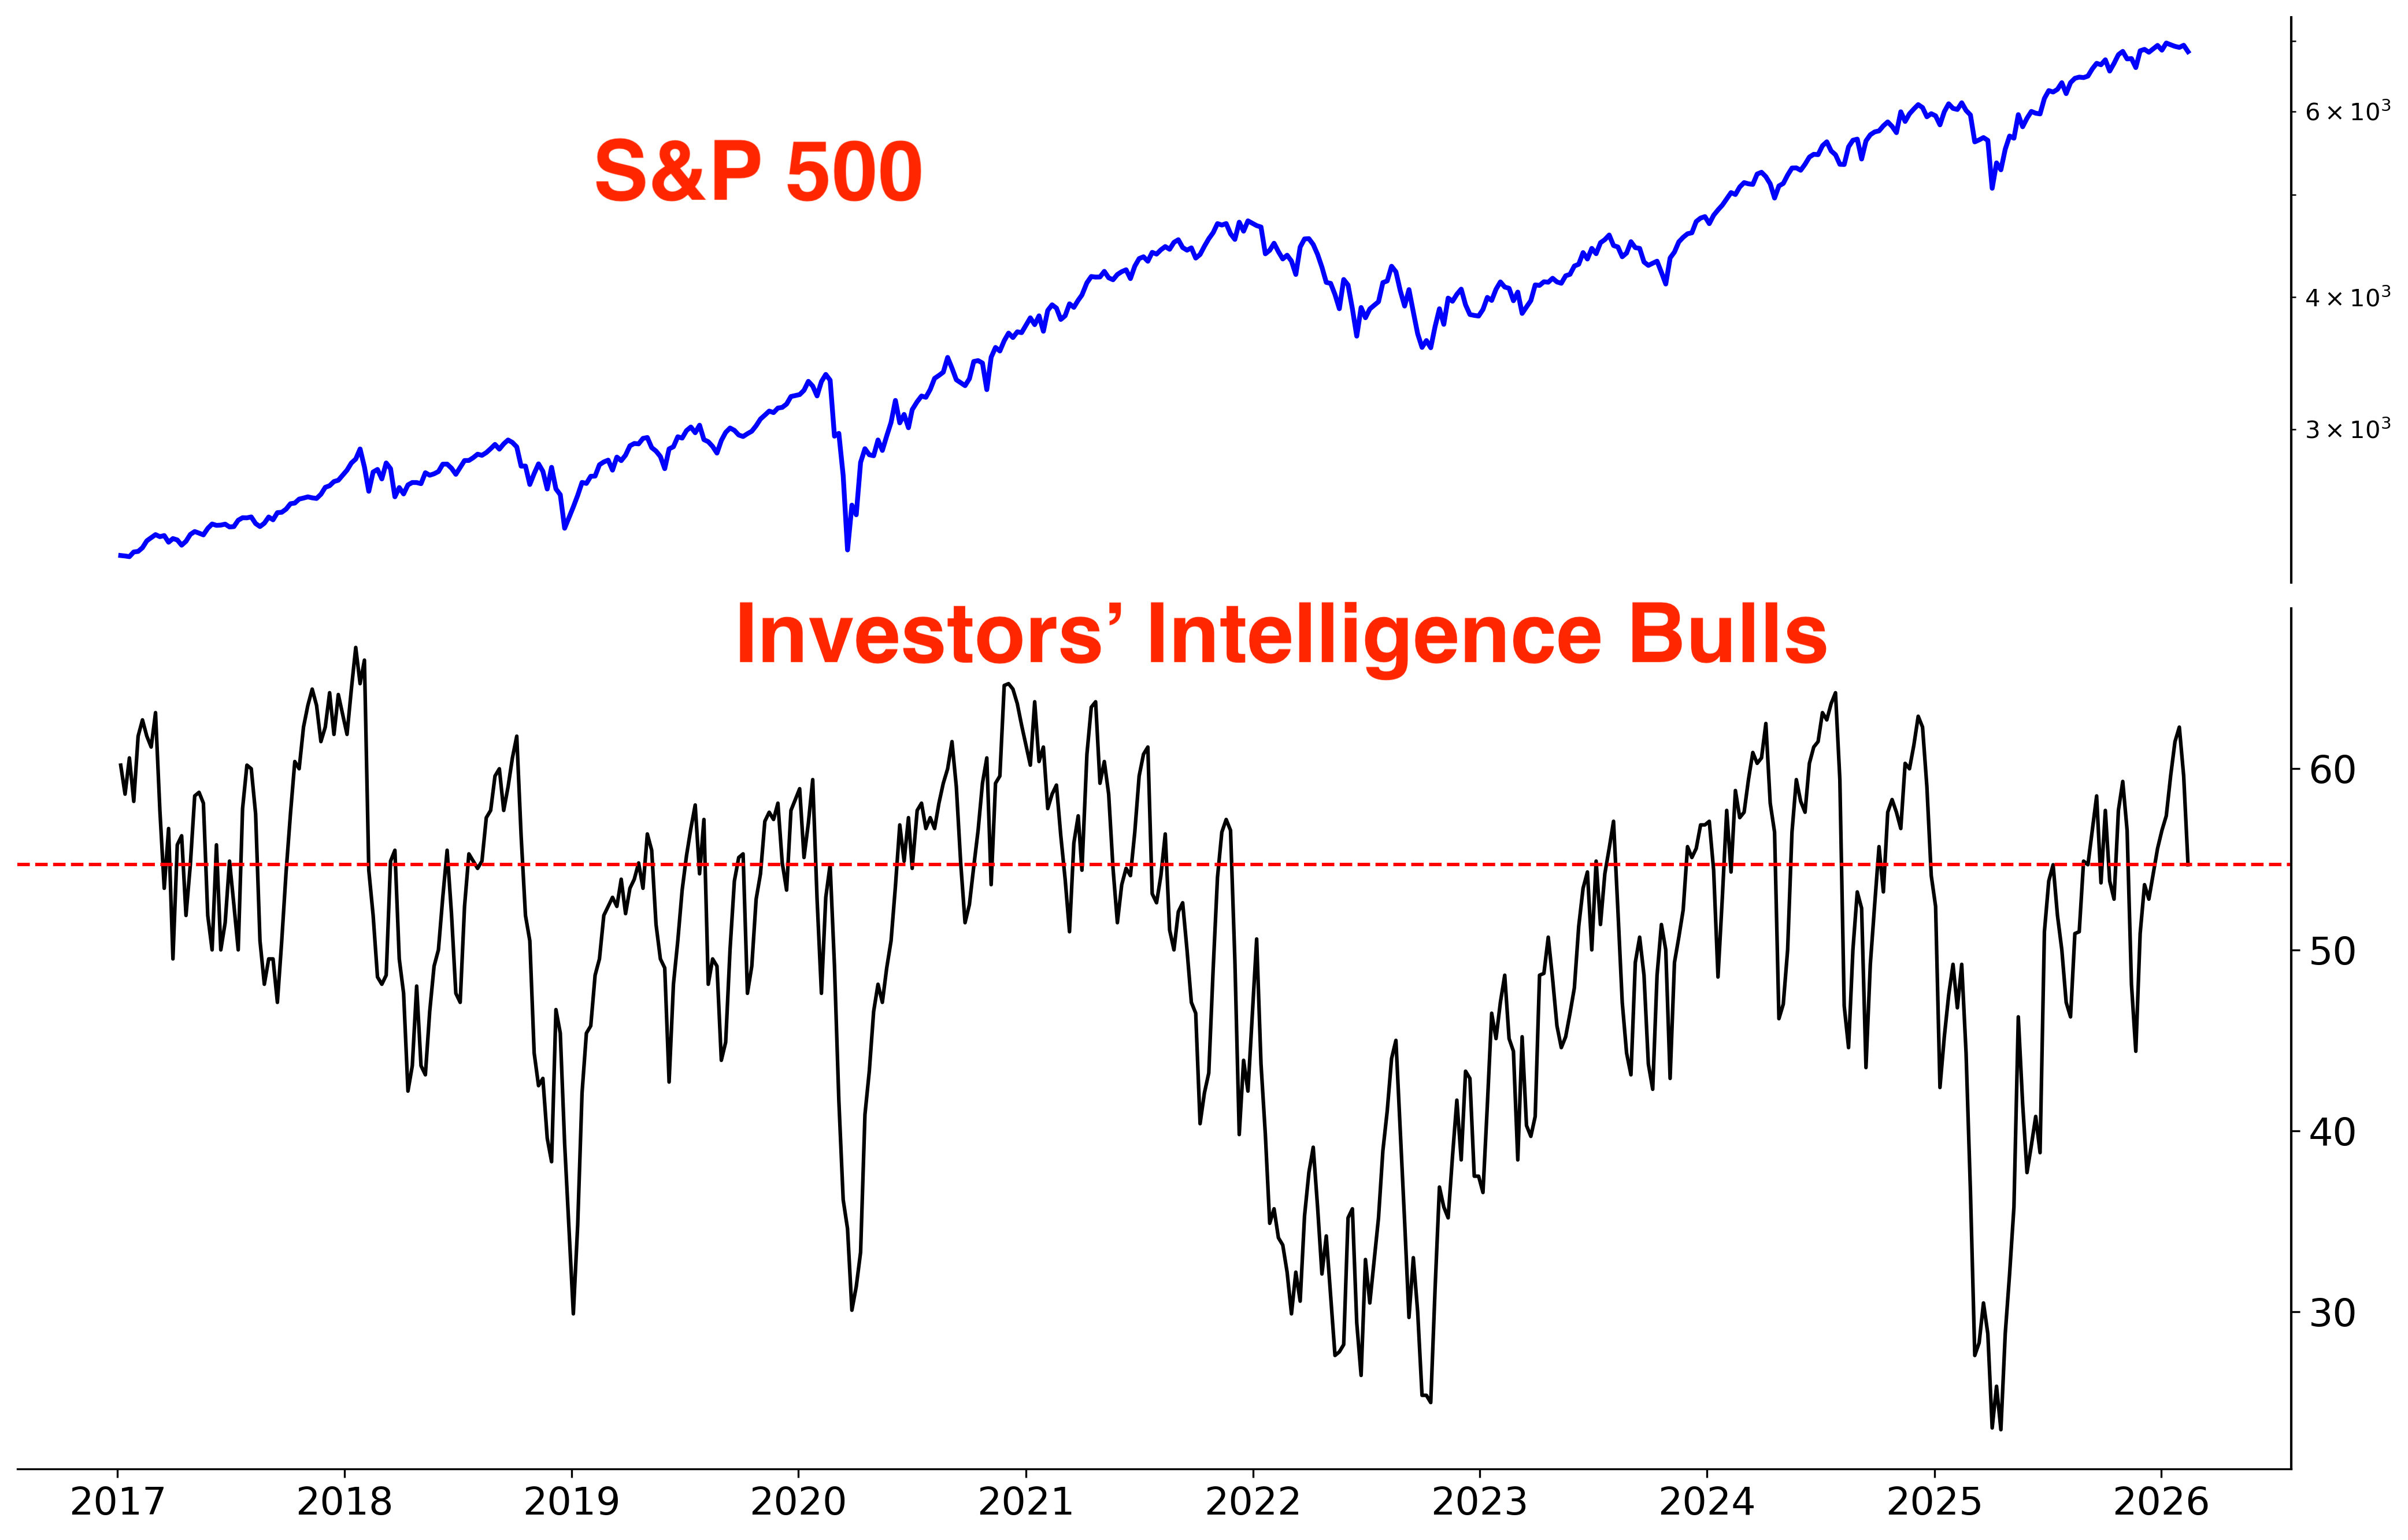
Speaking of bullish Retail, it’s also worth noting that newsletter writers are still bullish, according to the Investors’ Intelligence sentiment survey.
In a long bull market, Retail traders and newsletter sellers get conditioned to buy every dip, like Pavlov’s Dog. It works… until the day it doesn’t.
Software stocks are deeply depressed right now, and Bitcoin isn’t far behind.
Bitcoin sentiment has fallen to levels last seen in 2022–2023, when Bitcoin was building a long, wide base.
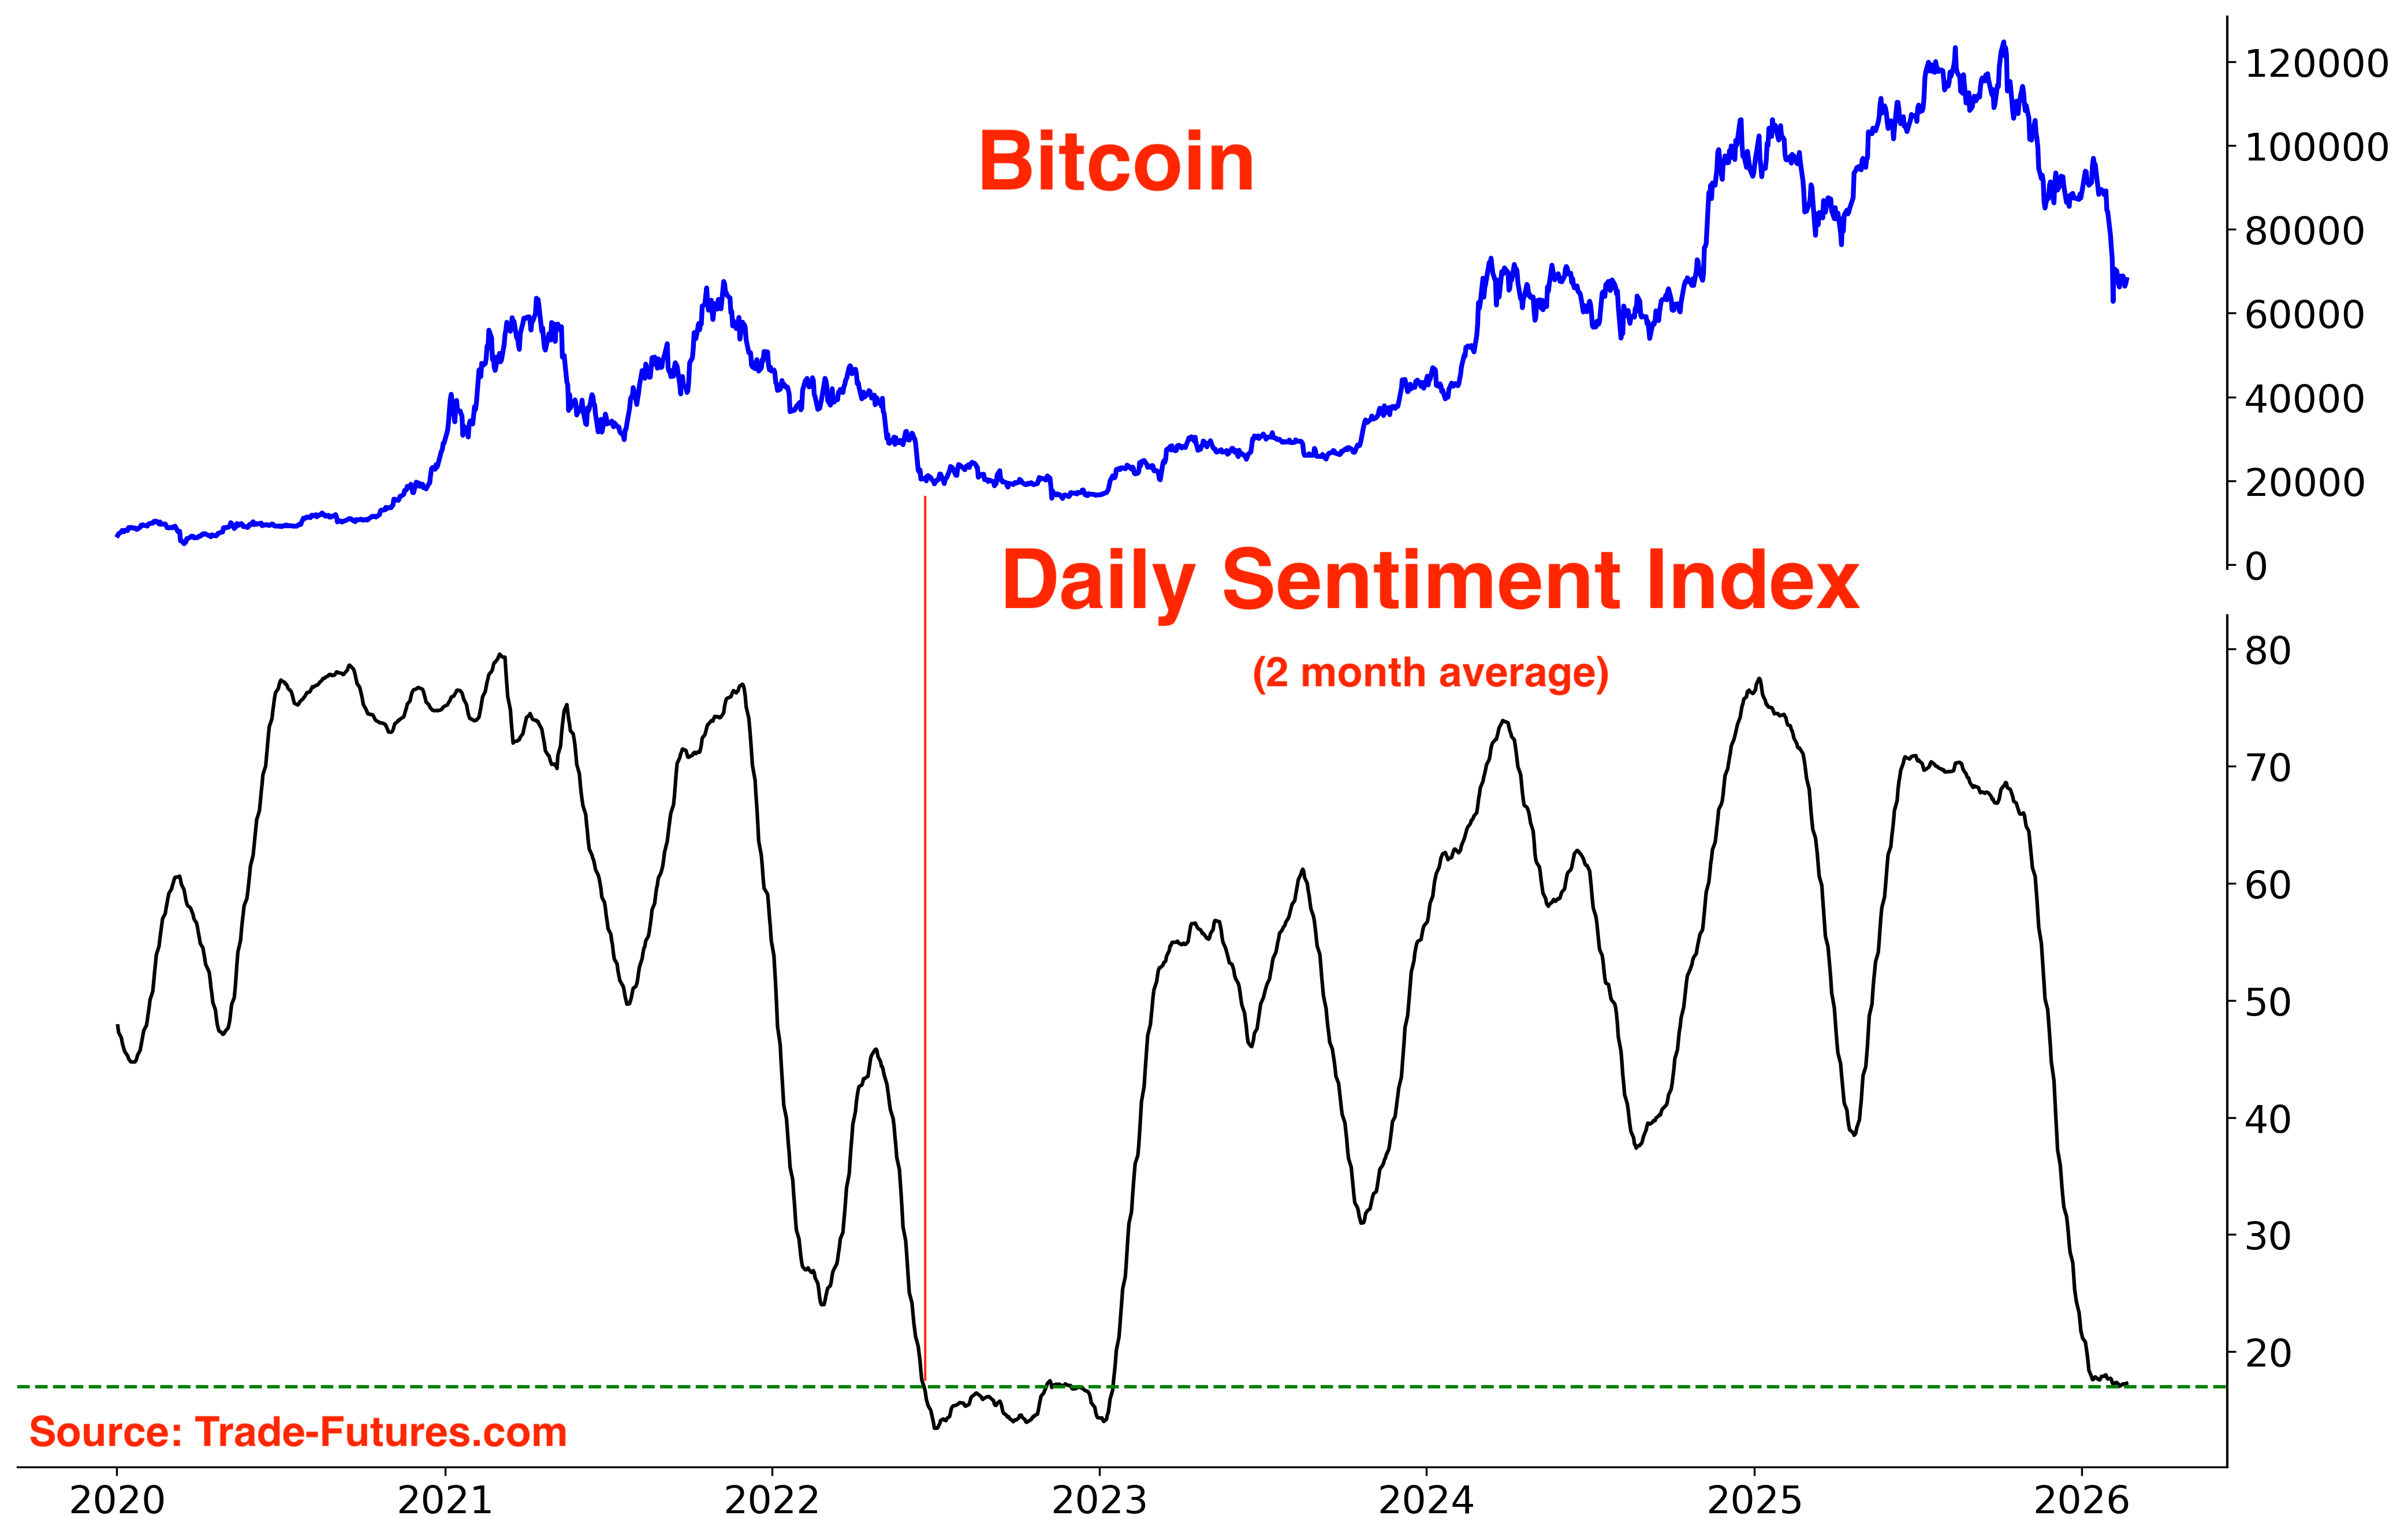
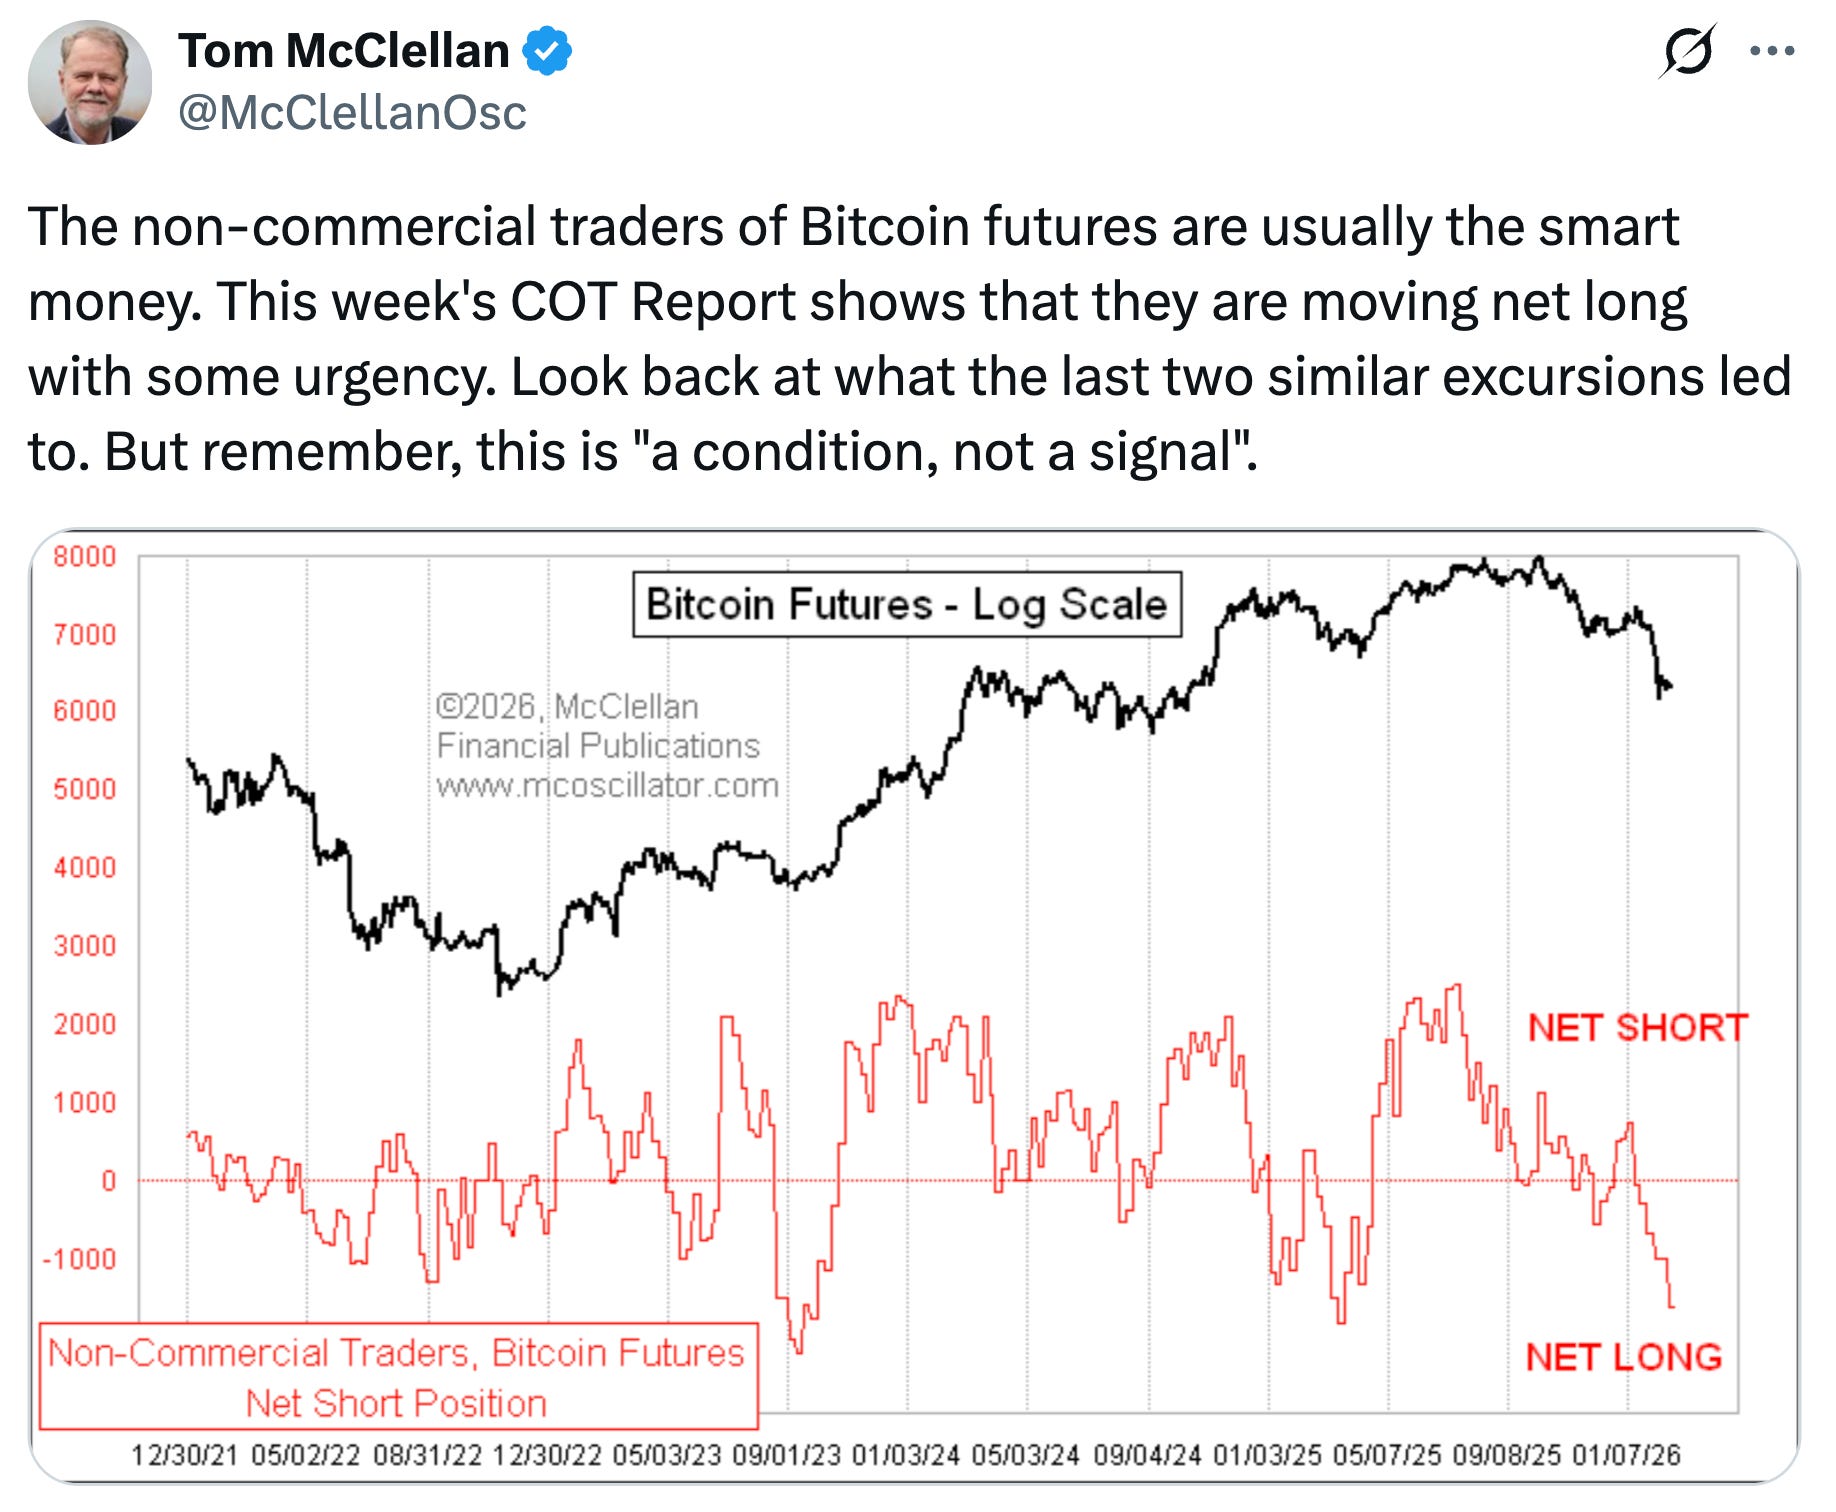
If we get a bounce in software, we’ll probably get a bounce in Bitcoin as well. From Tom McClellan:
What’s been bought
Software and tech have weighed down the S&P 500. As investors reduced exposure to software and tech, capital rotated into smaller, previously lagging areas of the market.
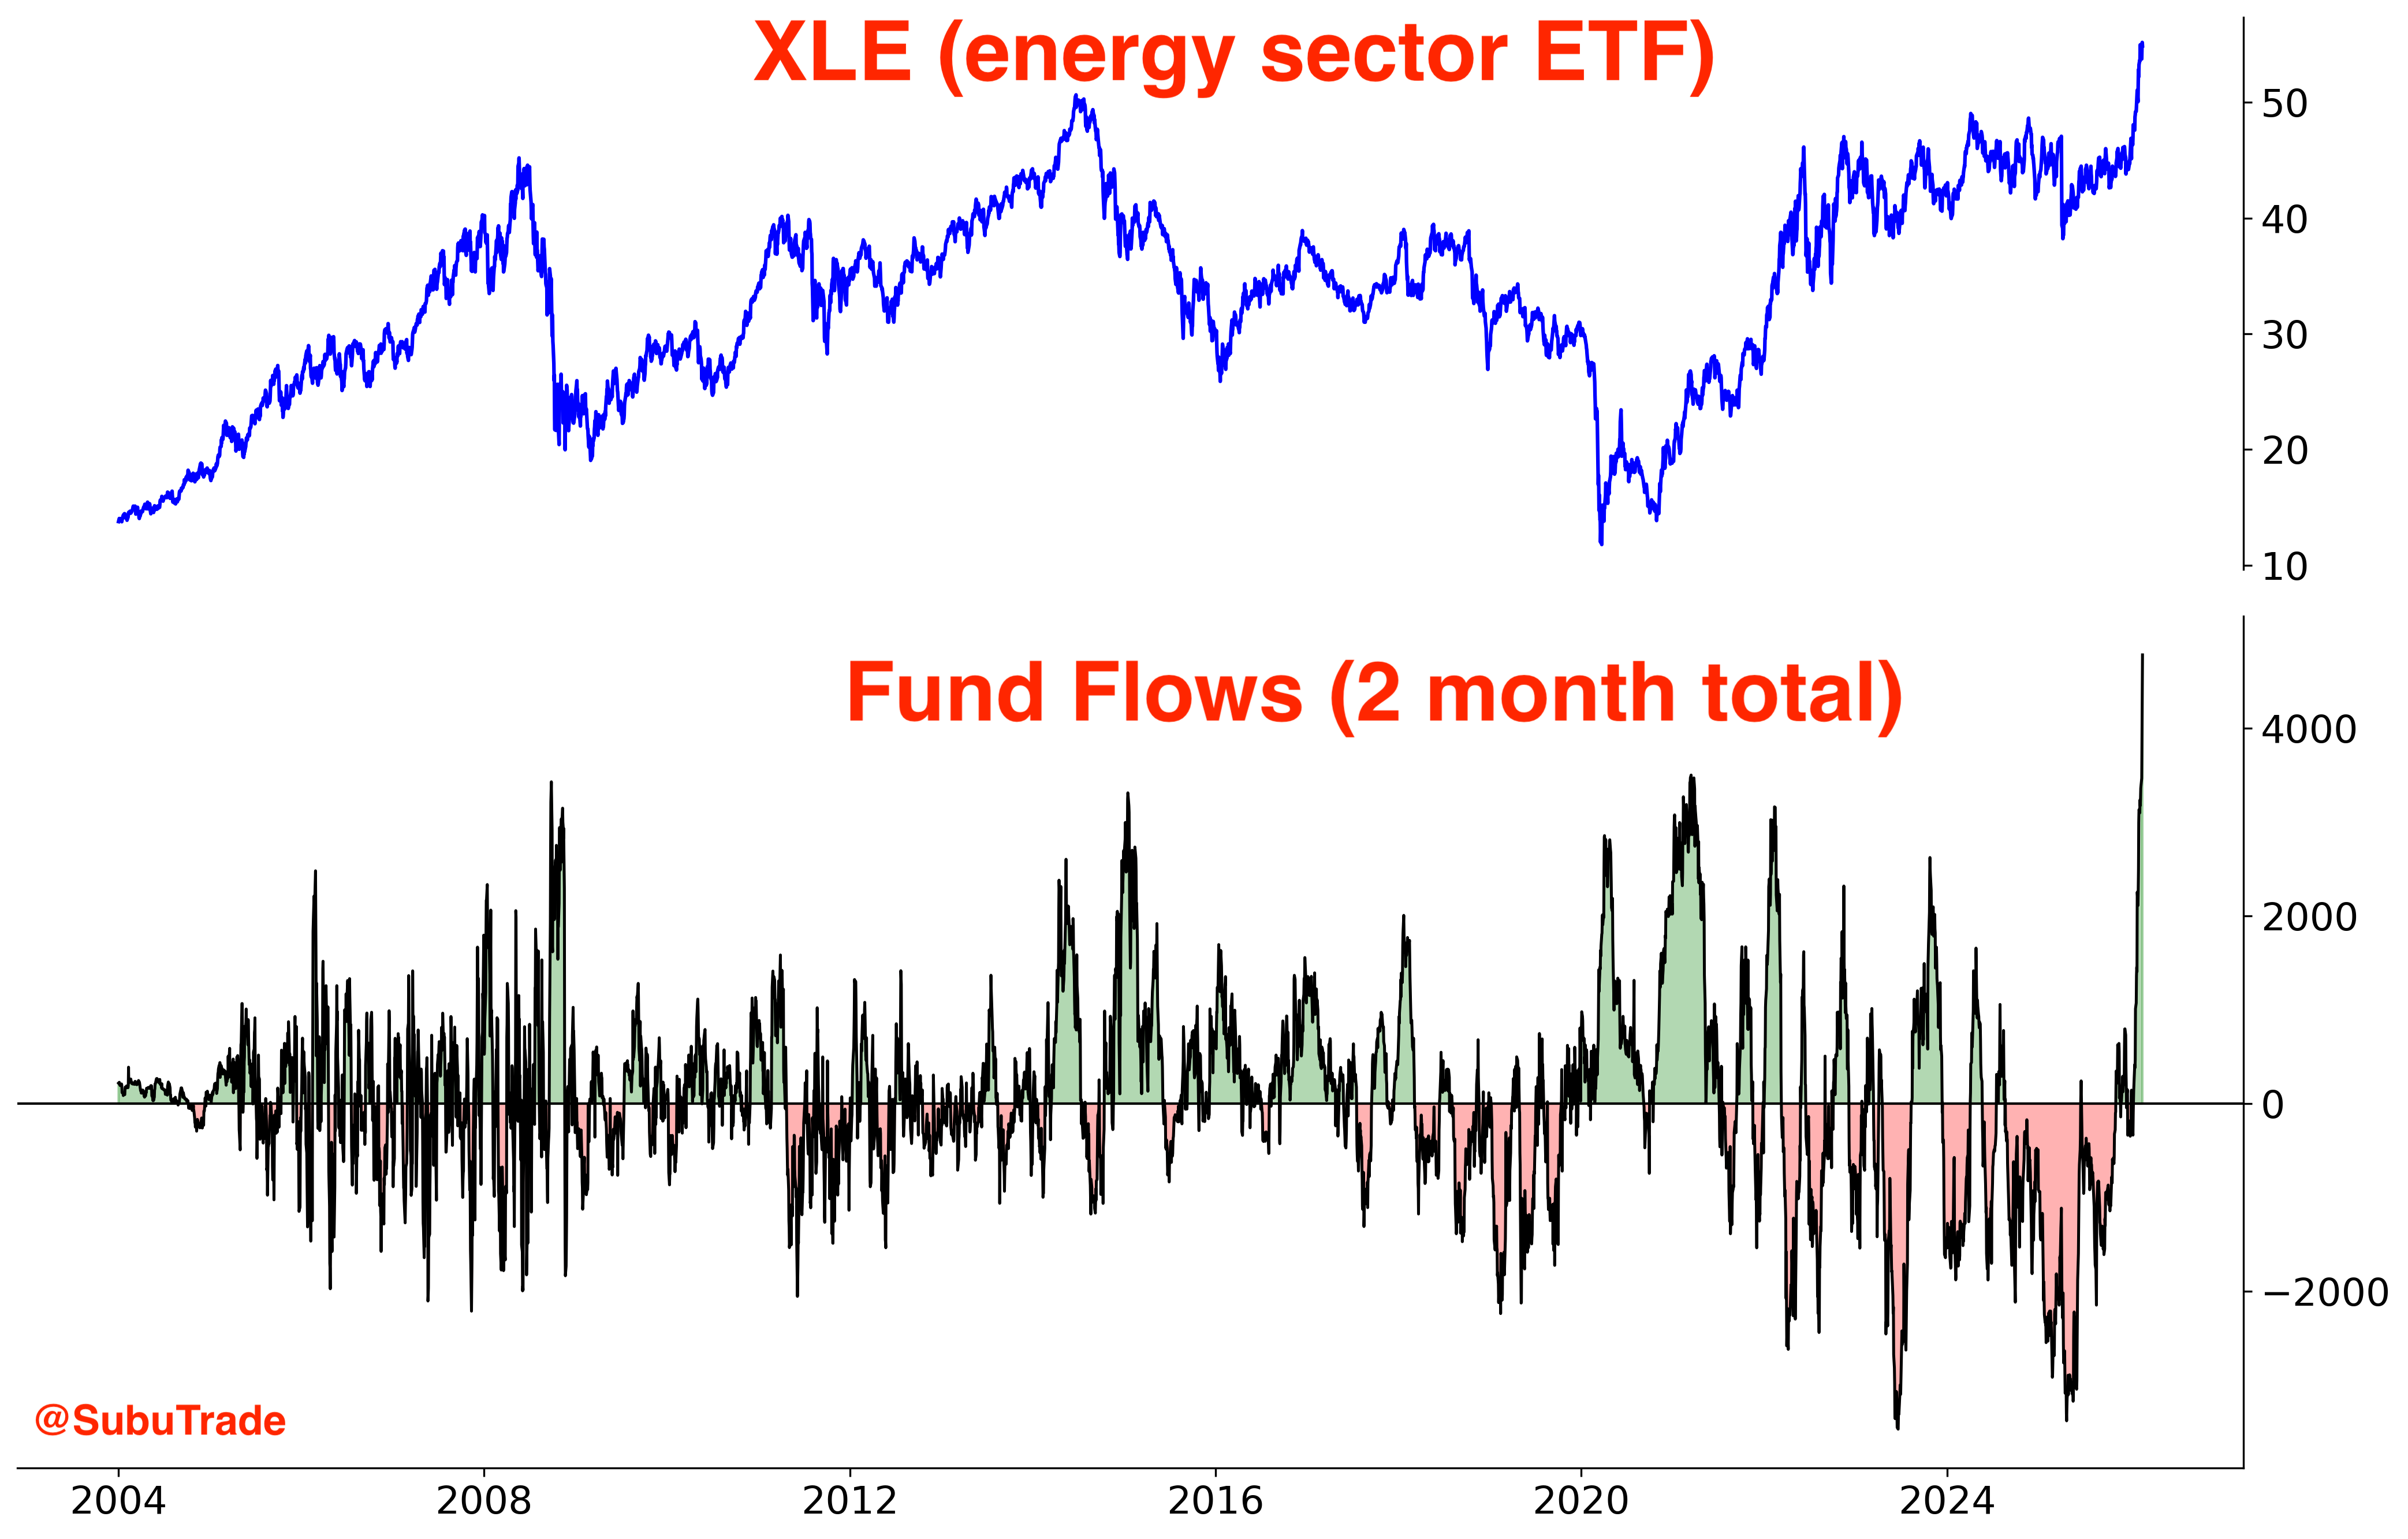
Energy:
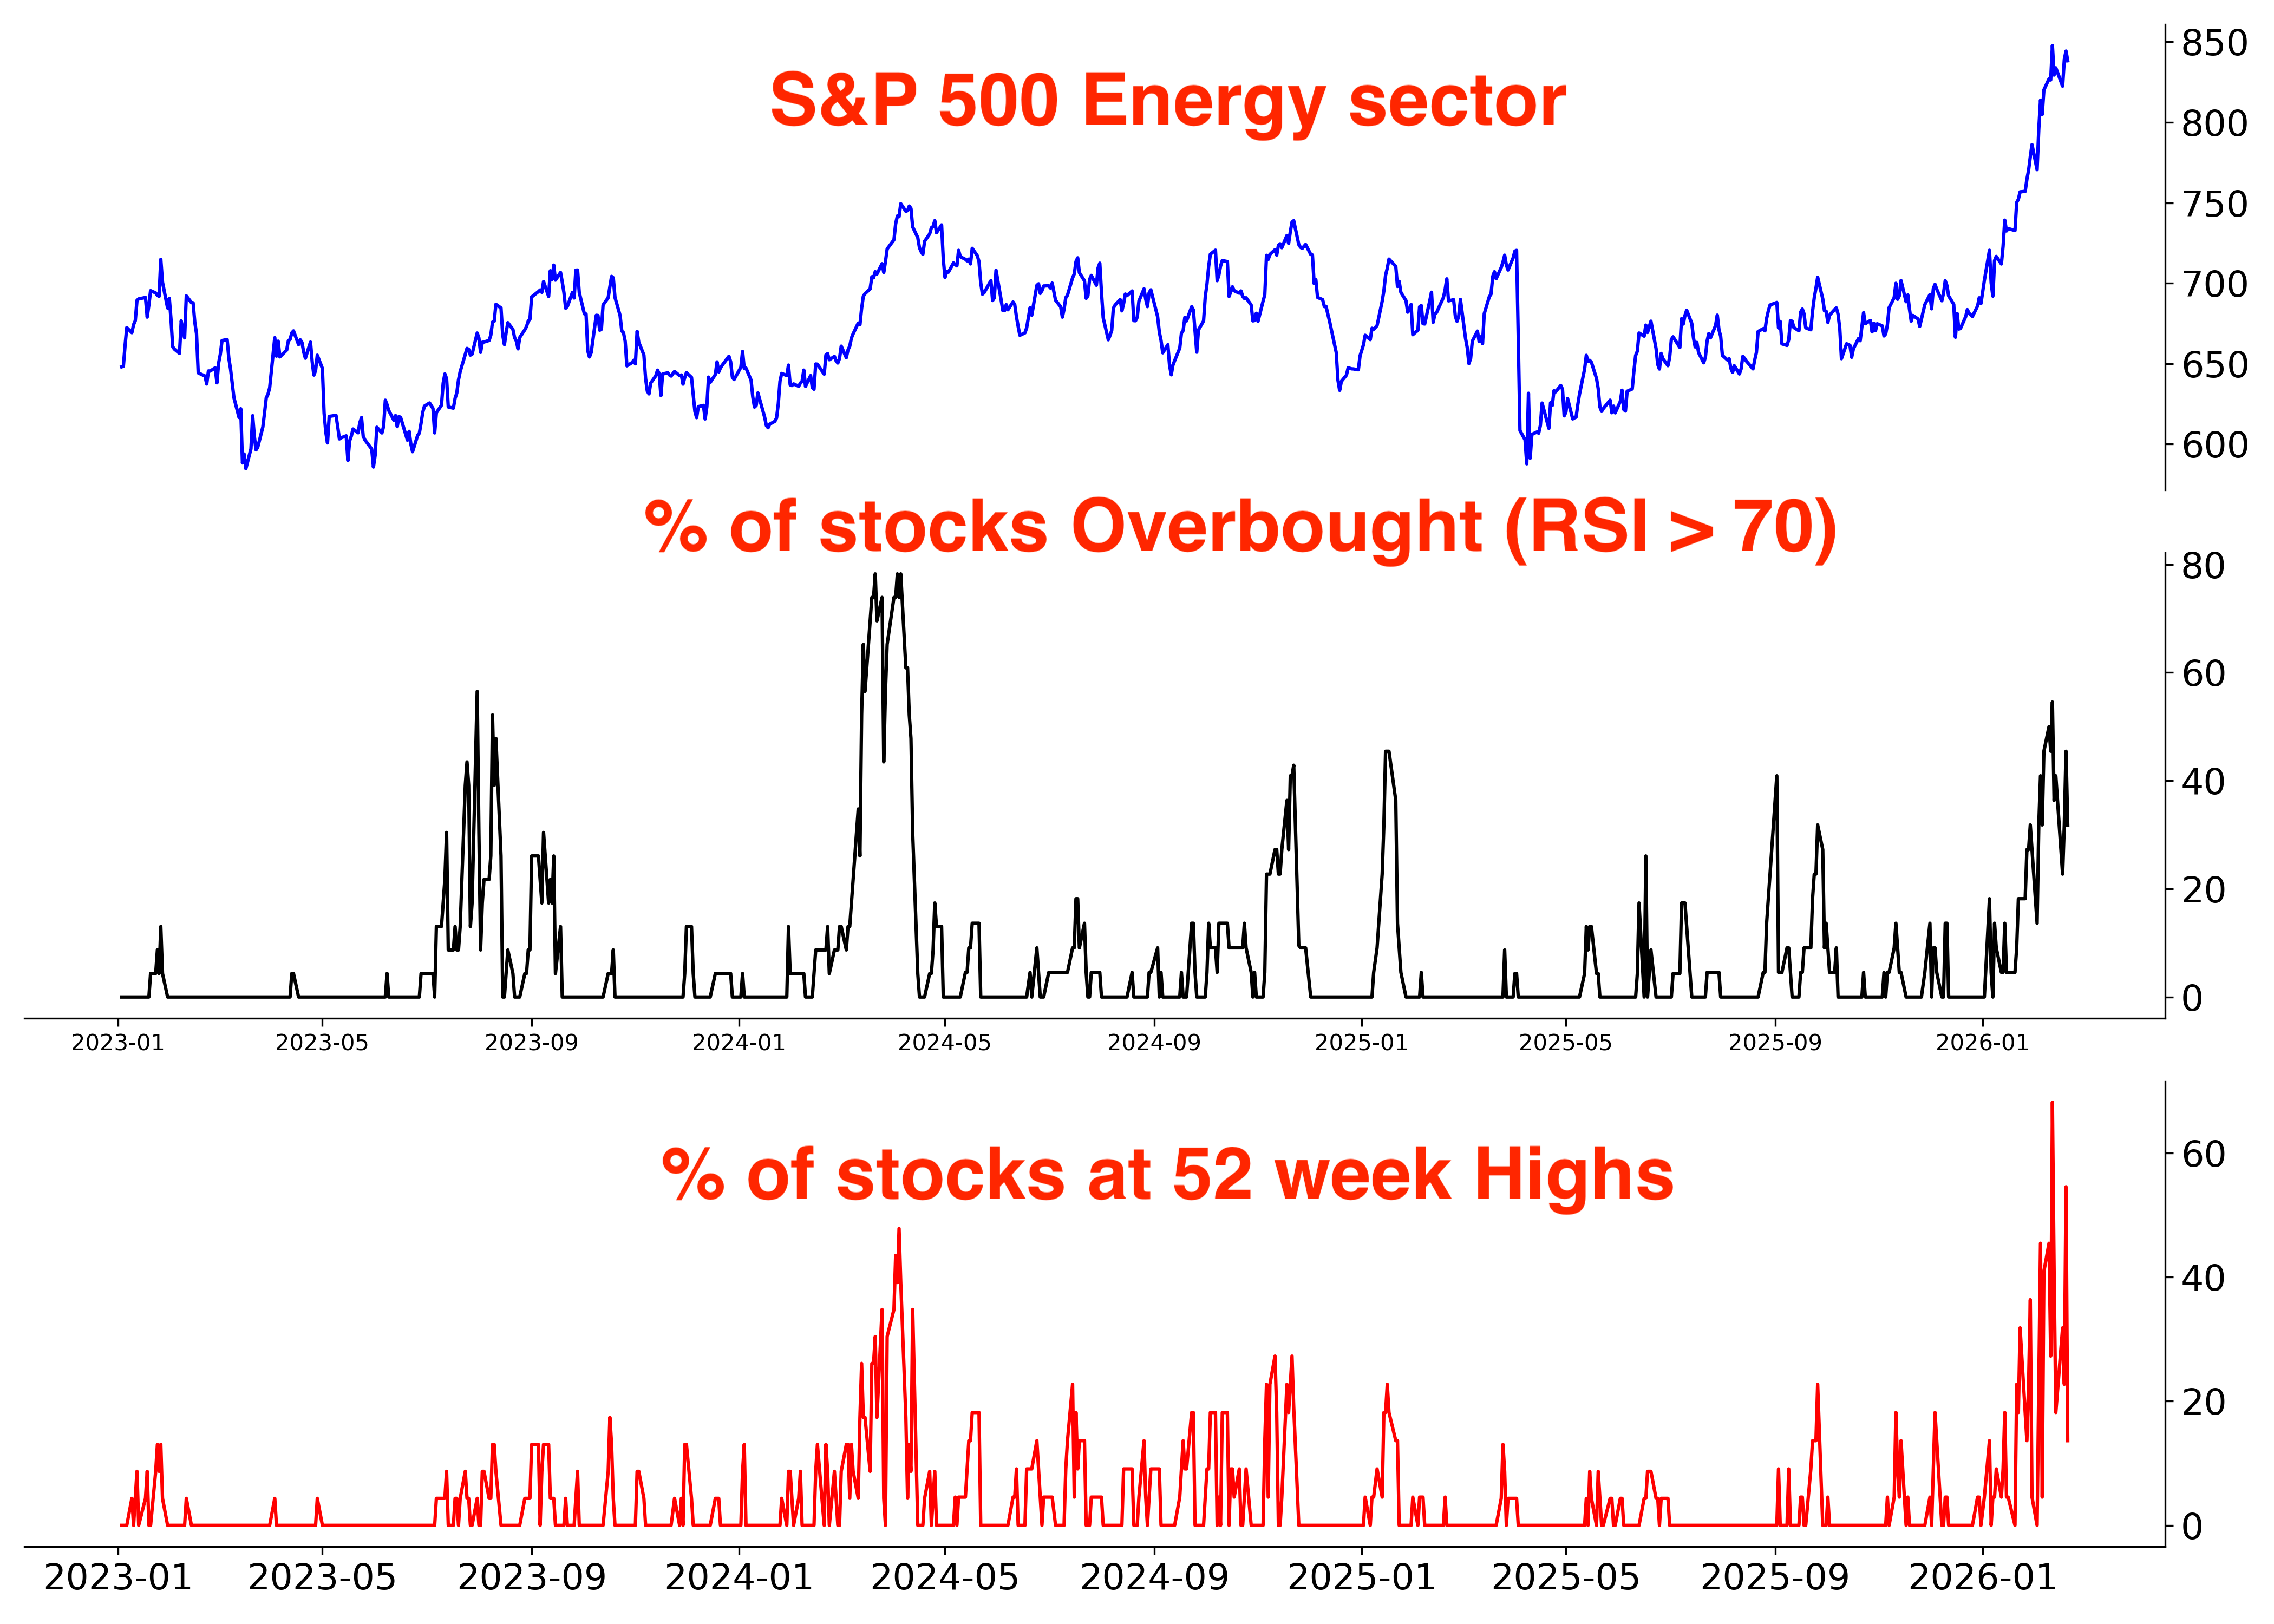
Energy flows:
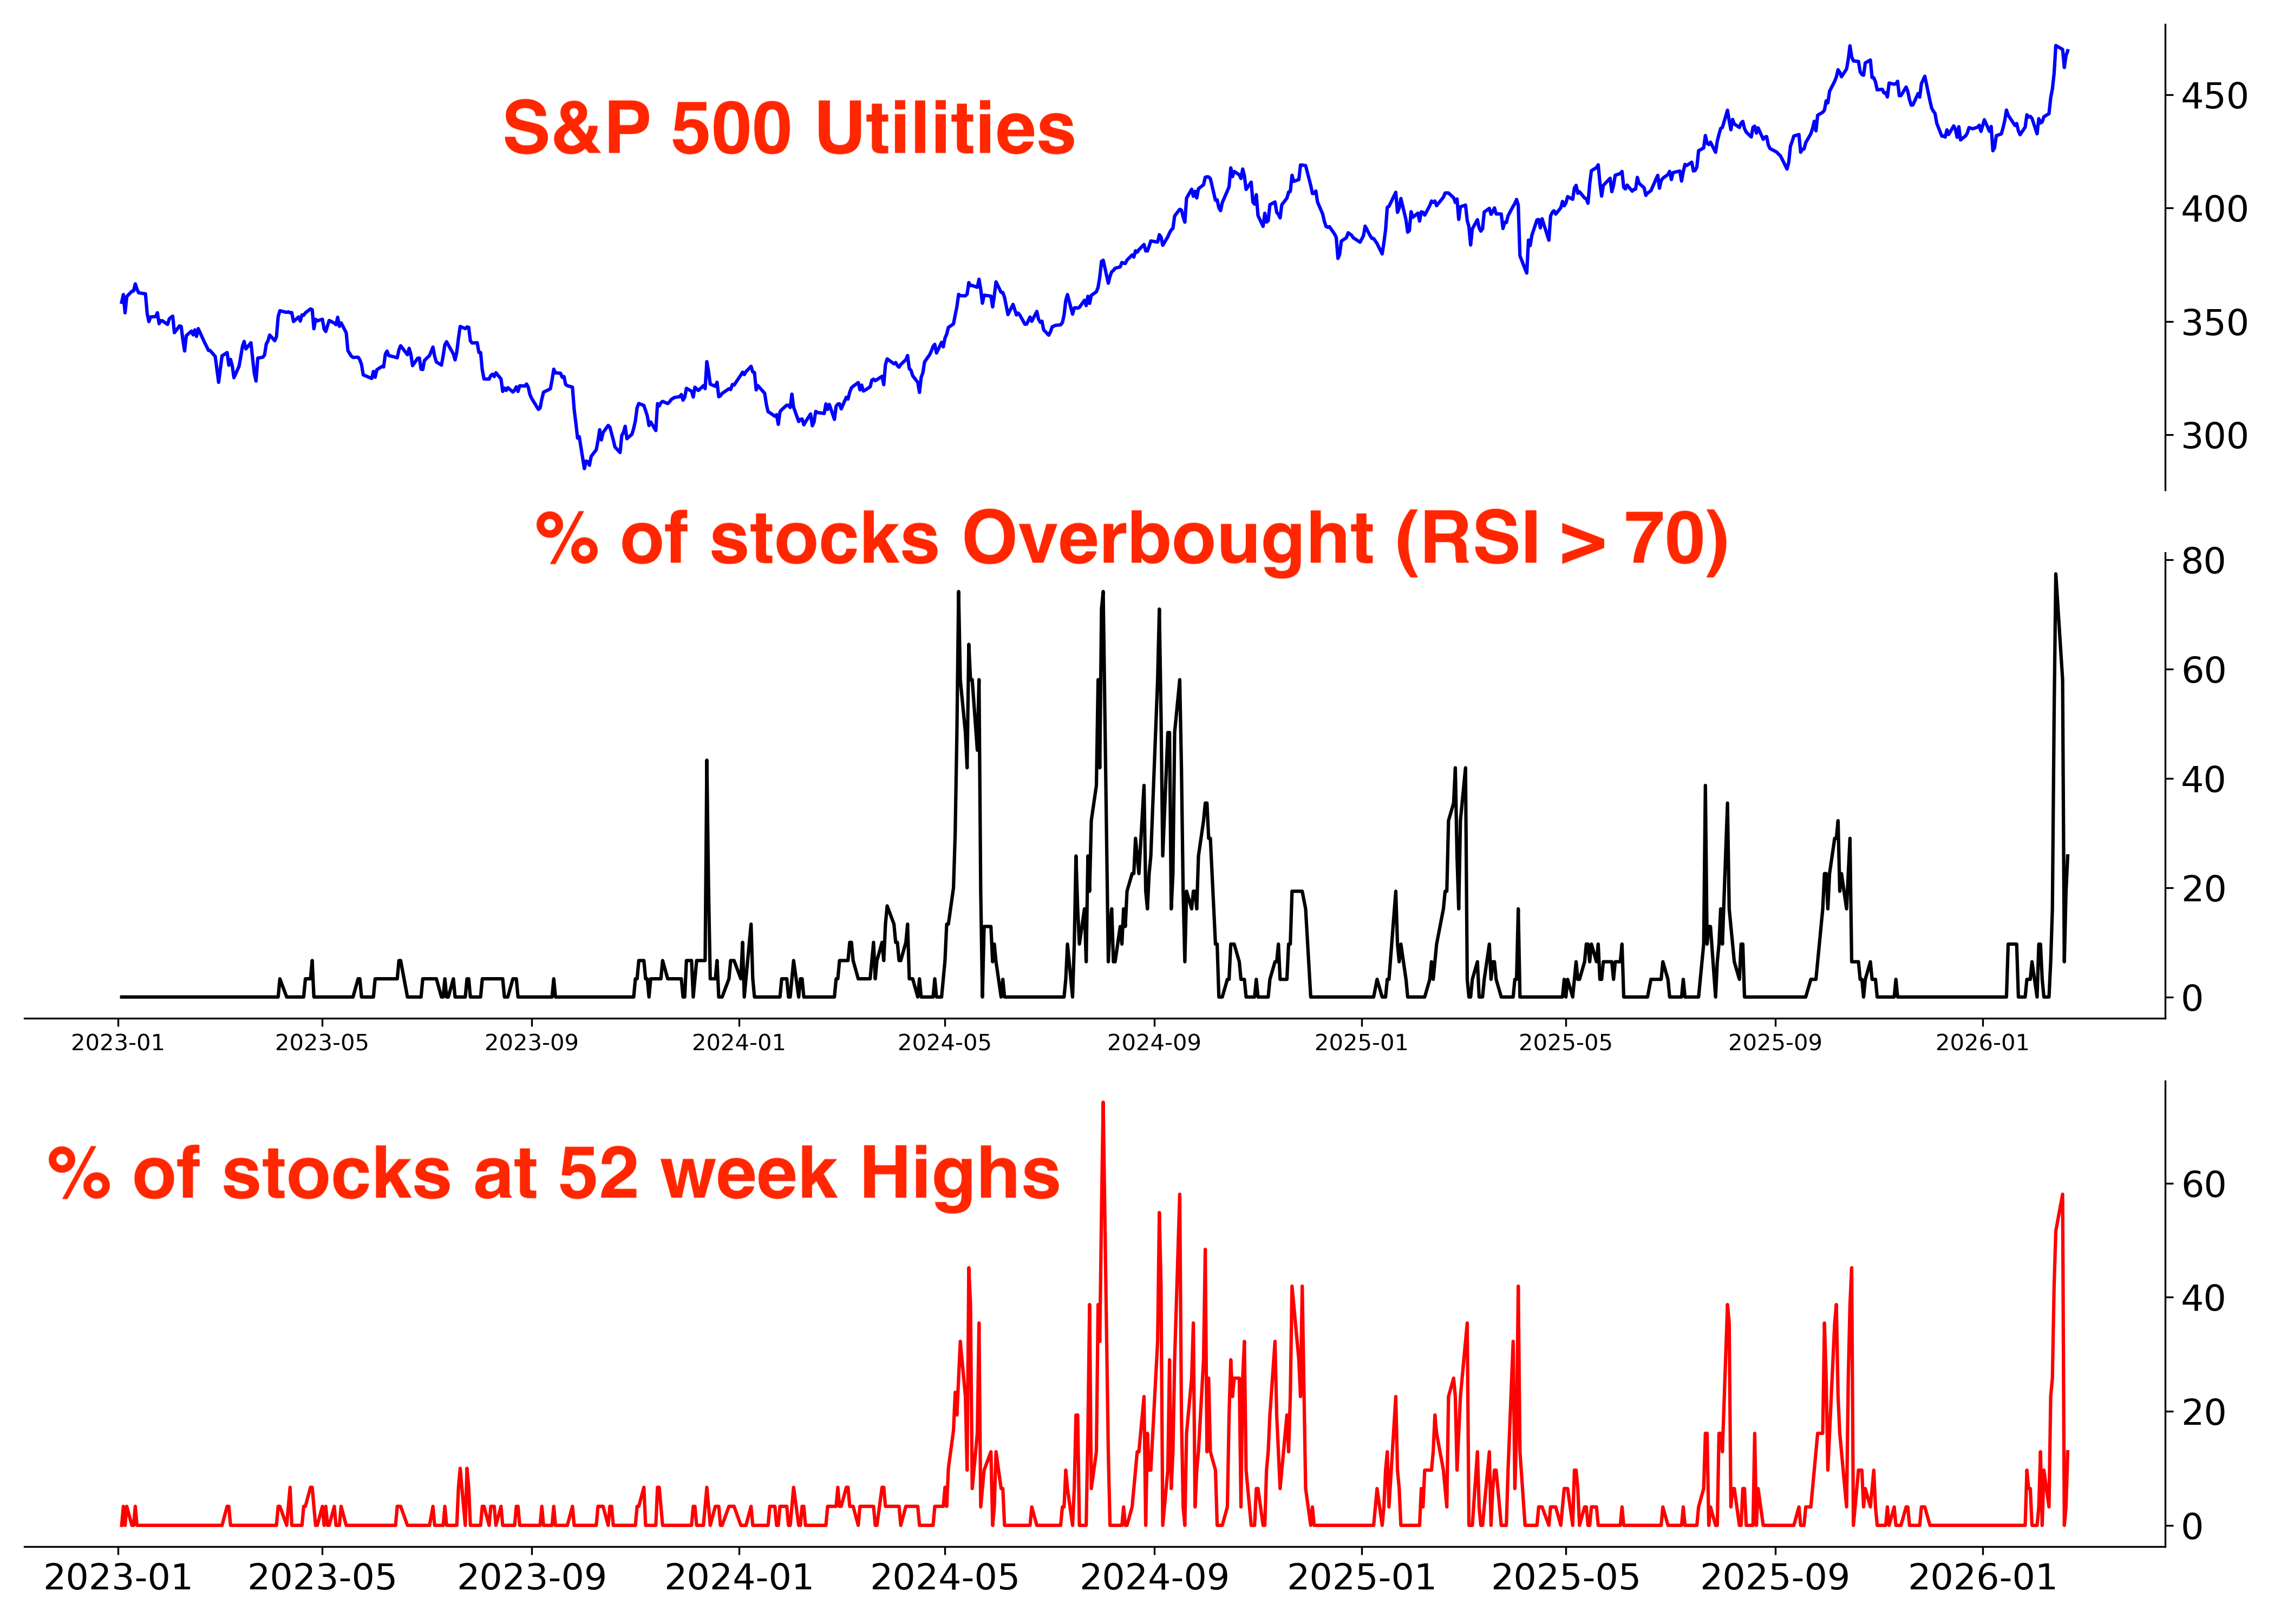
Utilities:
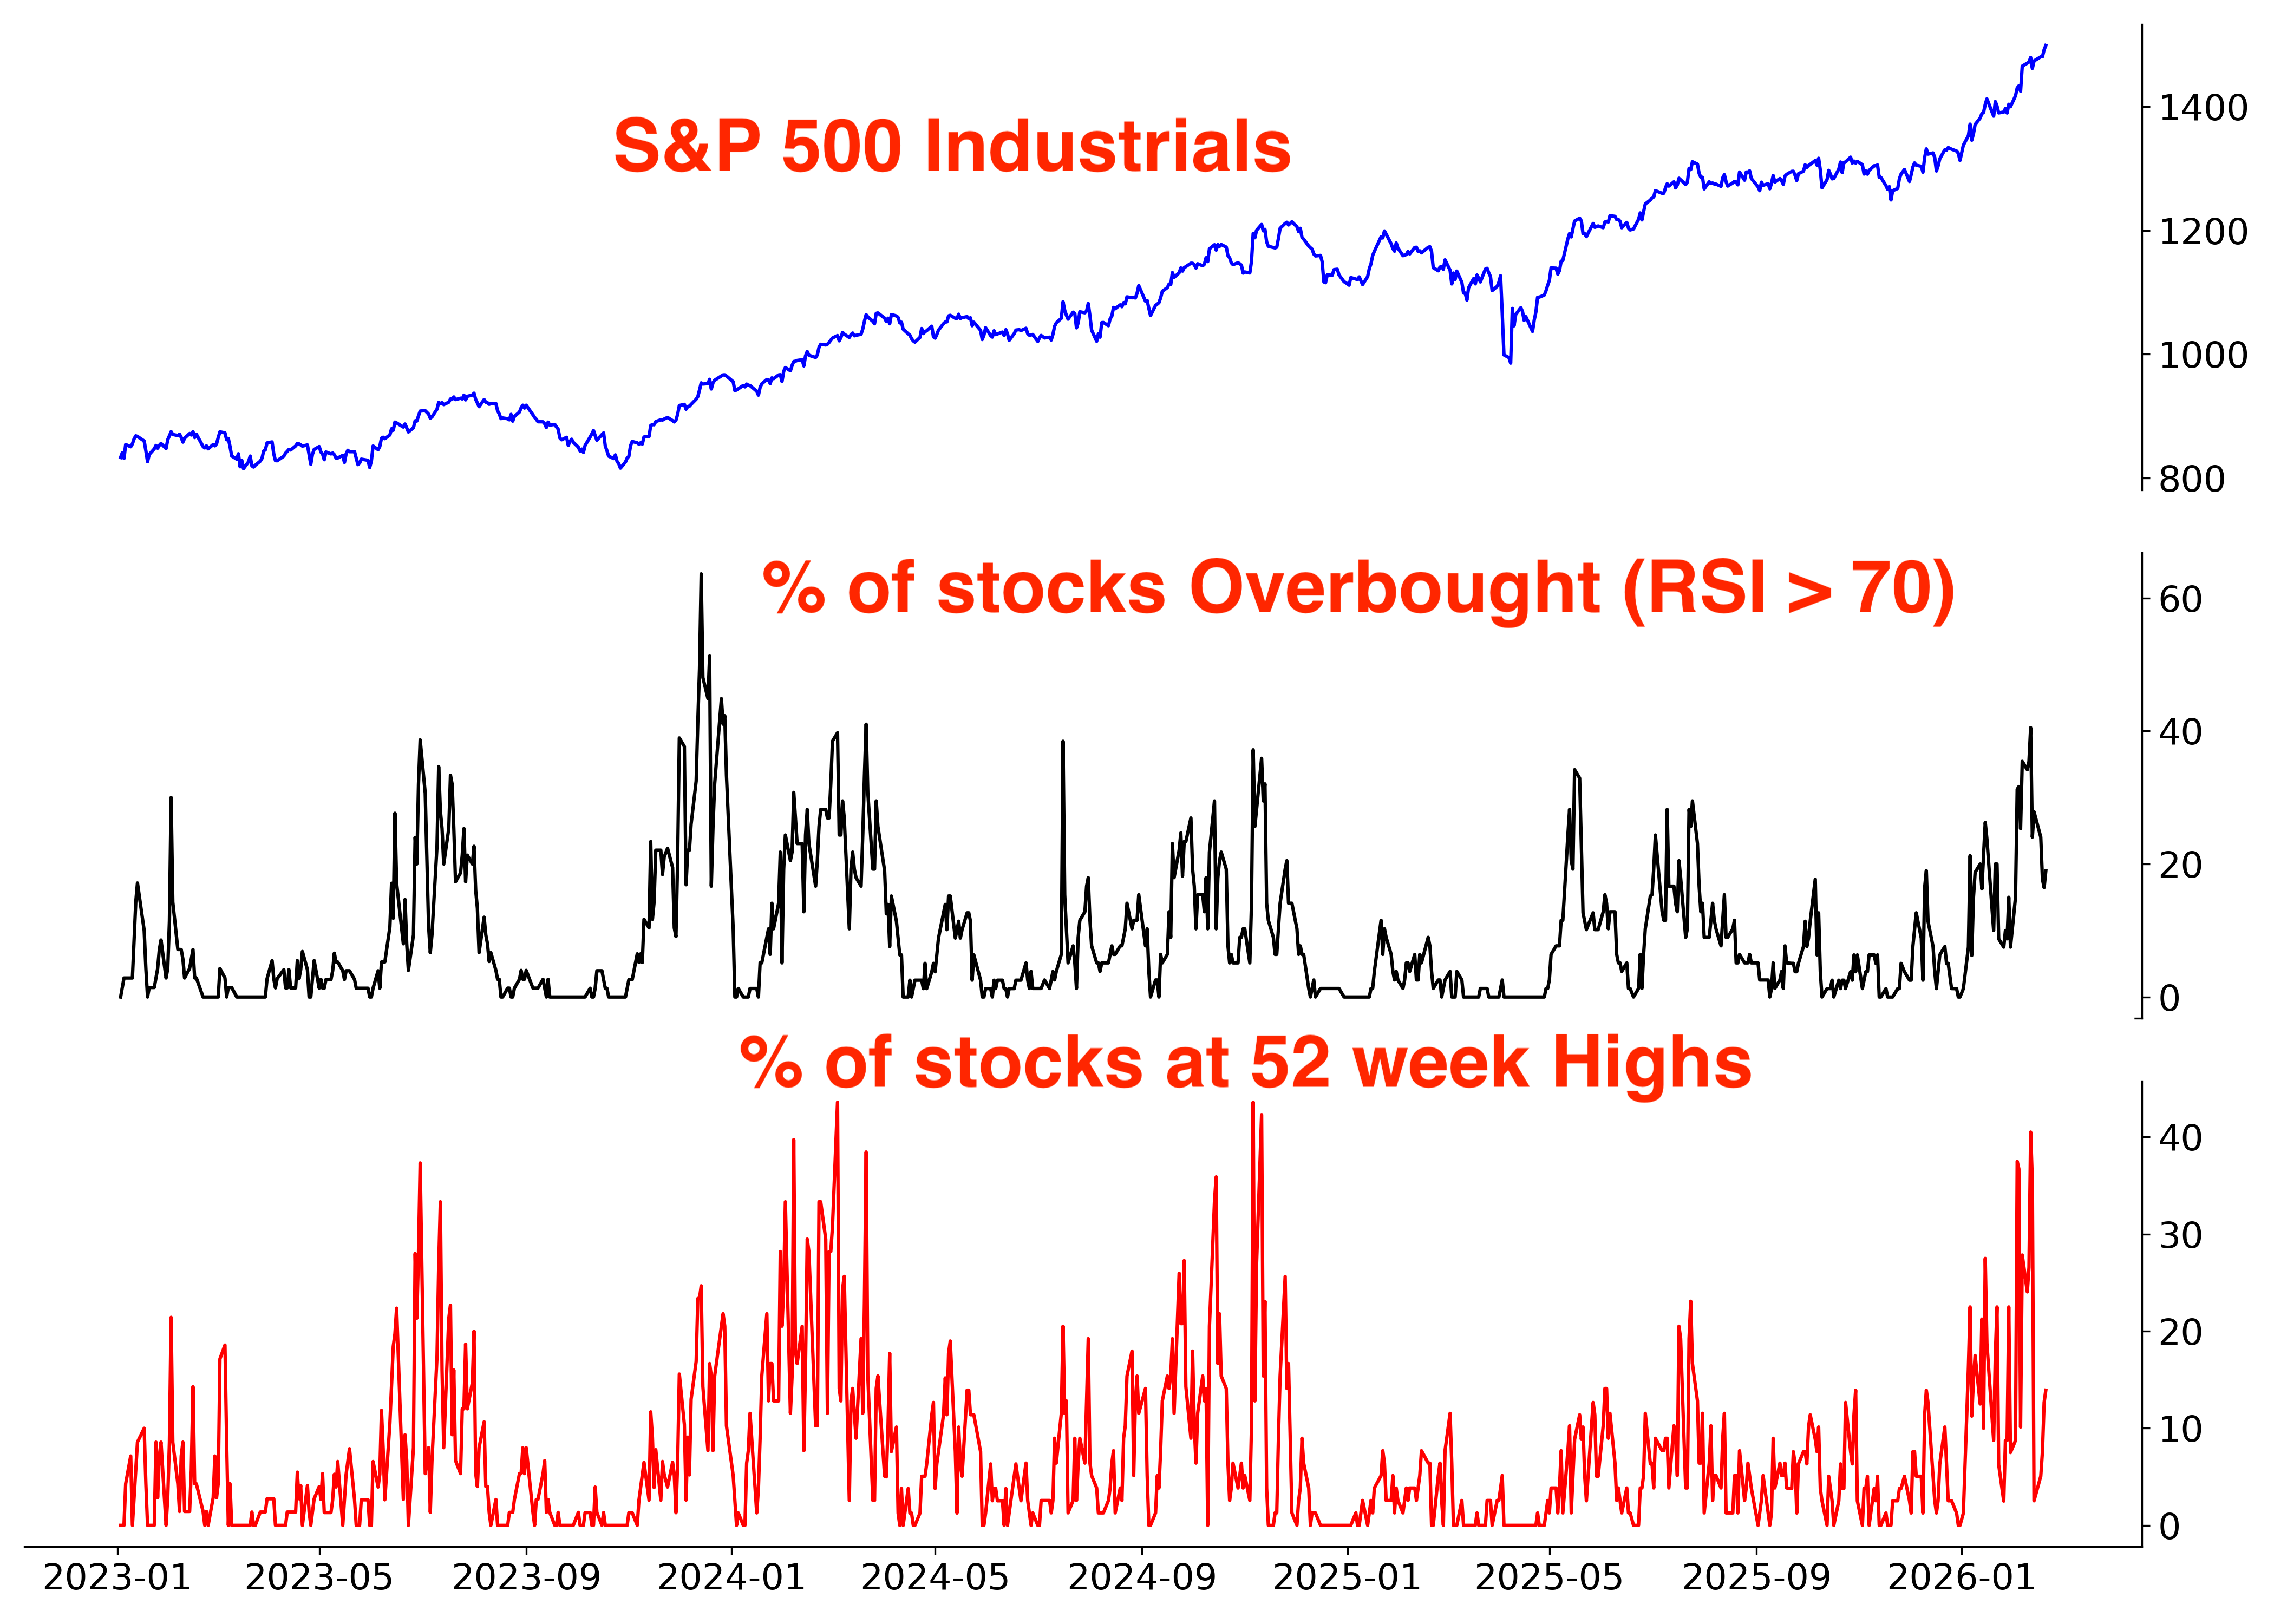
Industrials:
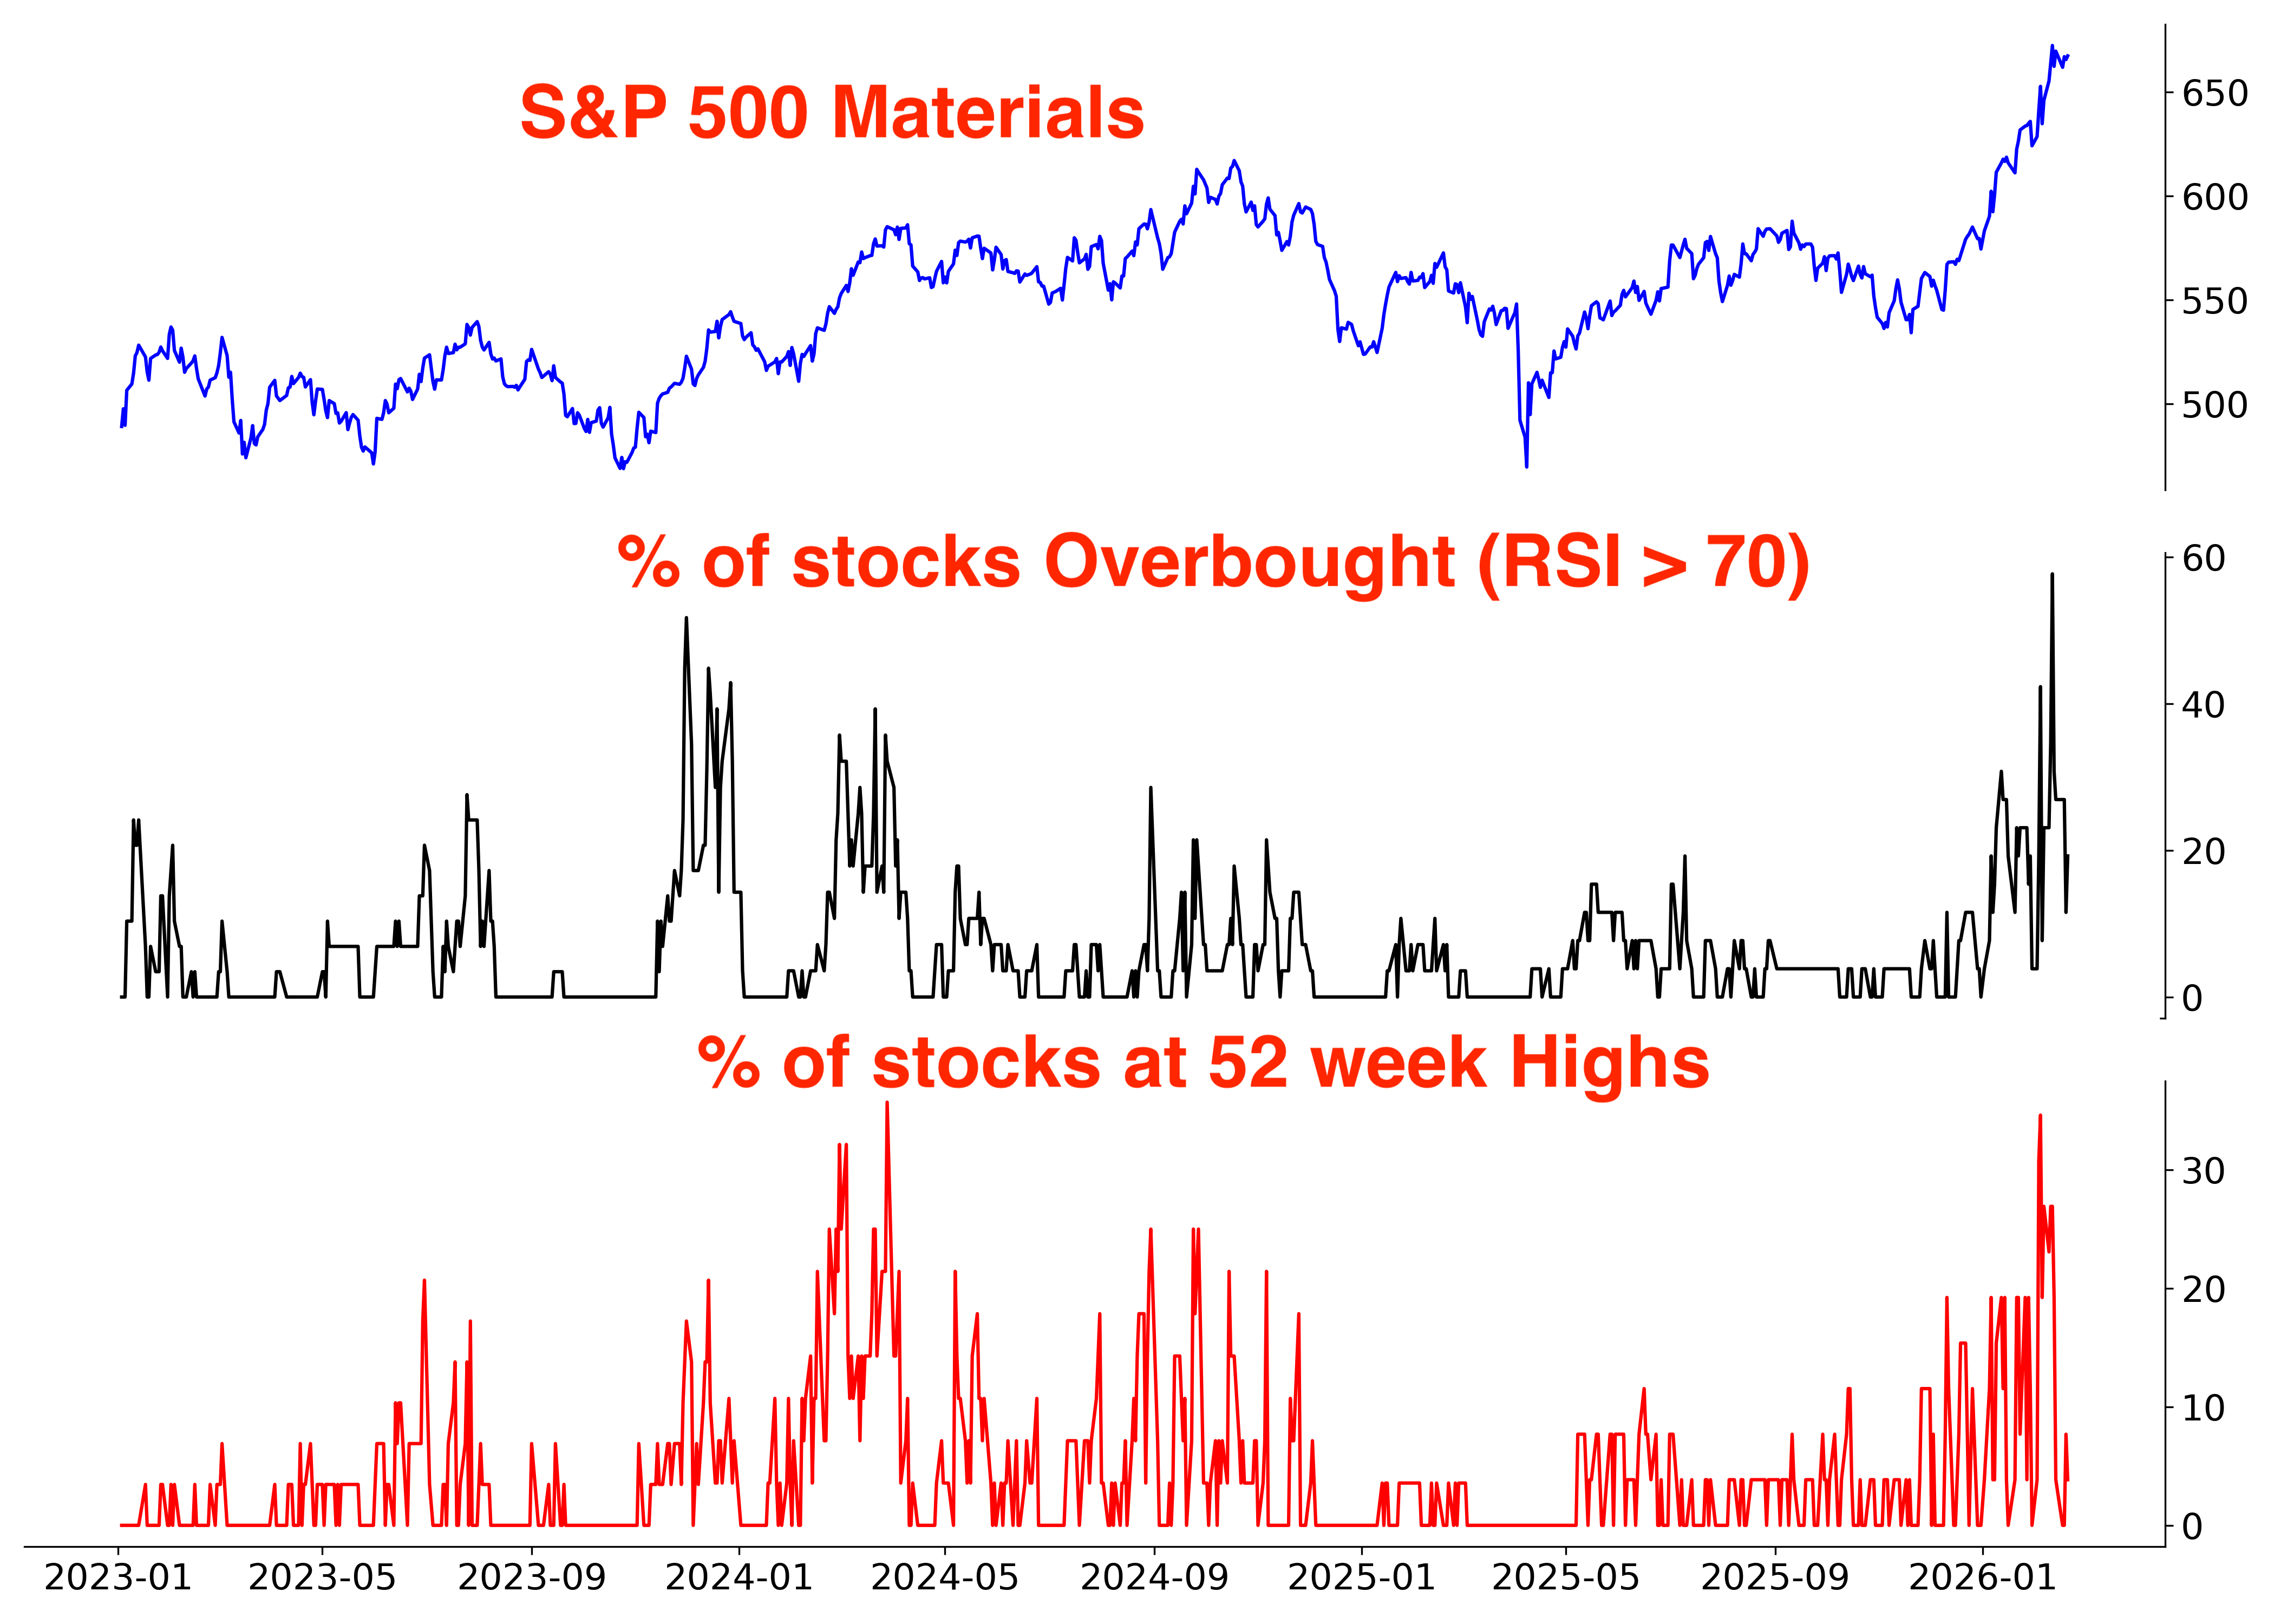
Materials:
Consumer Staples:
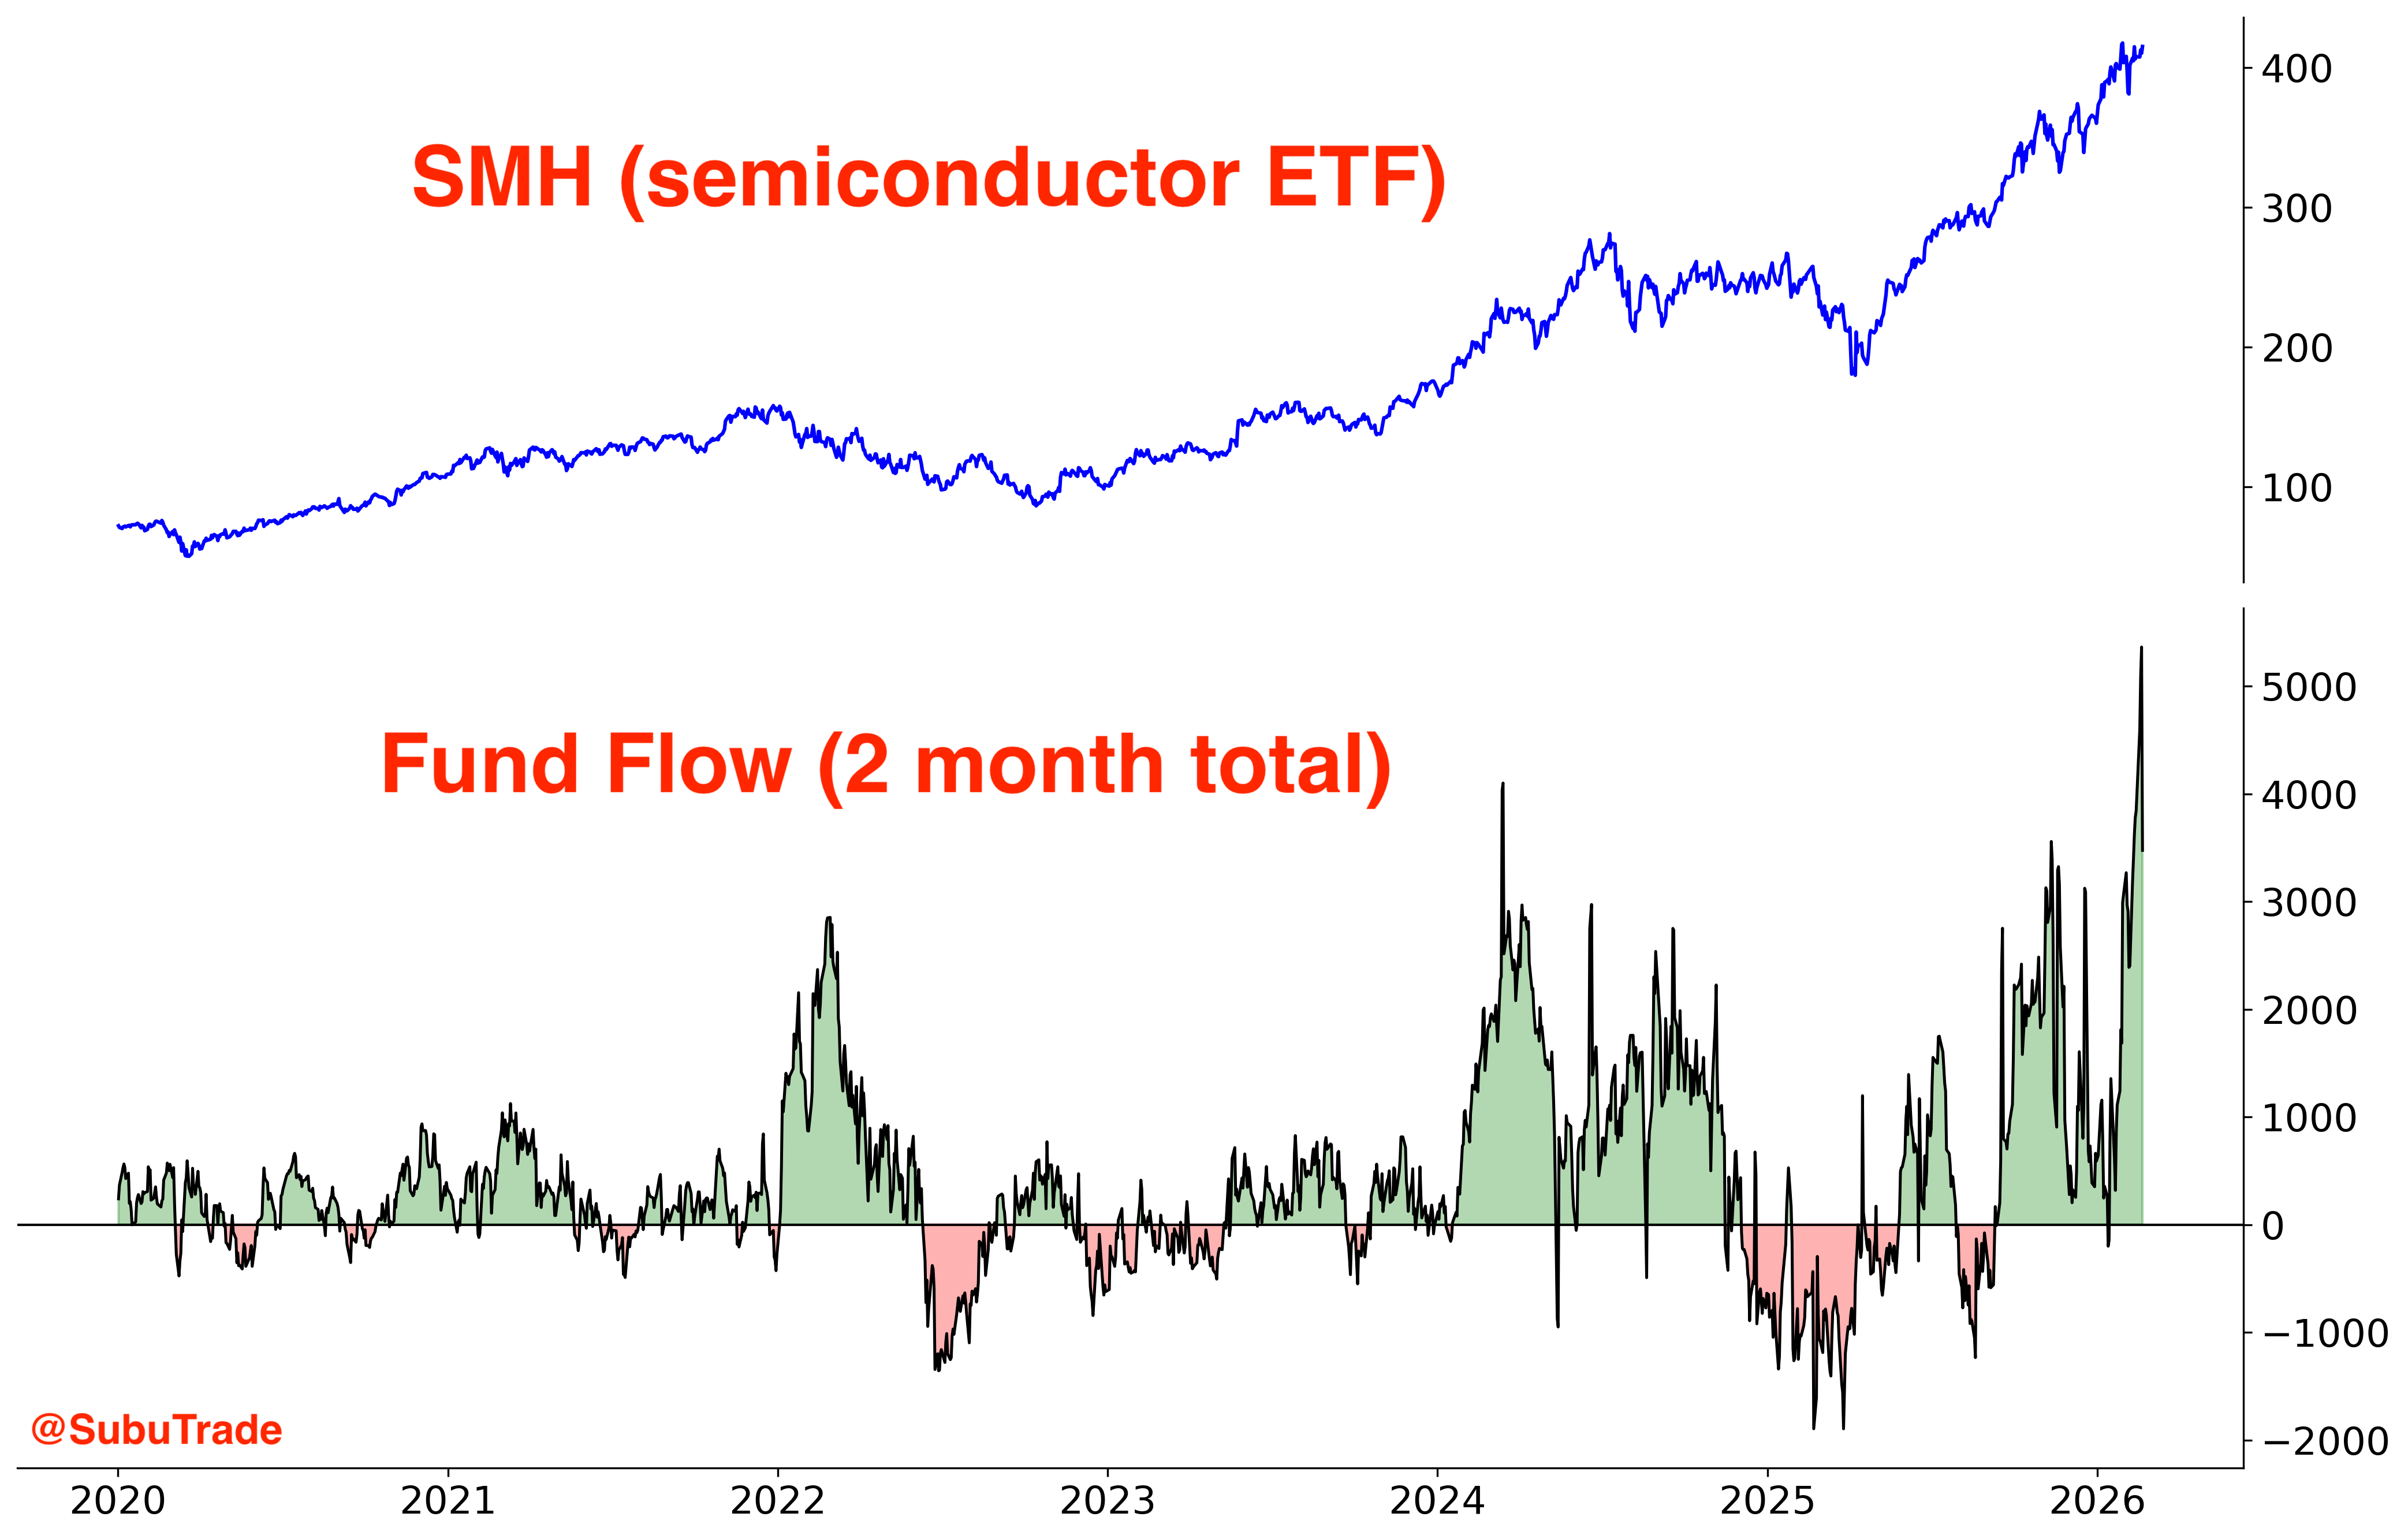
Semiconductors:
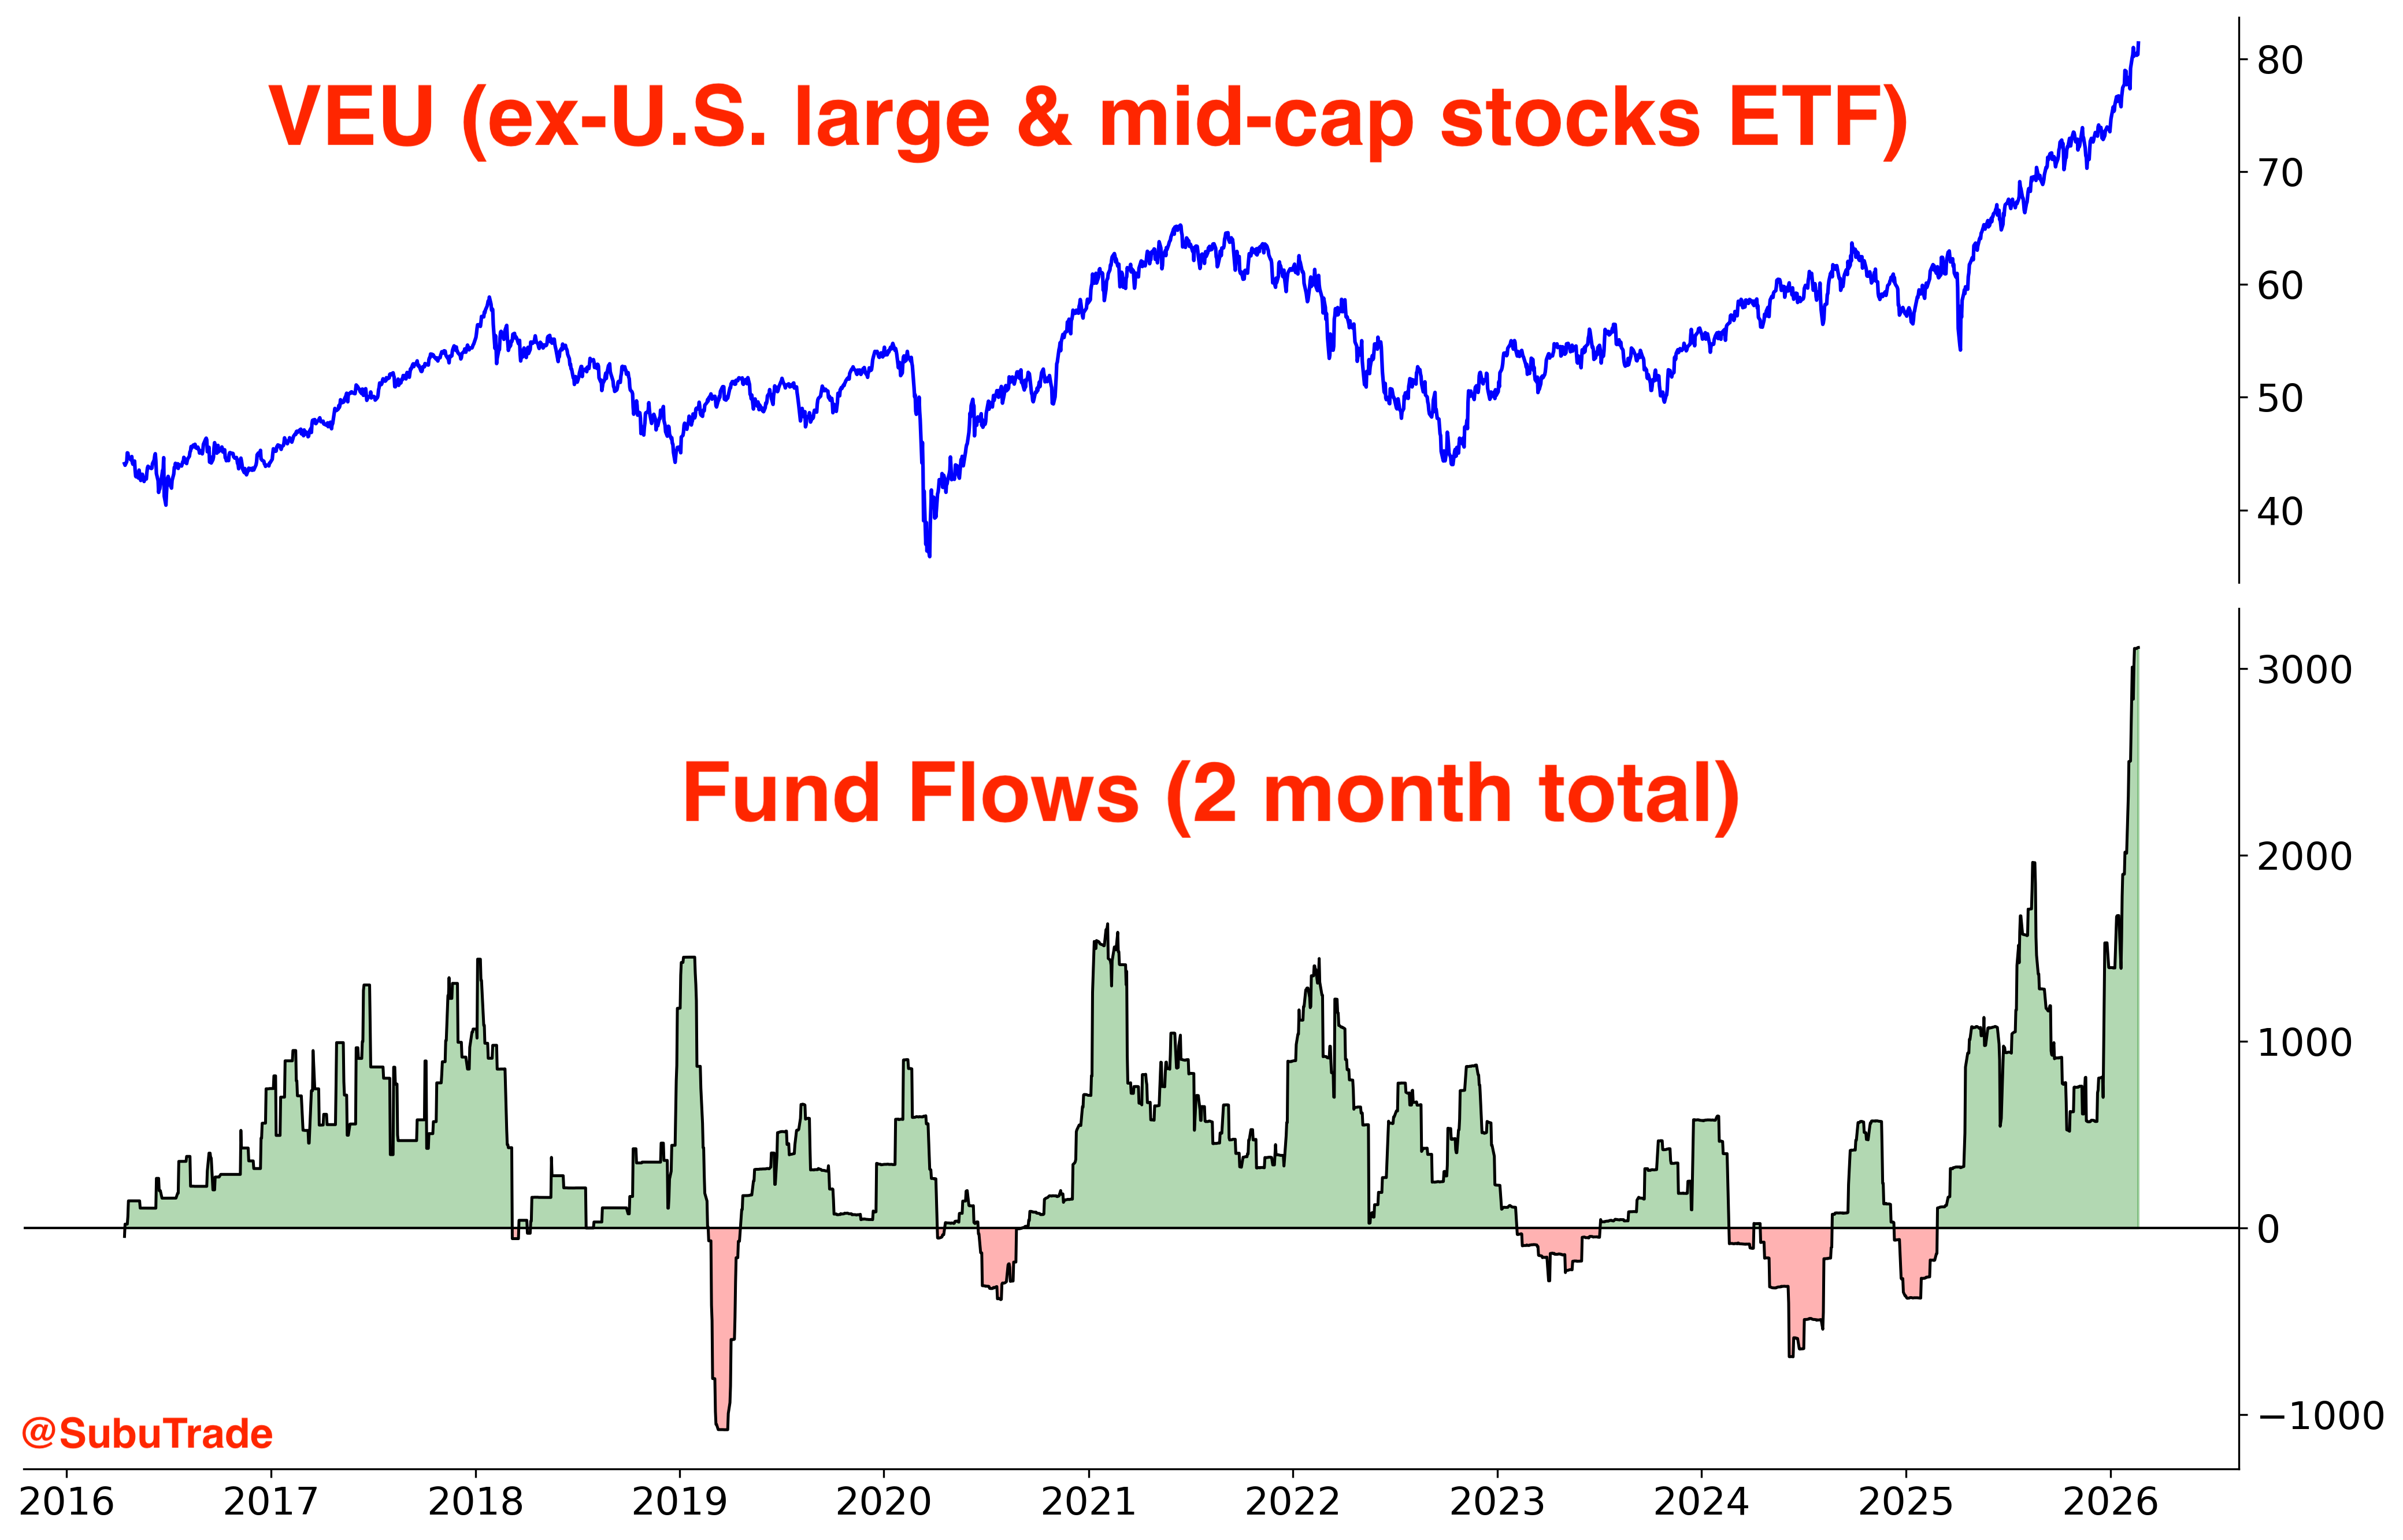
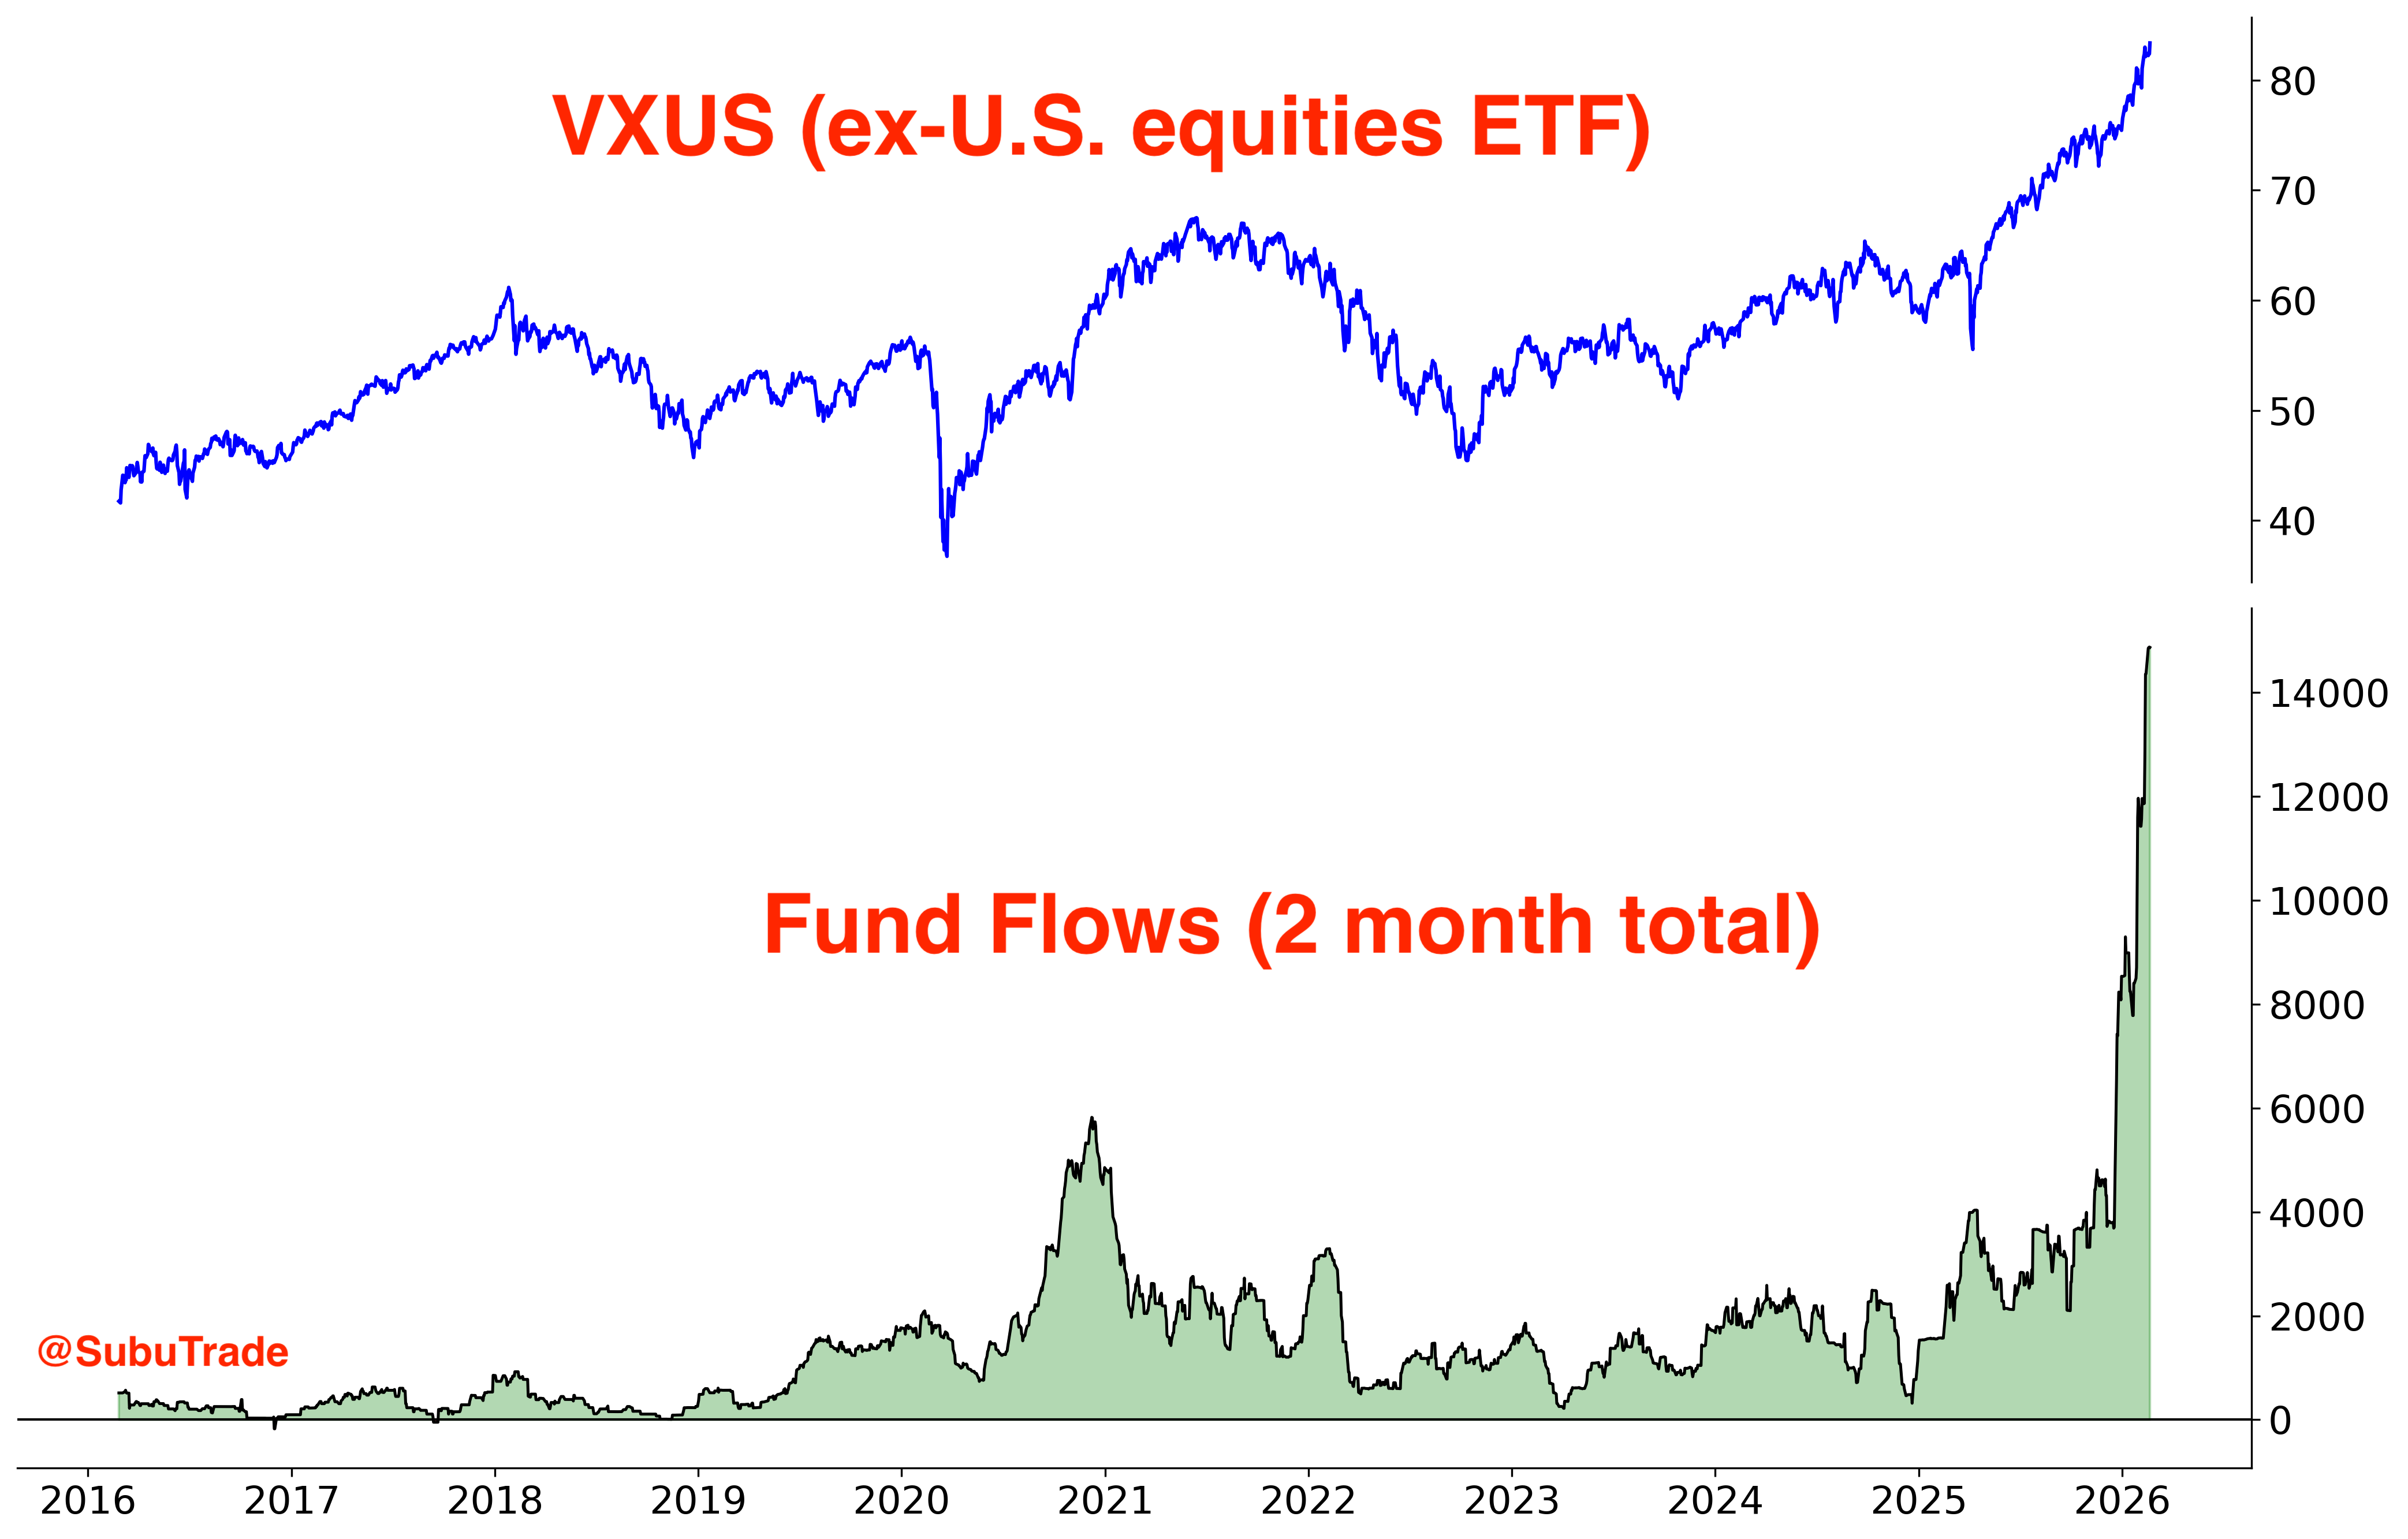
VEU (international equities):
VXUS (international equities):
The irony according to Duality Research is that sectors with weak earnings growth outperformed YTD, while sectors with strong earnings growth have underperformed!
Speaking of earnings…
Earnings growth
There’s no clear catalyst for a broad, systemic crash right now, and that explains the current tape. Some sectors are selling off, others are rallying, and the overall index is going nowhere.
Unlike the dot-com era, this isn’t a case of stock prices being wildly detached from earnings. The main concern today isn’t “extreme overvaluation”. It’s the risk that earnings could decline if AI hurts traditional software/tech business models.
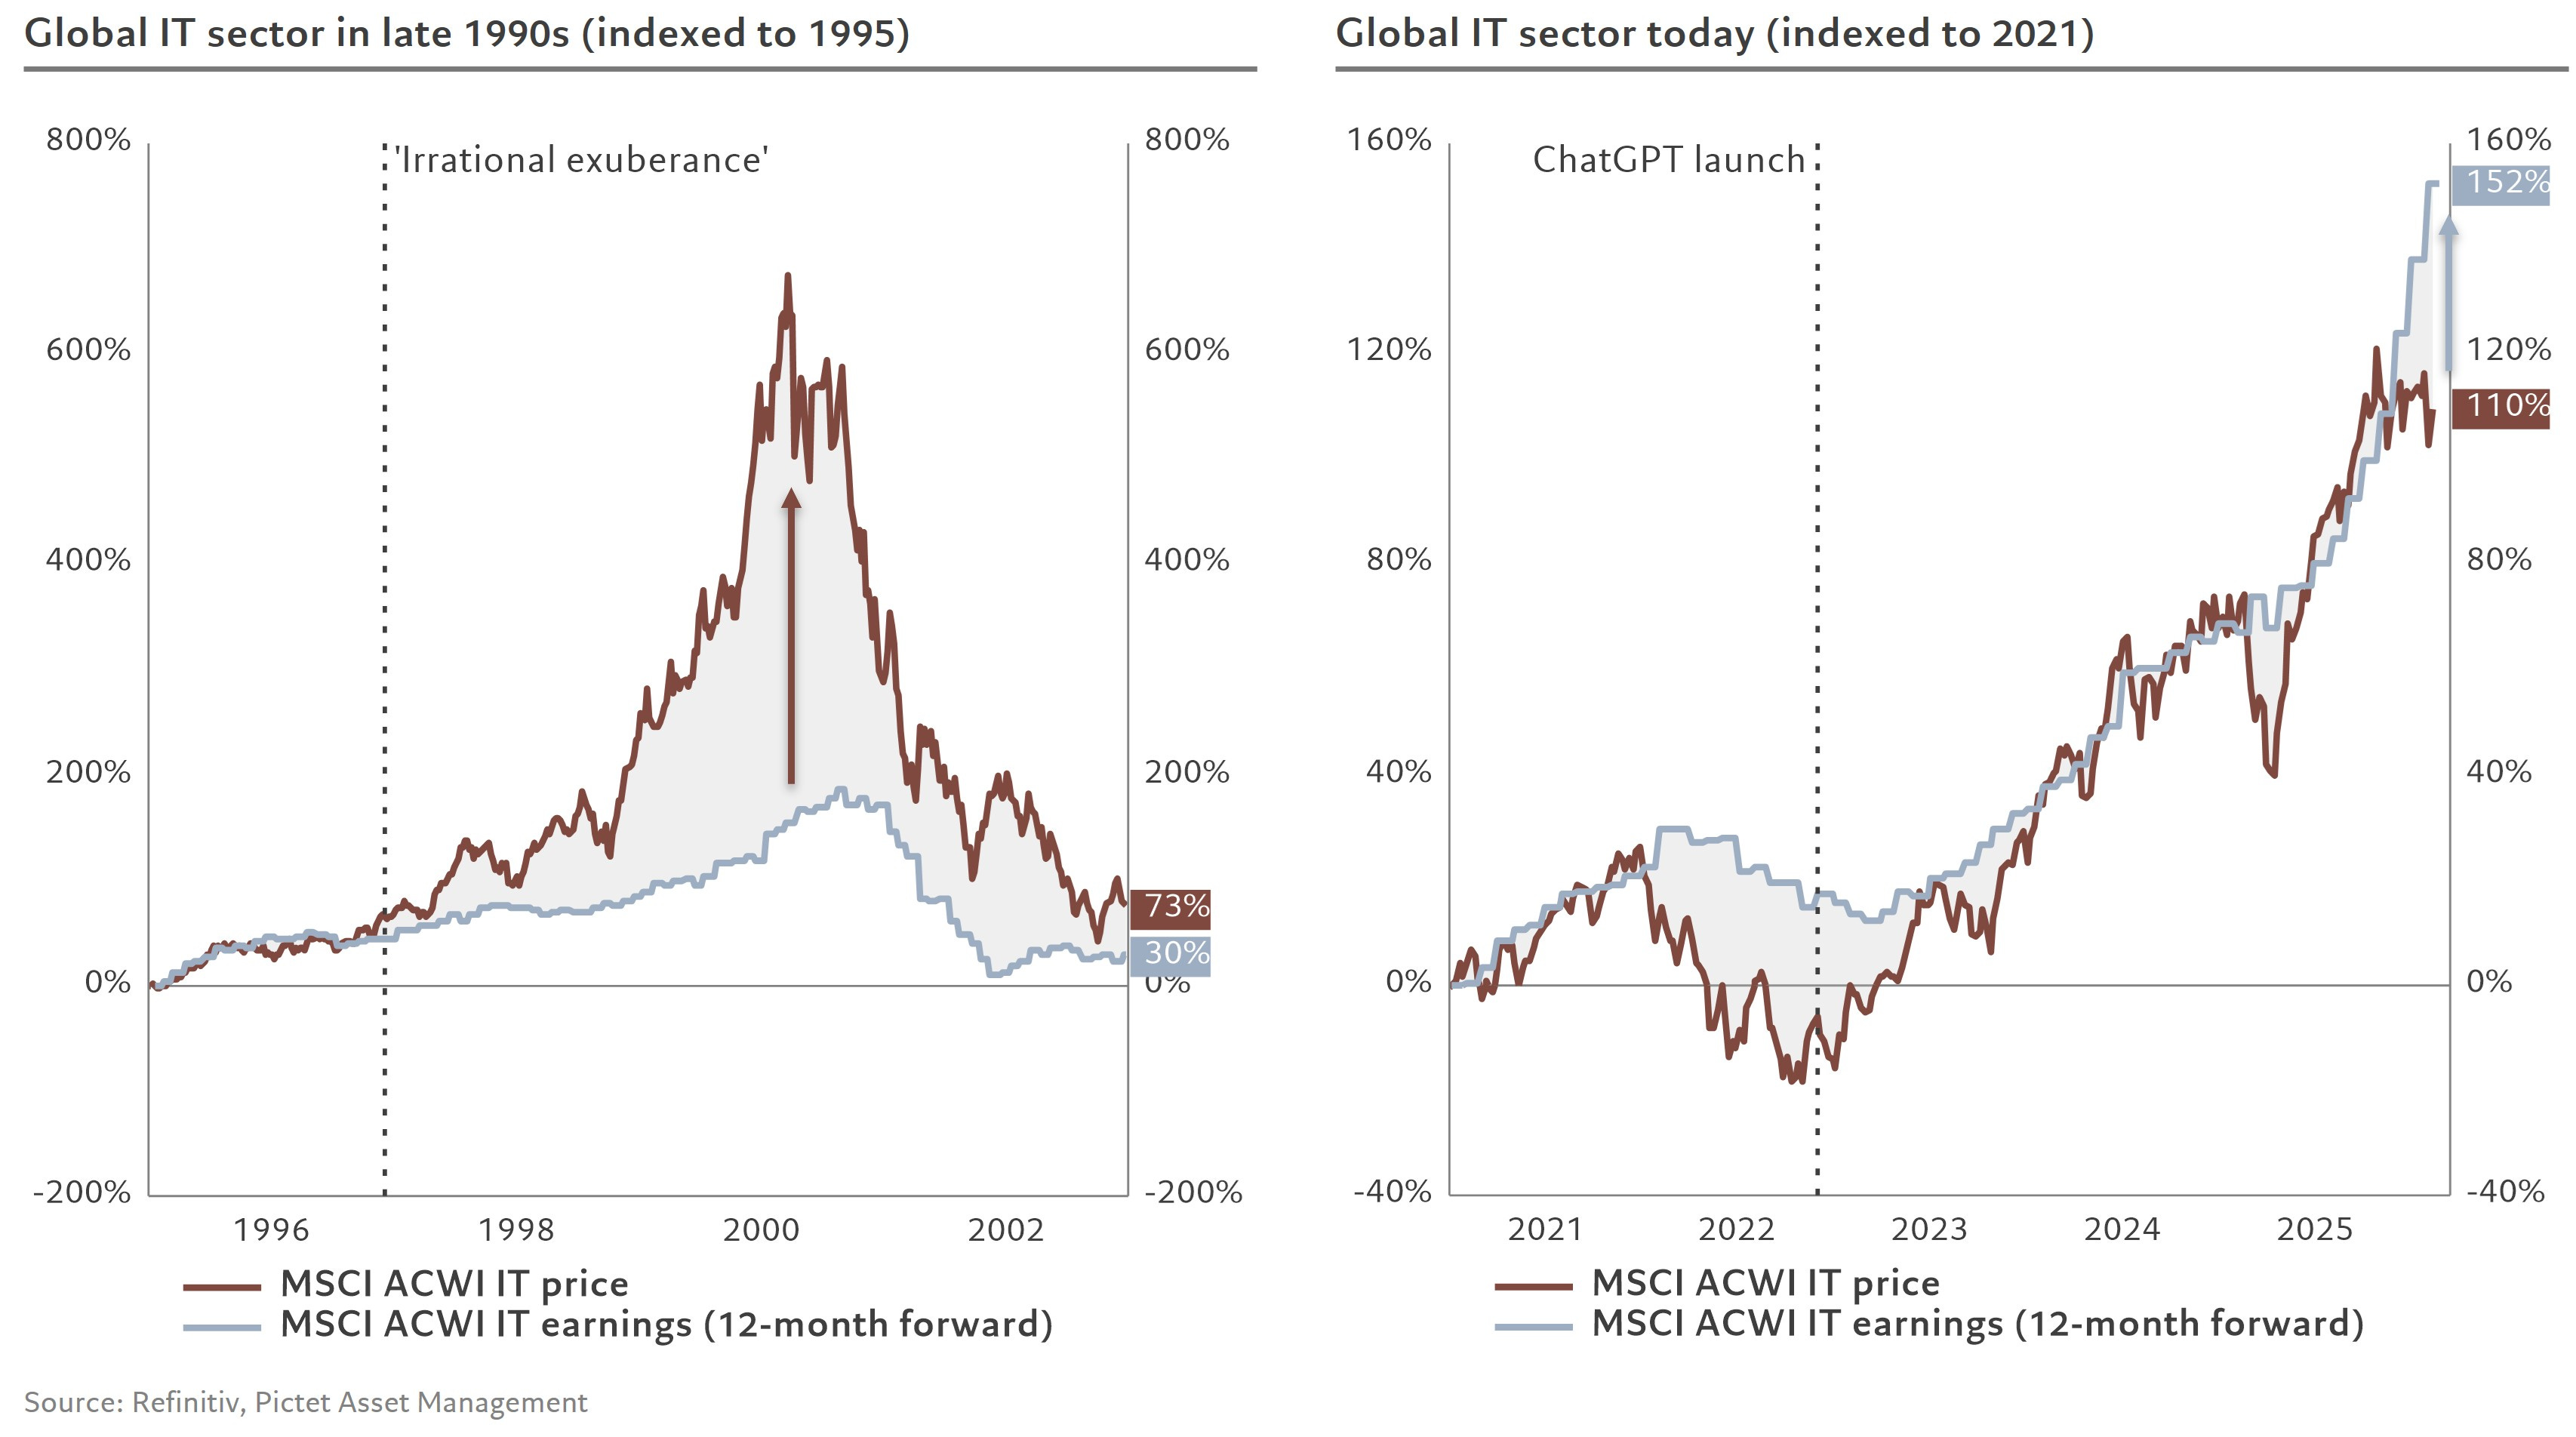
An interesting side-note: recent AI fears highlight the logic behind Warren Buffett’s long-standing caution toward technology from a long-term investment perspective.
Buffett prefers businesses with durable Moats and predictable staying power. For years, many investors argued that software companies had exactly that: strong competitive advantages and high switching costs. But technological shifts can erode those Moats faster than expected.
While Buffett was often criticized for avoiding much of tech, his broader point remains valid: what technological innovation giveth, technological innovation can take away.
Final thoughts on equities
My scenarios and probabilities:
S&P 500 goes up right now. 25%
S&P 500 swings sideways, up later in 1-2 months. 40%
S&P 500 make a deeper pullback or small correction (e.g. 7-12%). 25%
S&P 500 make a significant correction (15%+). 10%
The S&P 500 has been chopping sideways for months. A deeper pullback is possible, but the odds of a major correction remain low.
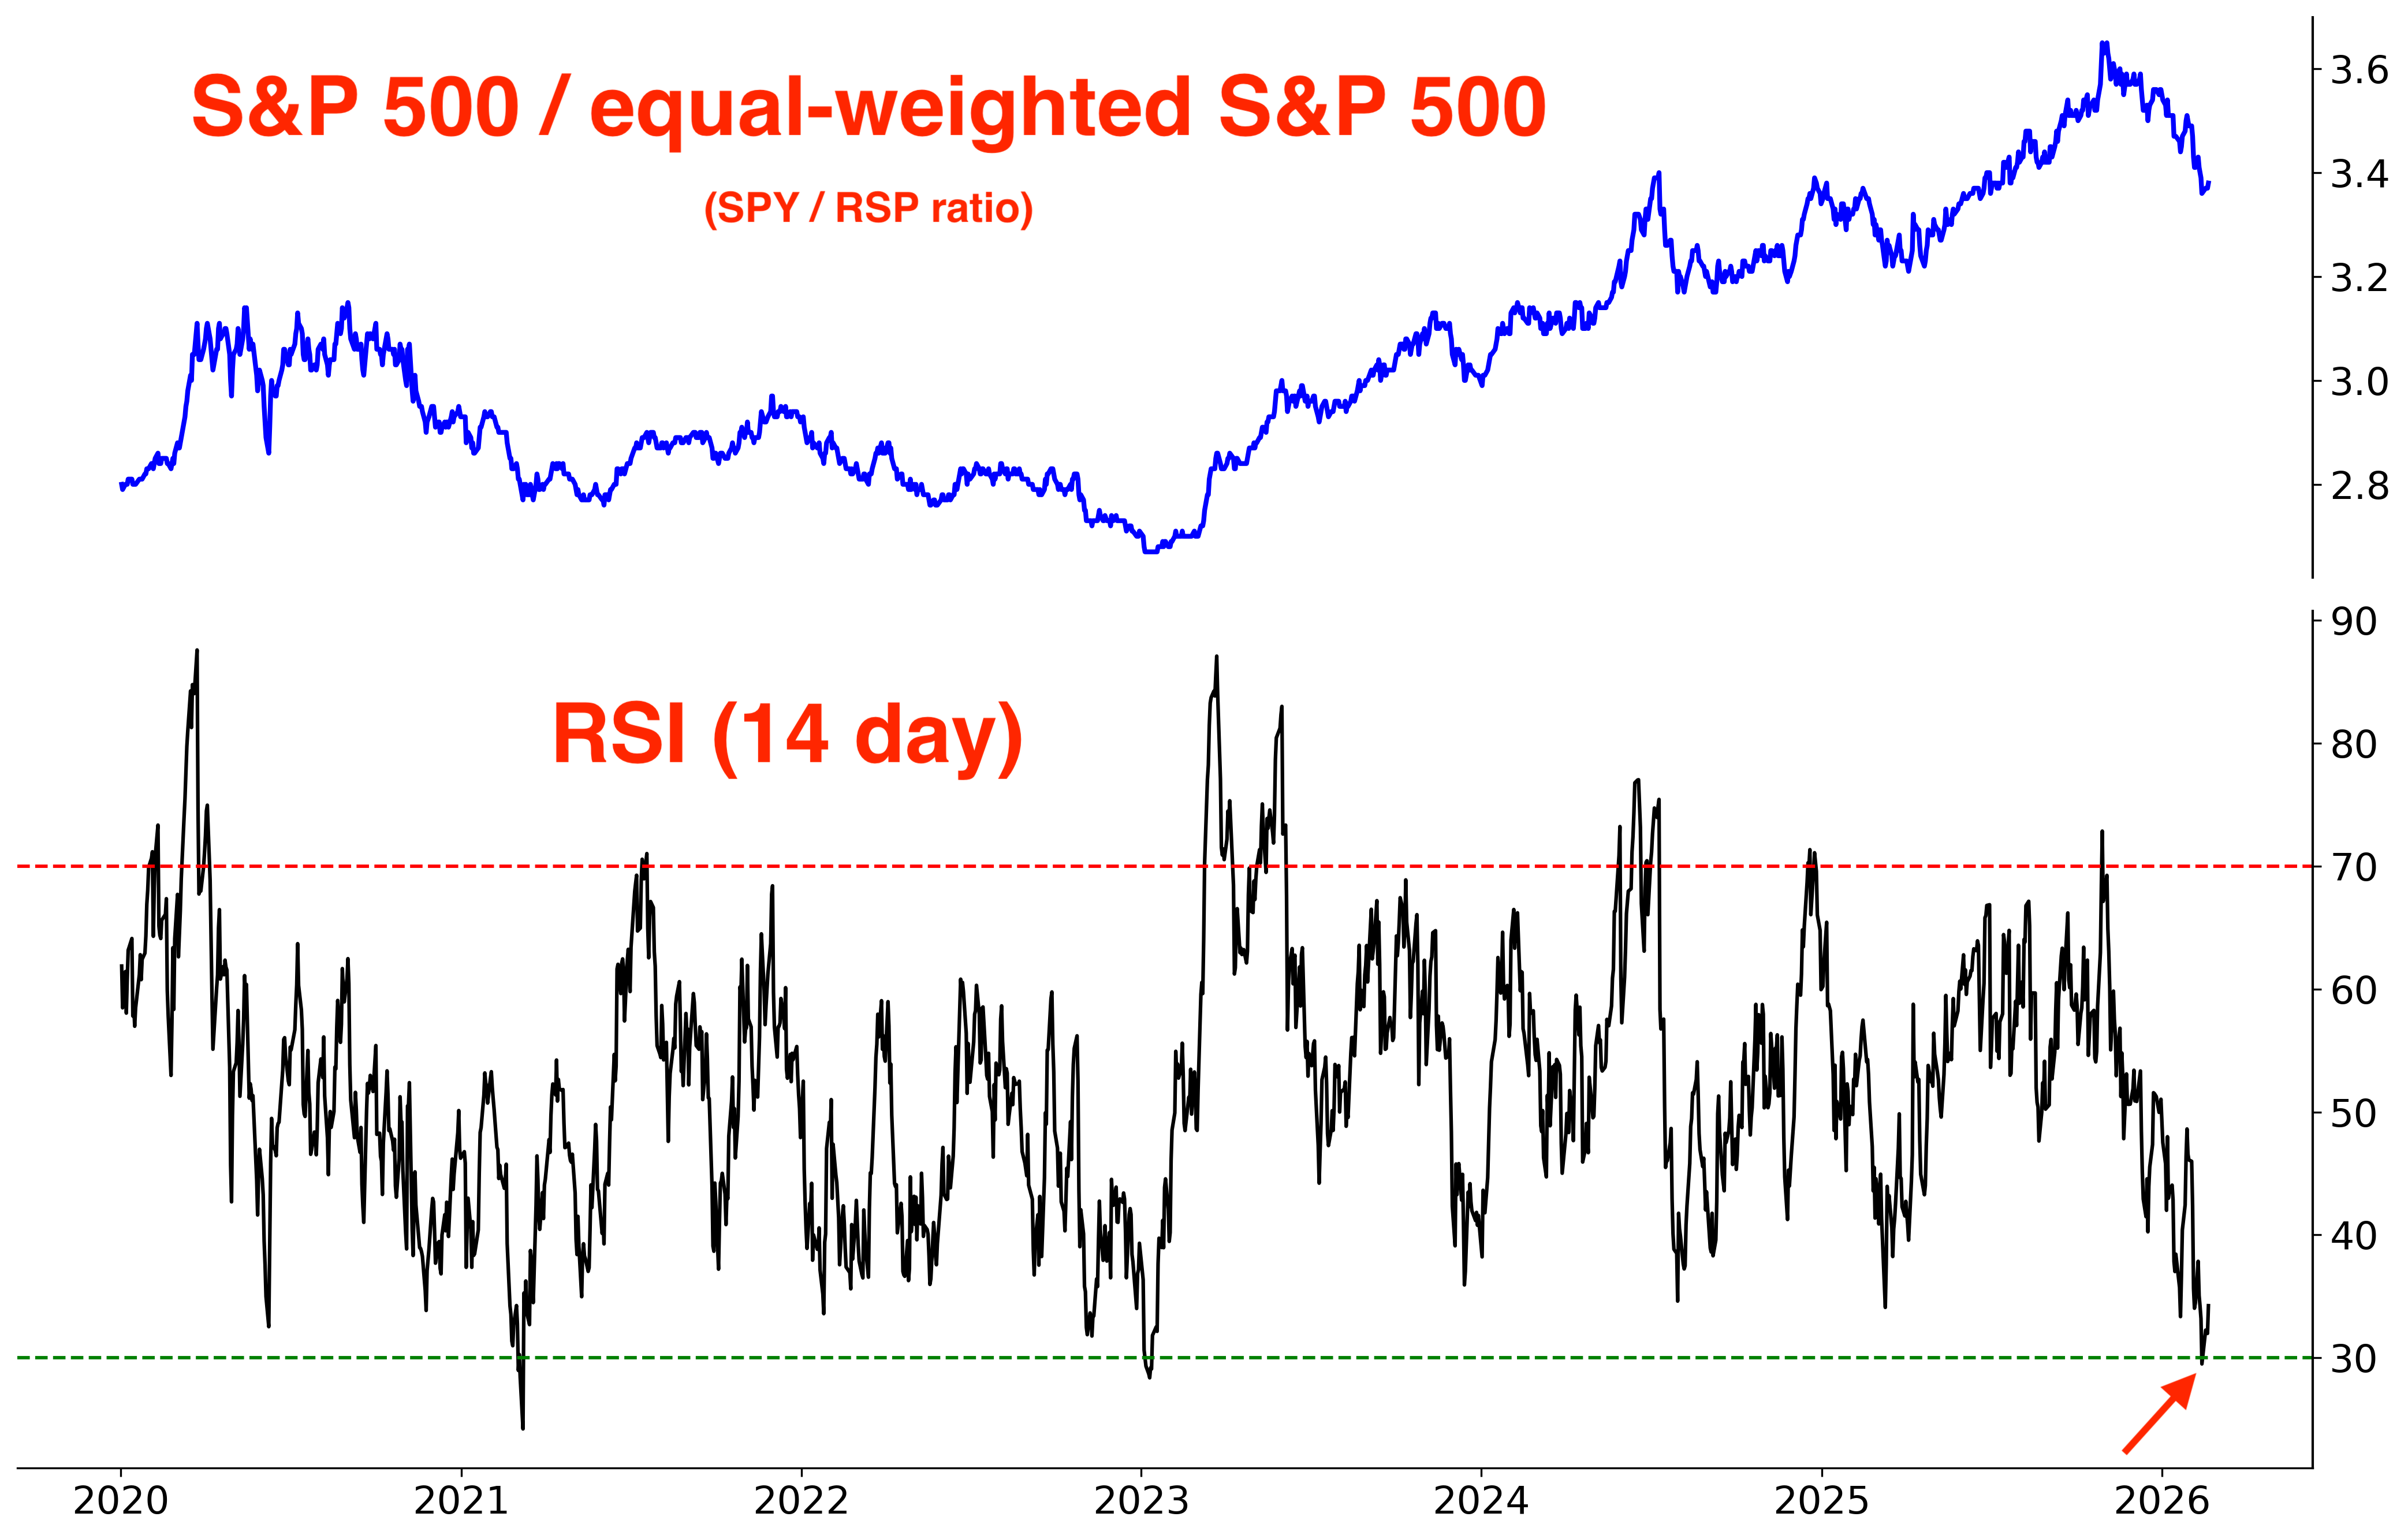
With that being said, any sustained move higher requires leadership from tech. The sector’s weight in the index is simply too large to ignore. Without participation from tech, we’re going to just see more of the same: a lot of volatility with marginal new all-time highs.
If tech re-gains leadership, we could see a slowdown in sectors such as Consumer Staples, Utilities, Materials, etc. That will cause the S&P 500 to once again outperform the equal-weighted S&P 500.
Dollar, Euro, and Precious Metals
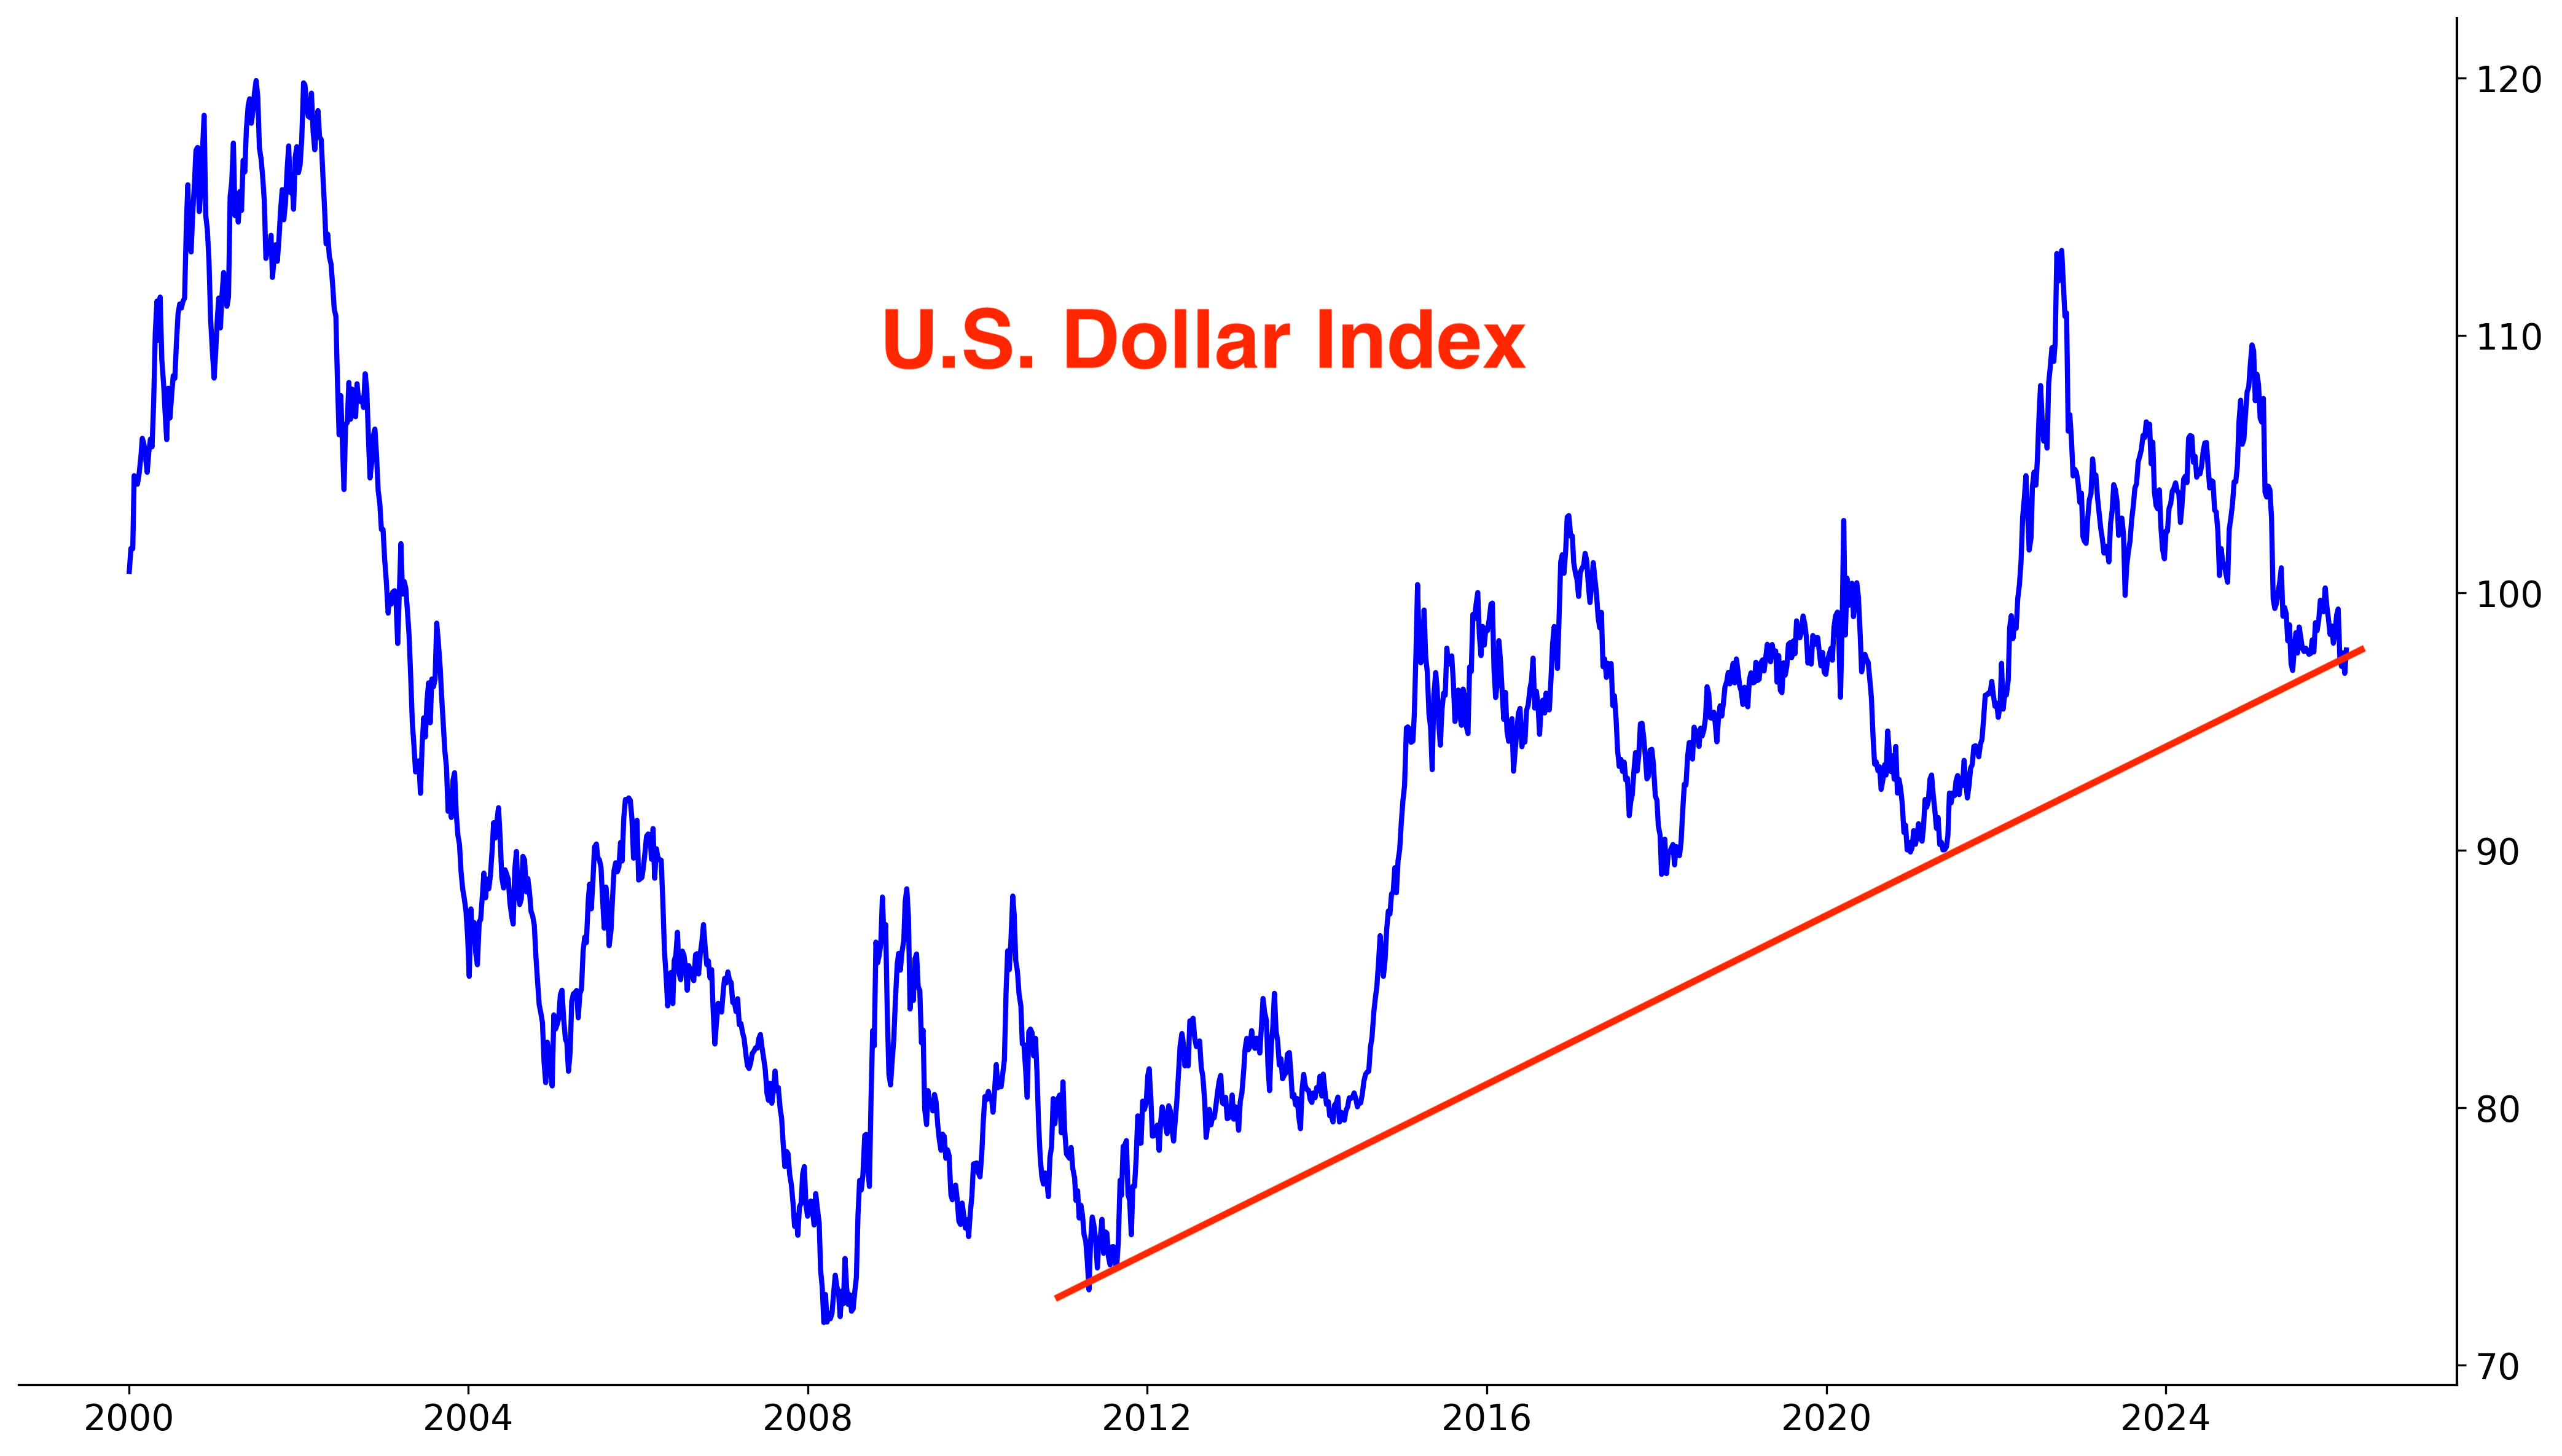
2025 saw precious metals soar as the Dollar tumbled. Could the U.S. Dollar stage a partial comeback in 2026?
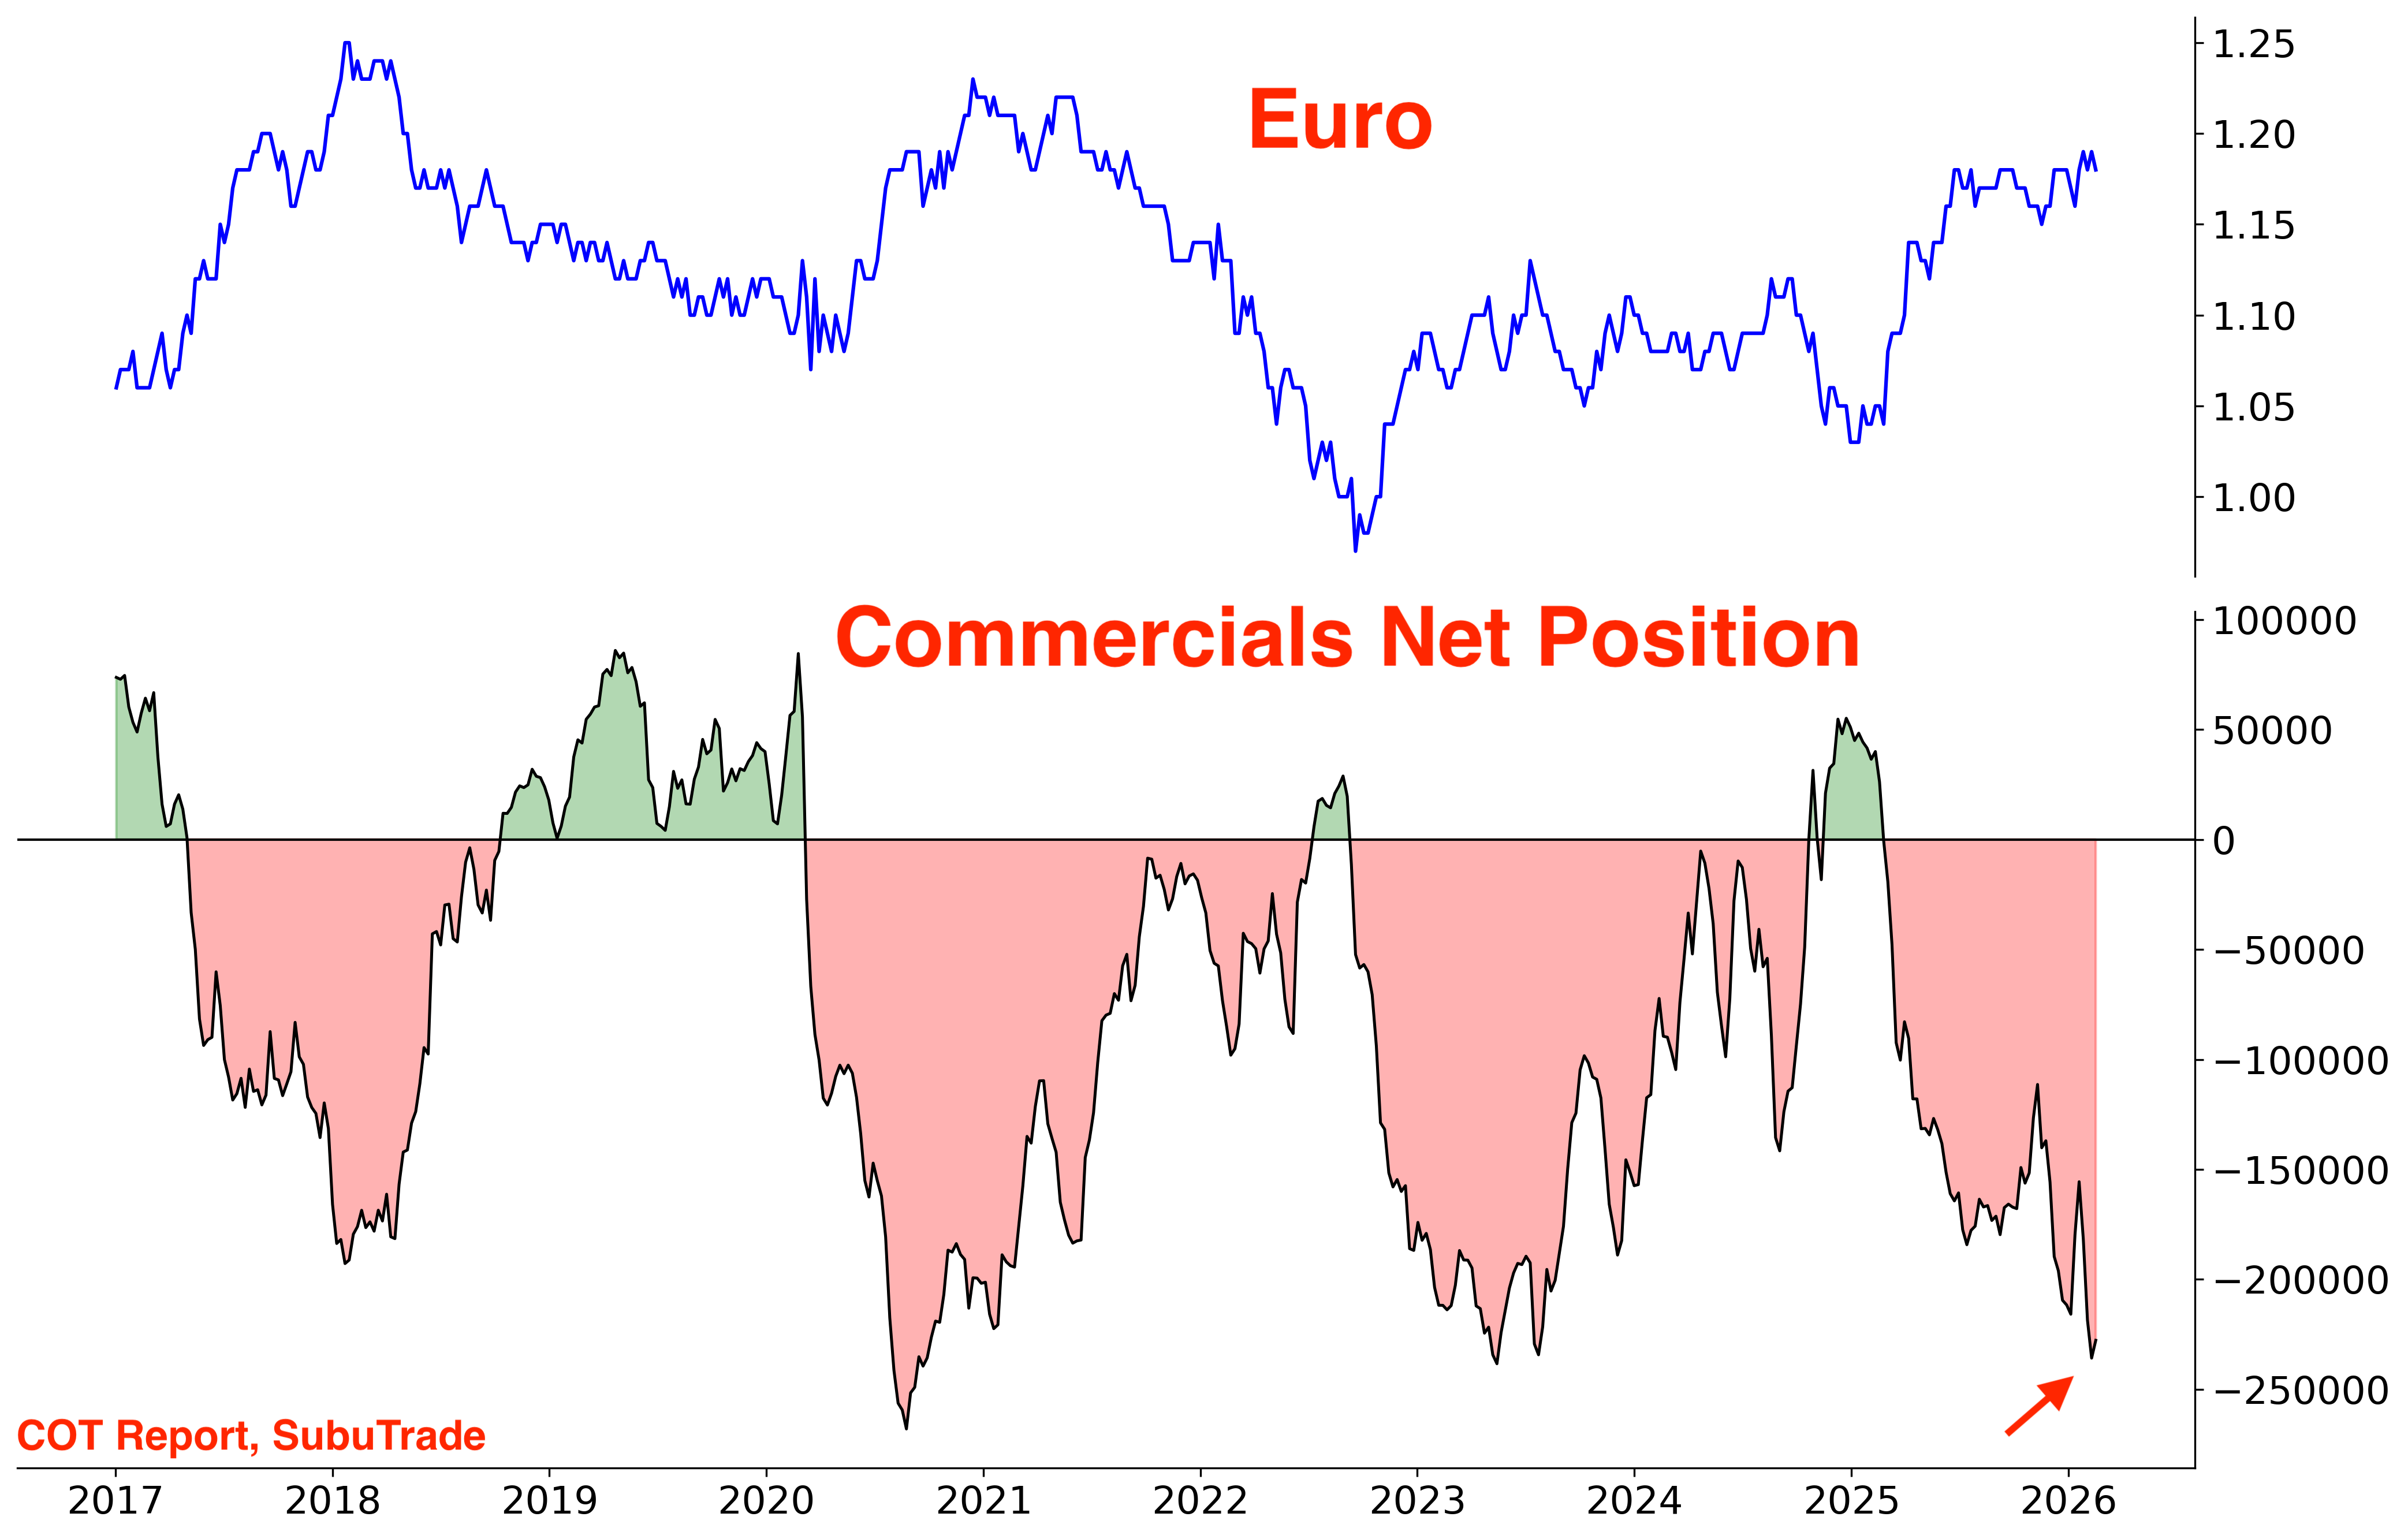
Examining the COT Report, Commercials are extremely short the Euro. The Euro accounts for 57% of the U.S. Dollar Index.
Meanwhile, Large Speculators are extremely net-long:
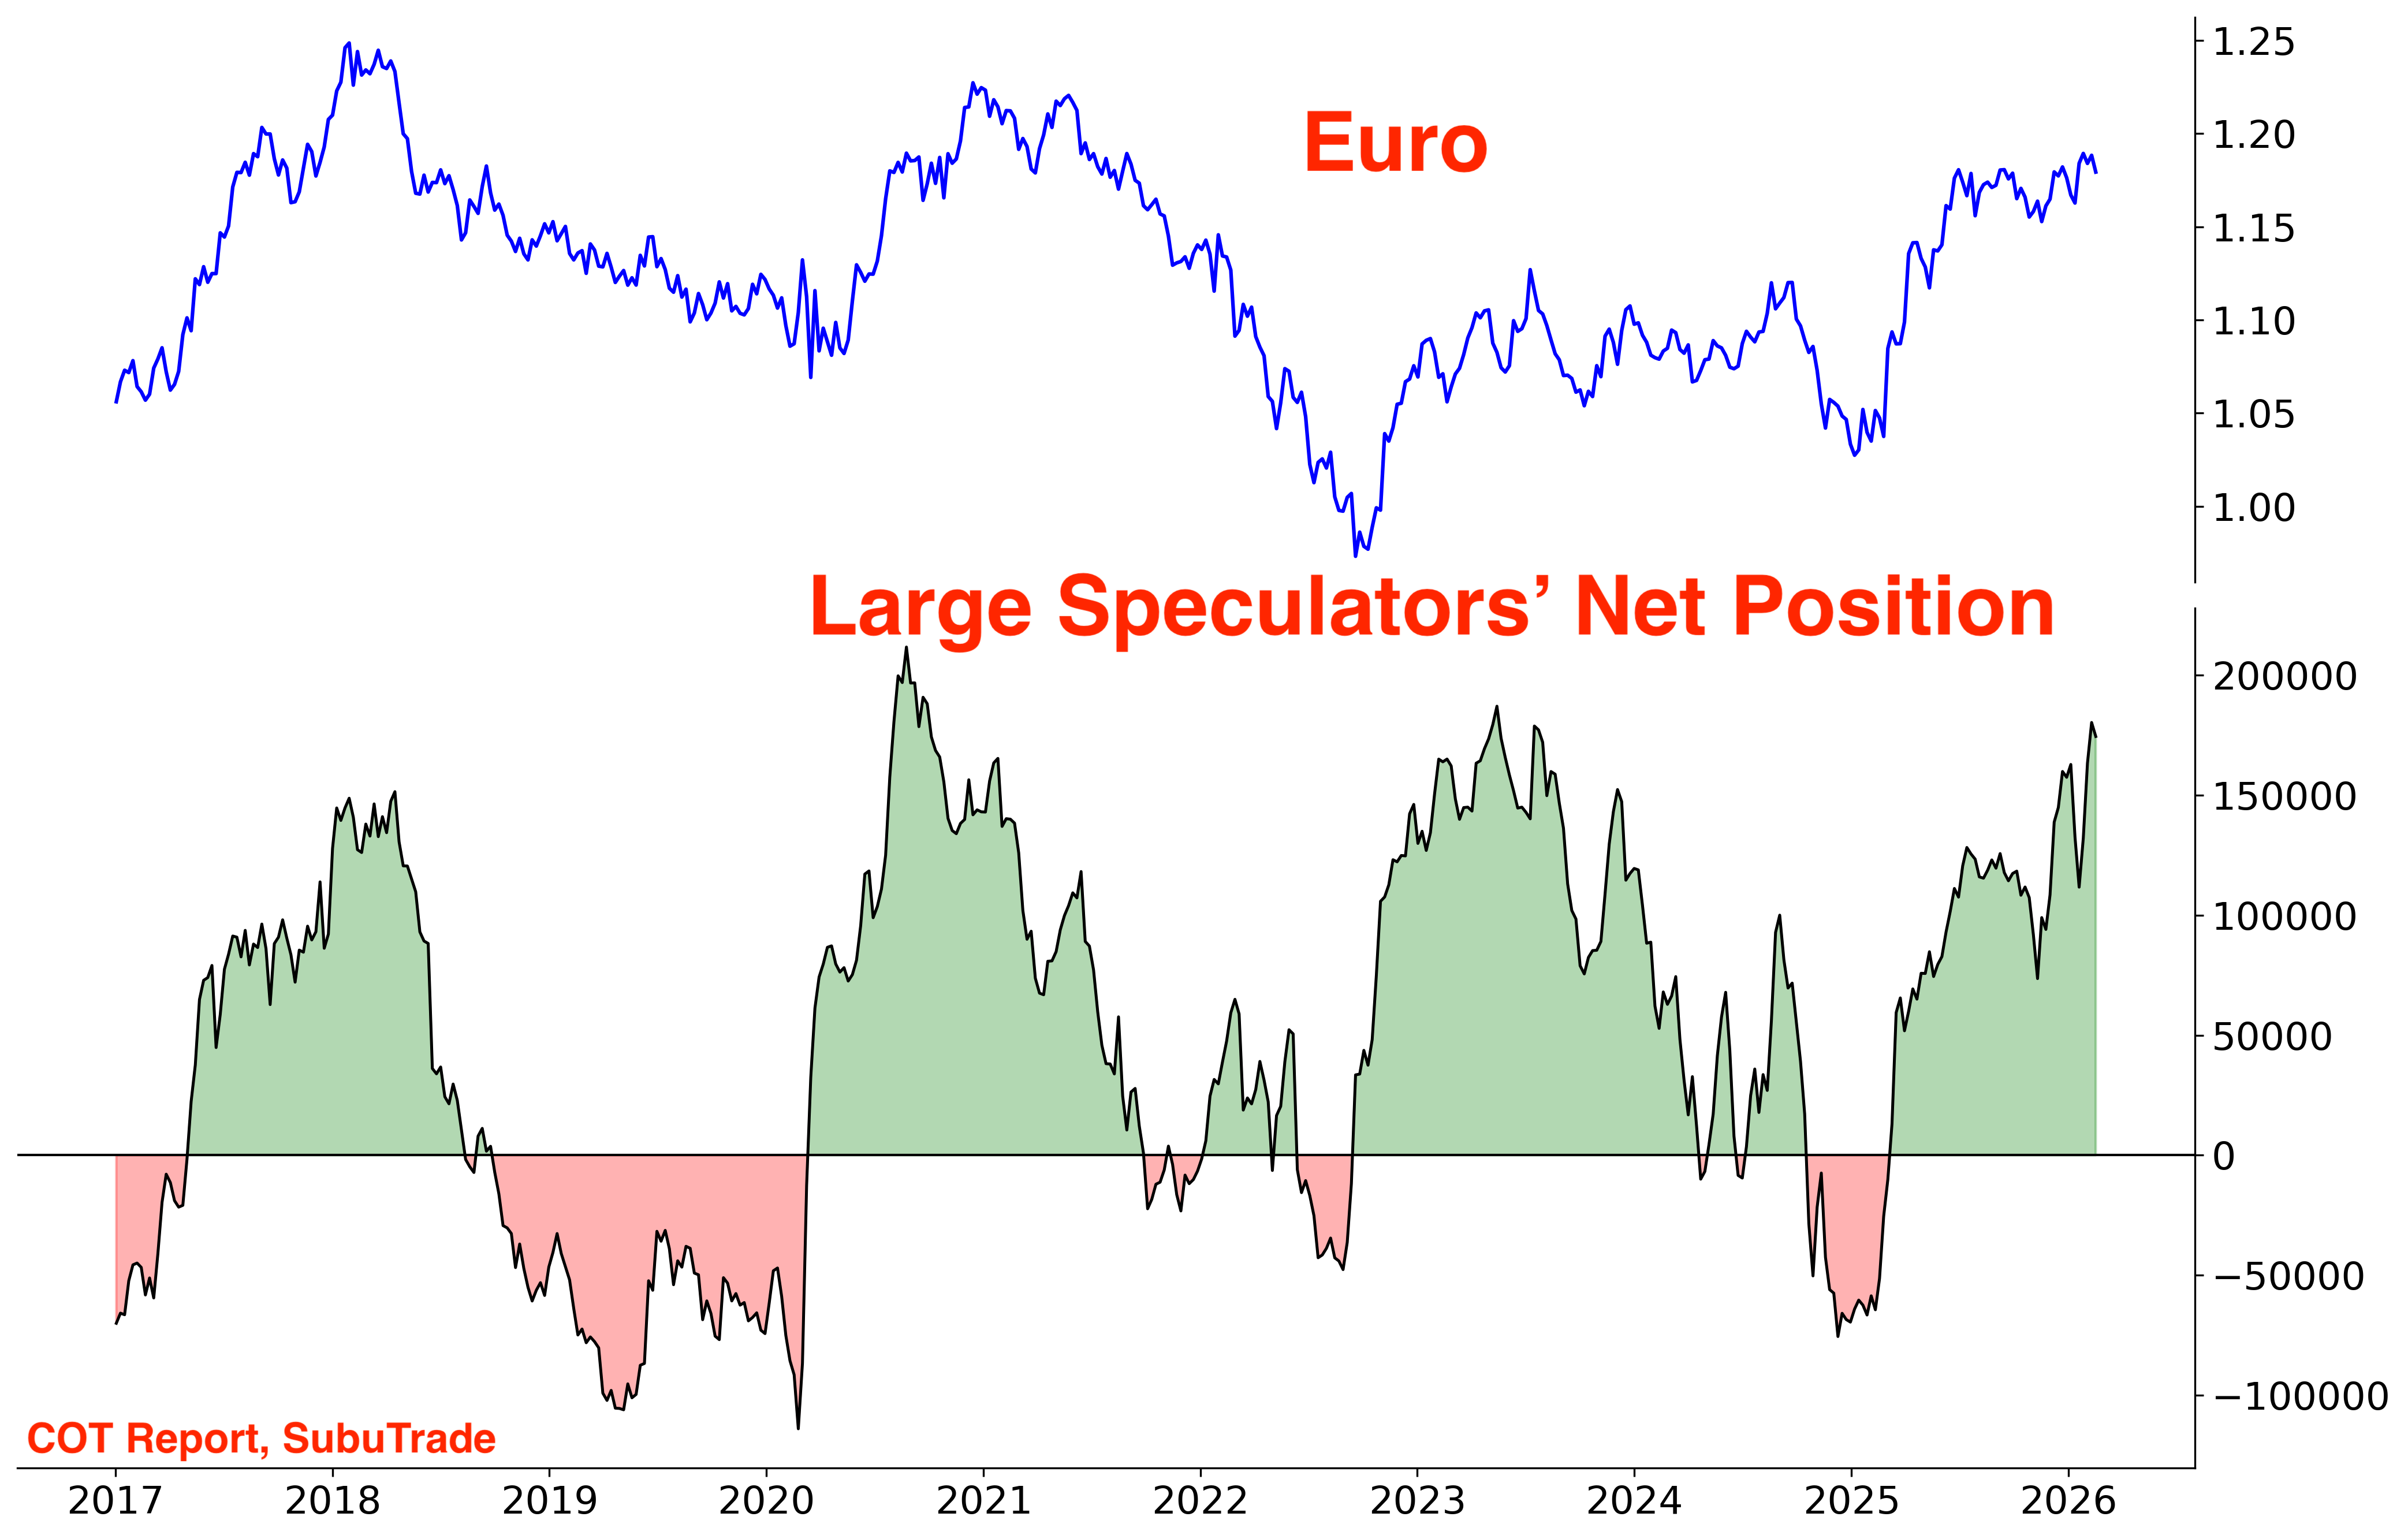
From a Mean Reversion perspective, this suggests that the Euro could pullback in 2026 while the U.S. Dollar rallies.
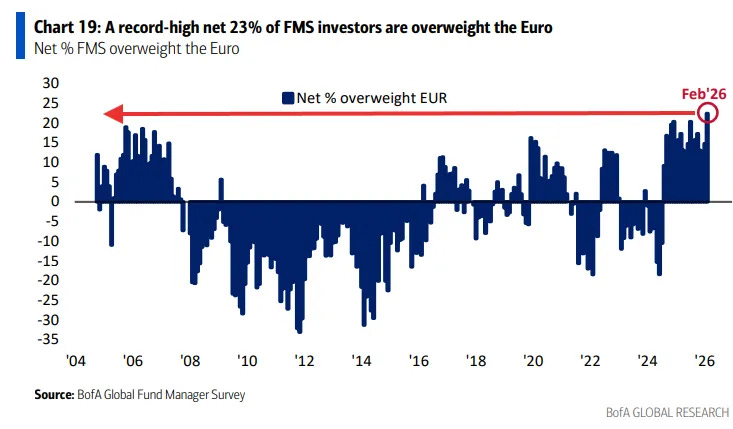
Data from Bank of America’s Fund Manager Survey confirms this extreme positioning: Fund Managers are record overweight the Euro….
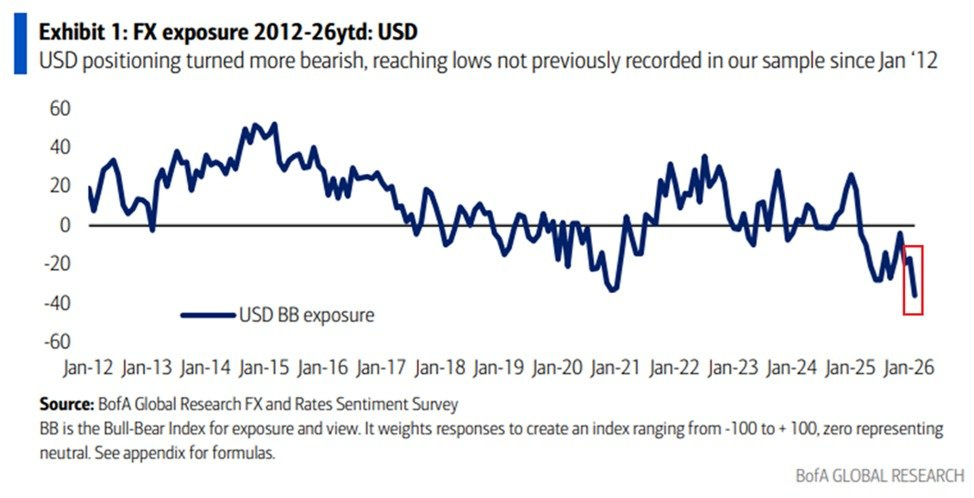
… and extremely bearish on the Dollar:
Meanwhile, the U.S. Dollar Index sits on trendline support:
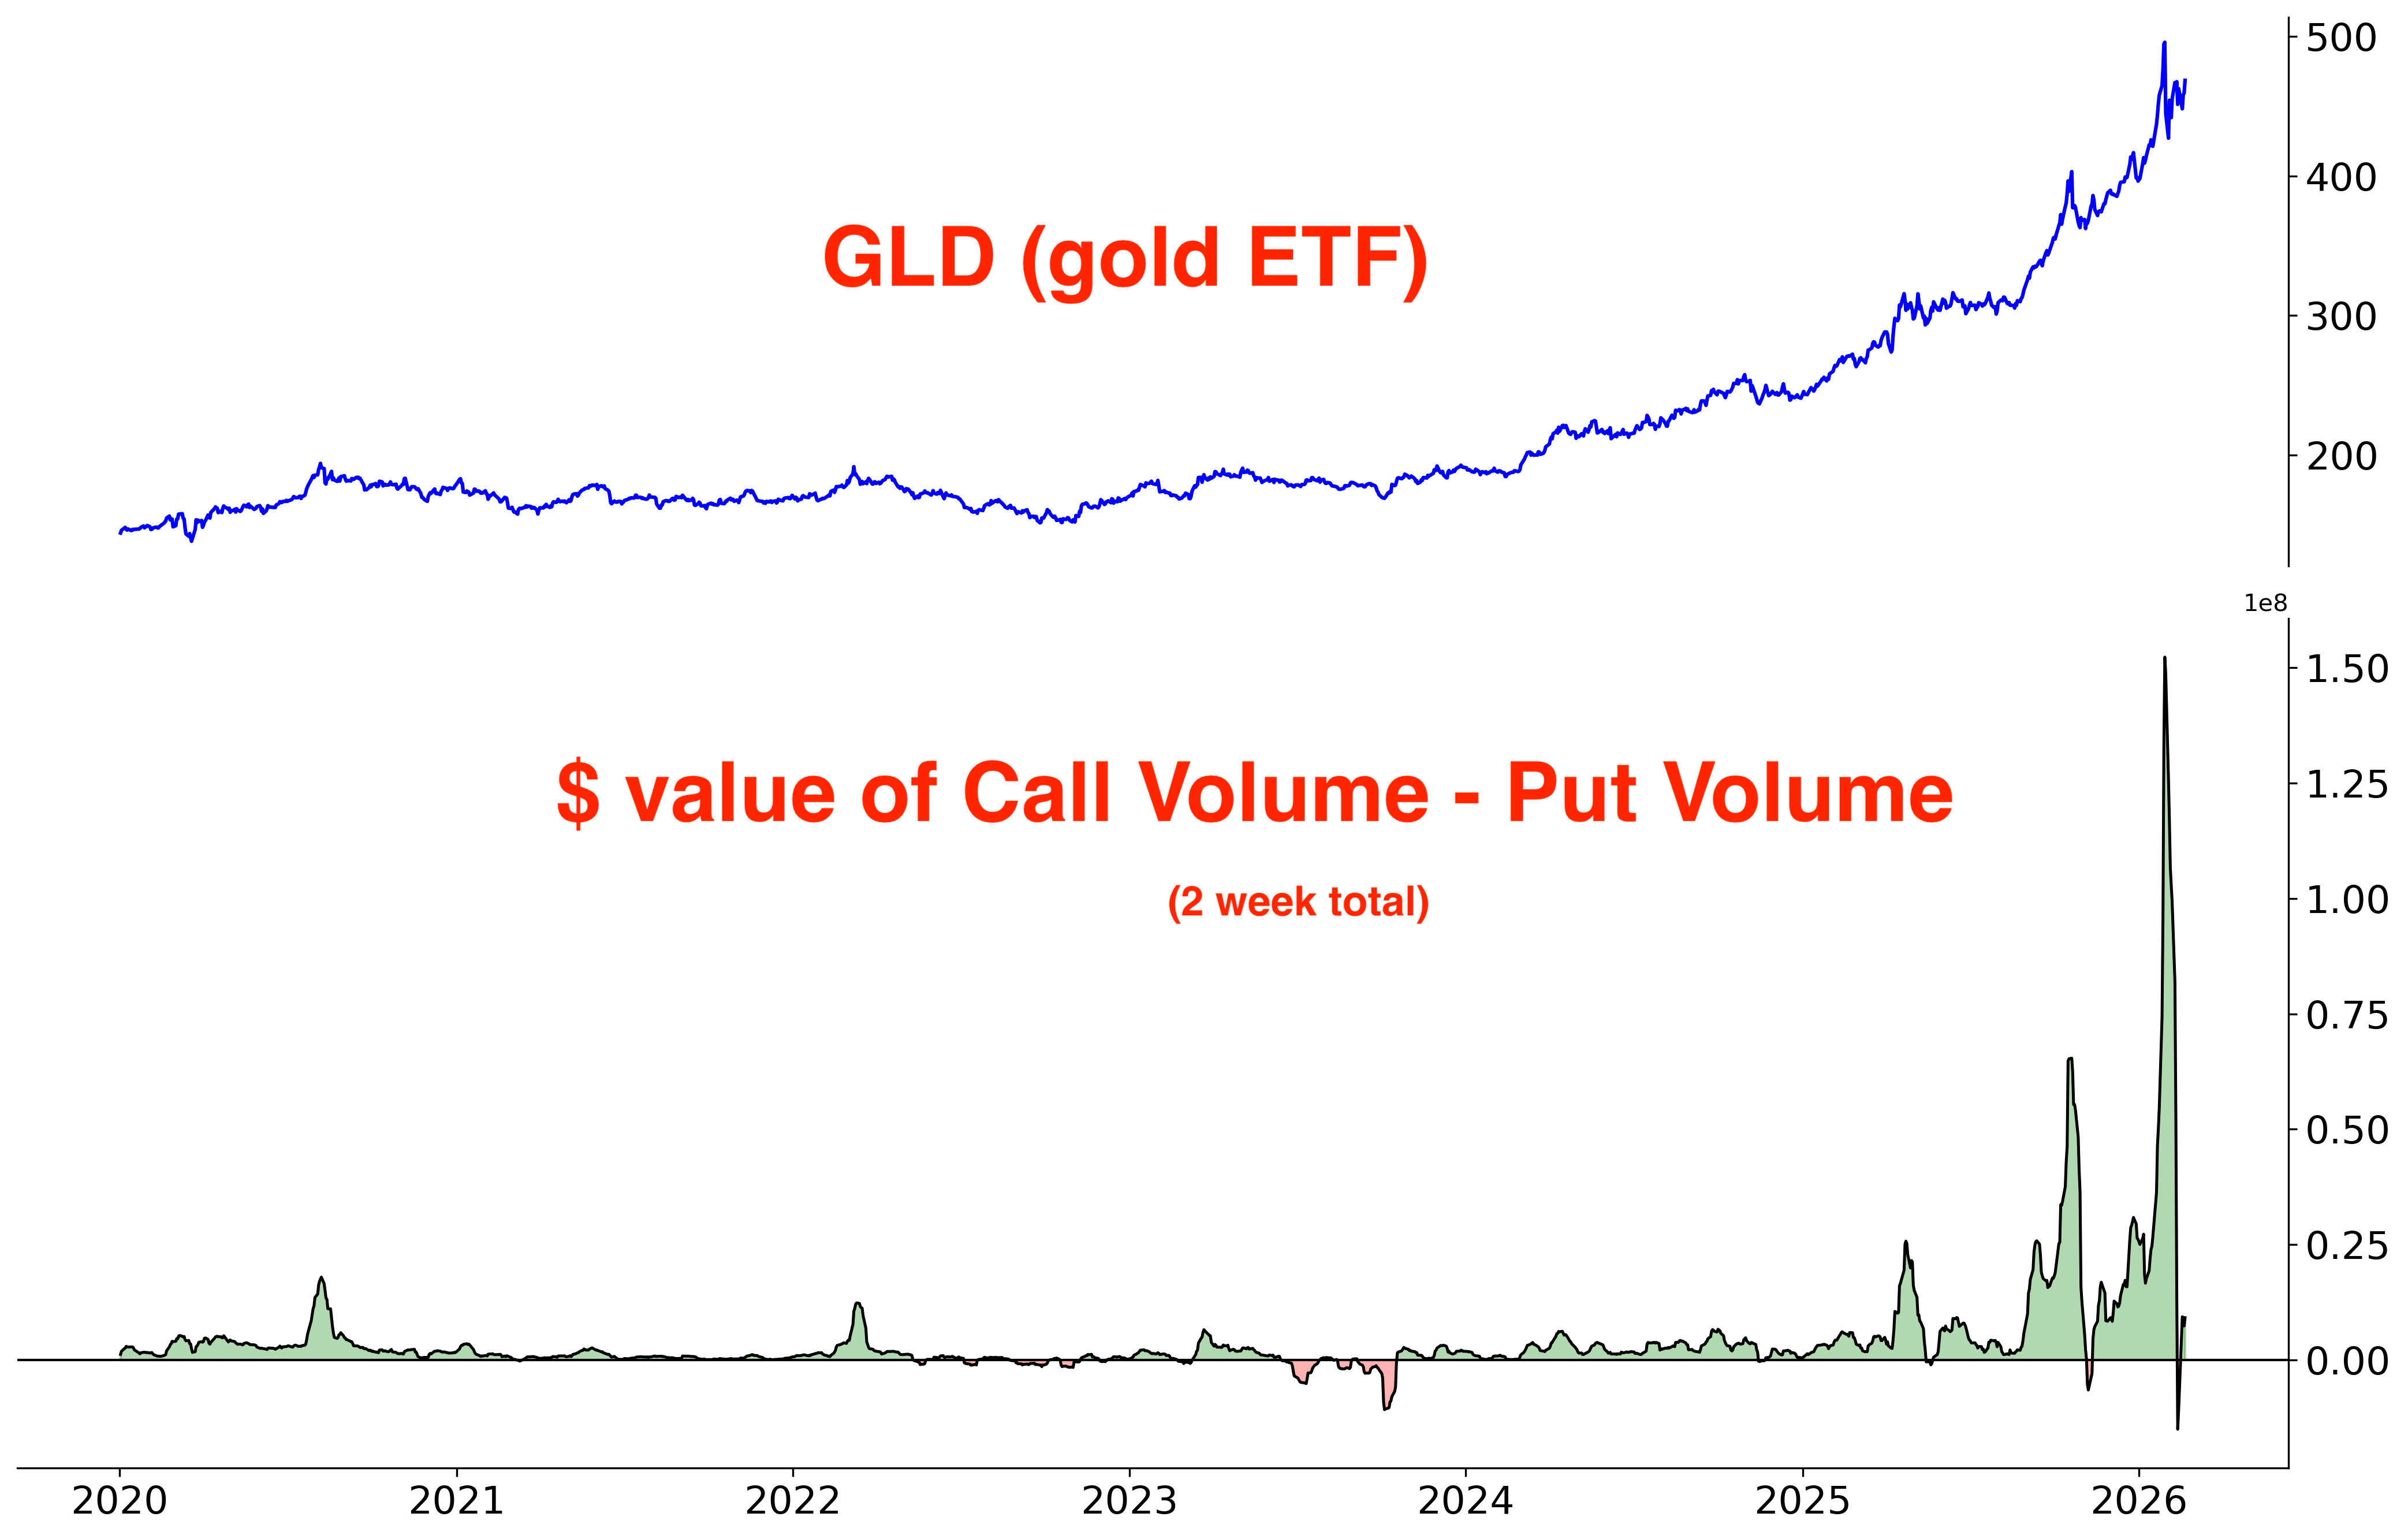
The Dollar’s decline last year coincided with a massive parabolic rally in precious metals.
GLD:
SLV:
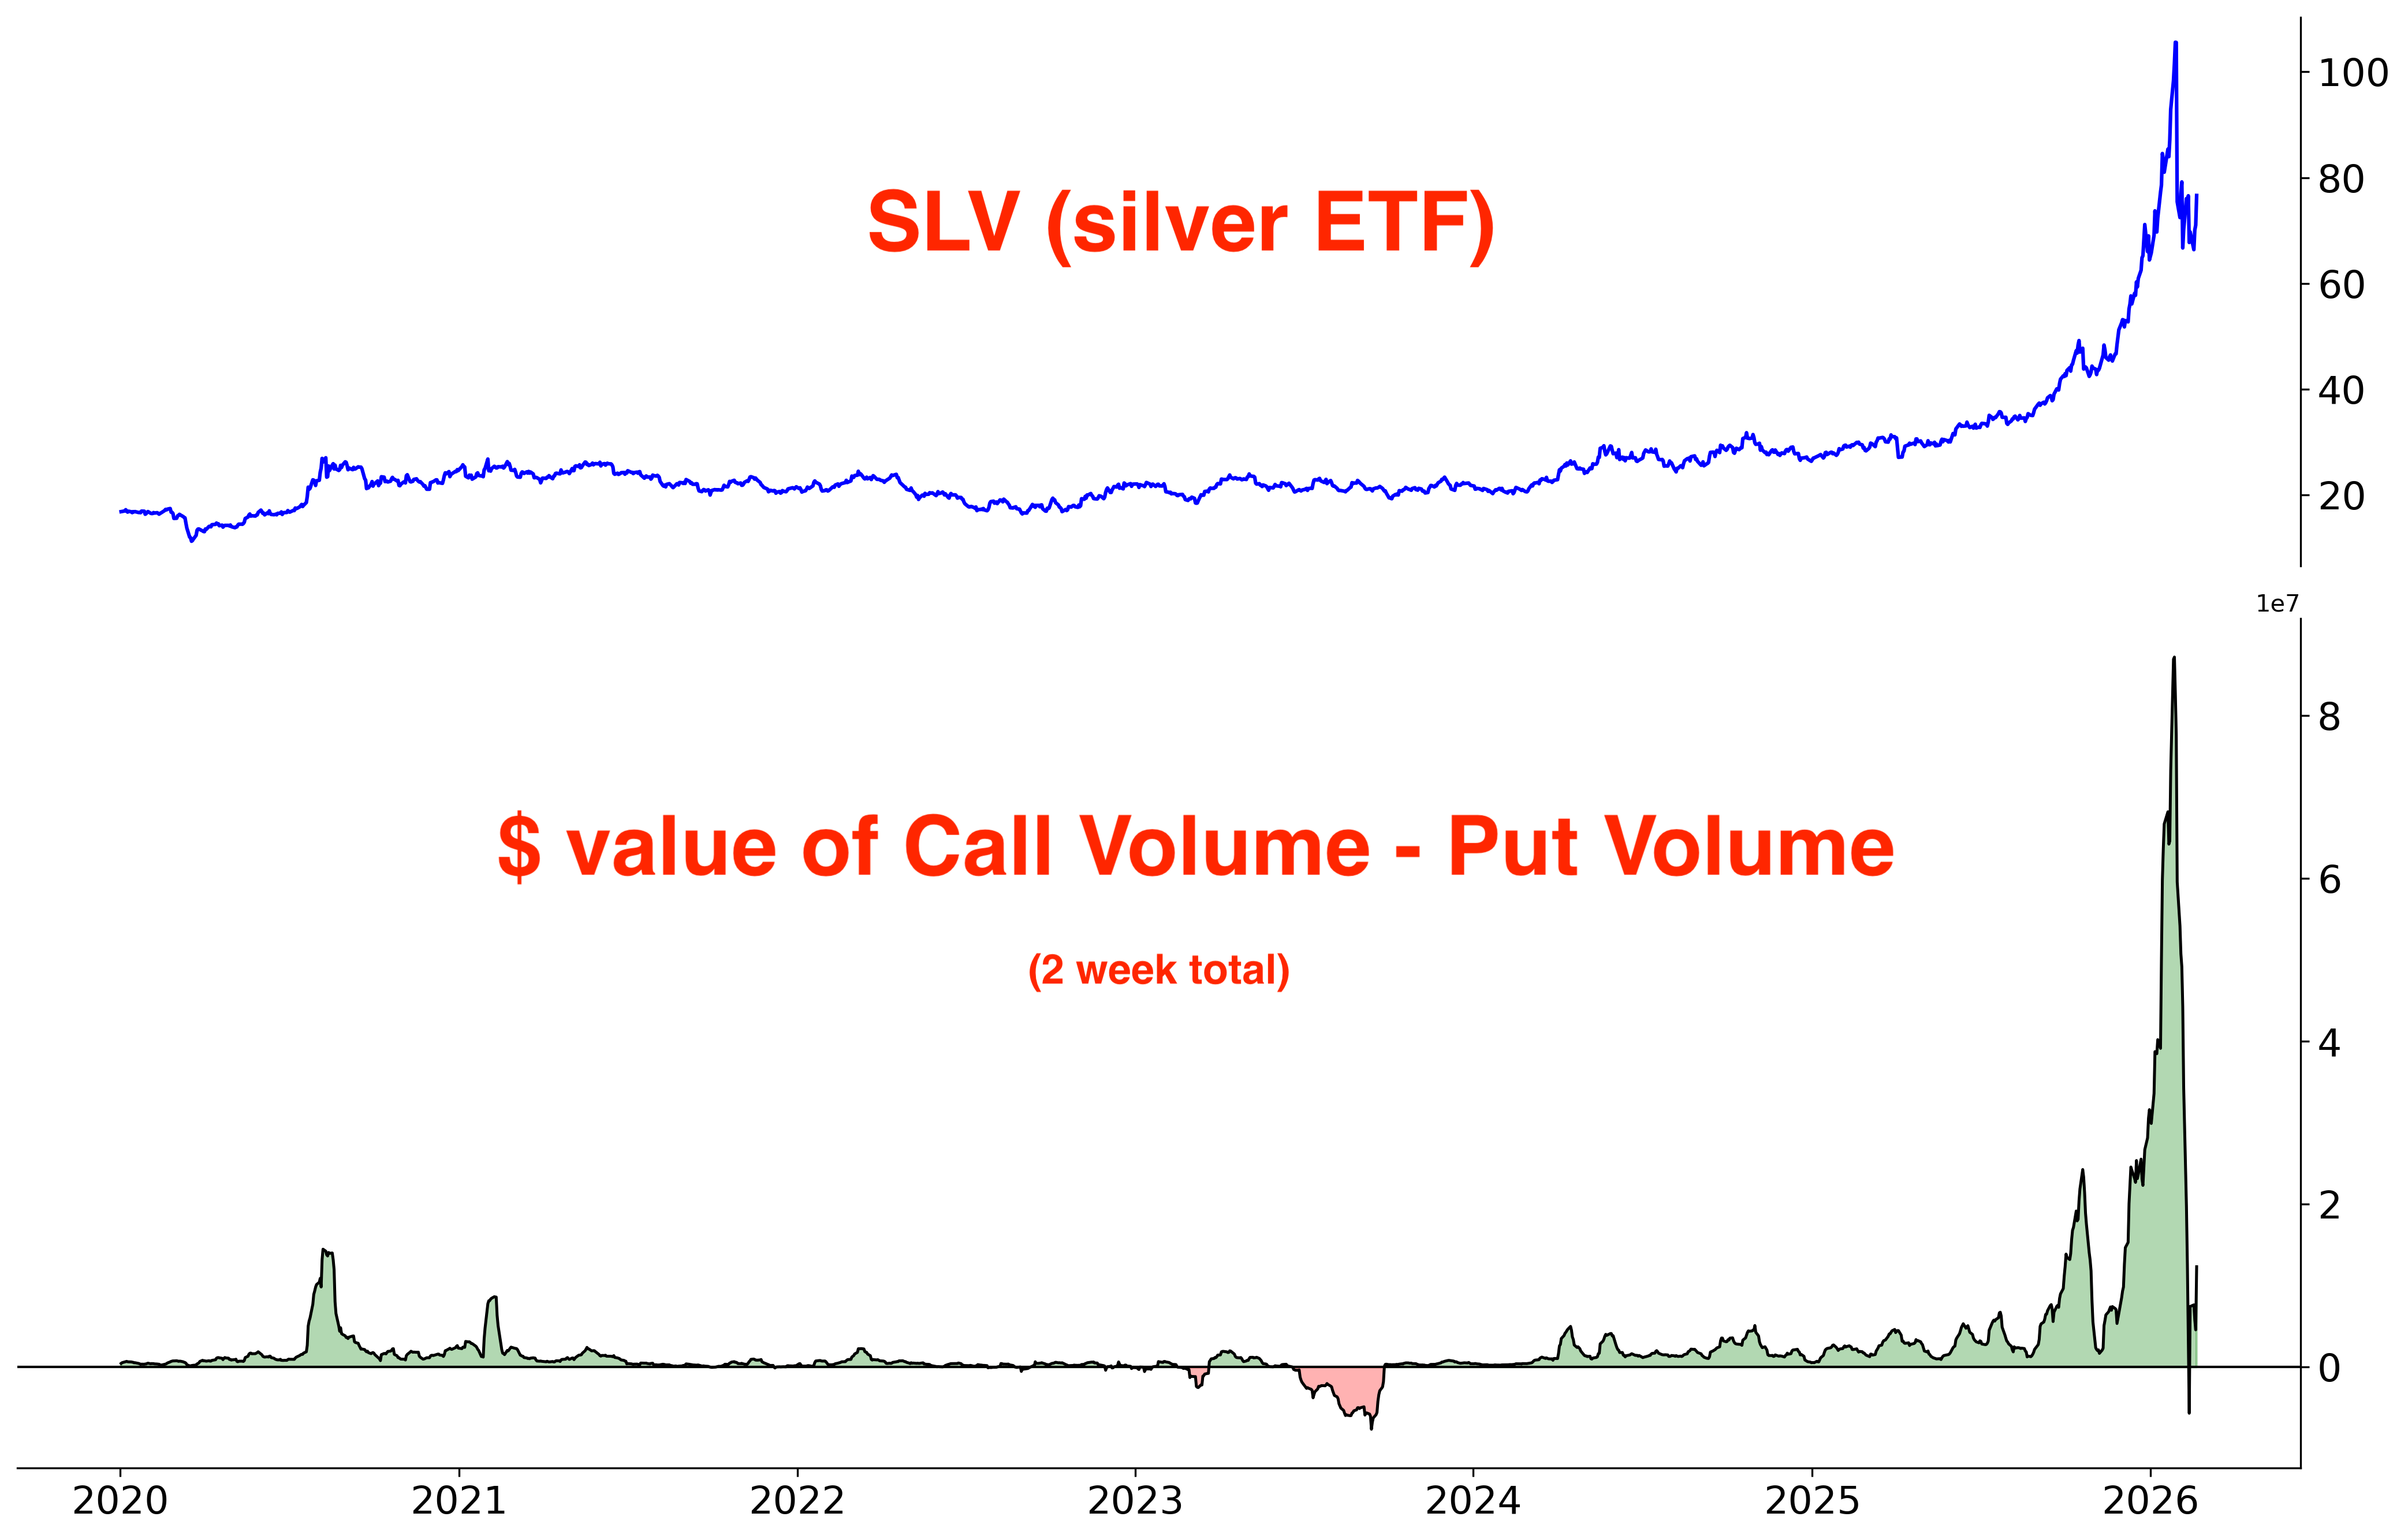
Gold and silver are still supported by central bank diversification away from USD reserves amid ongoing geopolitical tensions: Russia-Ukraine, U.S.–China, Venezuela, Iran, etc. That longer-term structural bid will probably persist for years given how slowly central banks re-allocate, but a medium-term squeeze in crowded bearish-USD positioning could temporarily cap upside in precious metals.
Great writeup brotha!
Thank you!