
30+ Must-See Charts: Markets in Turmoil Edition
Not there yet.

I’m breaking down 30+ must-see charts and what they signal for global markets.
As the Iran war shakes global markets, investors are increasingly pricing in a “higher-for-longer” oil regime. This is rippling across equities, crypto, commodities, bonds, and currencies. The following charts suggest we’re approaching a buyable extreme, but we’re not quite there yet.
U.S. Equities
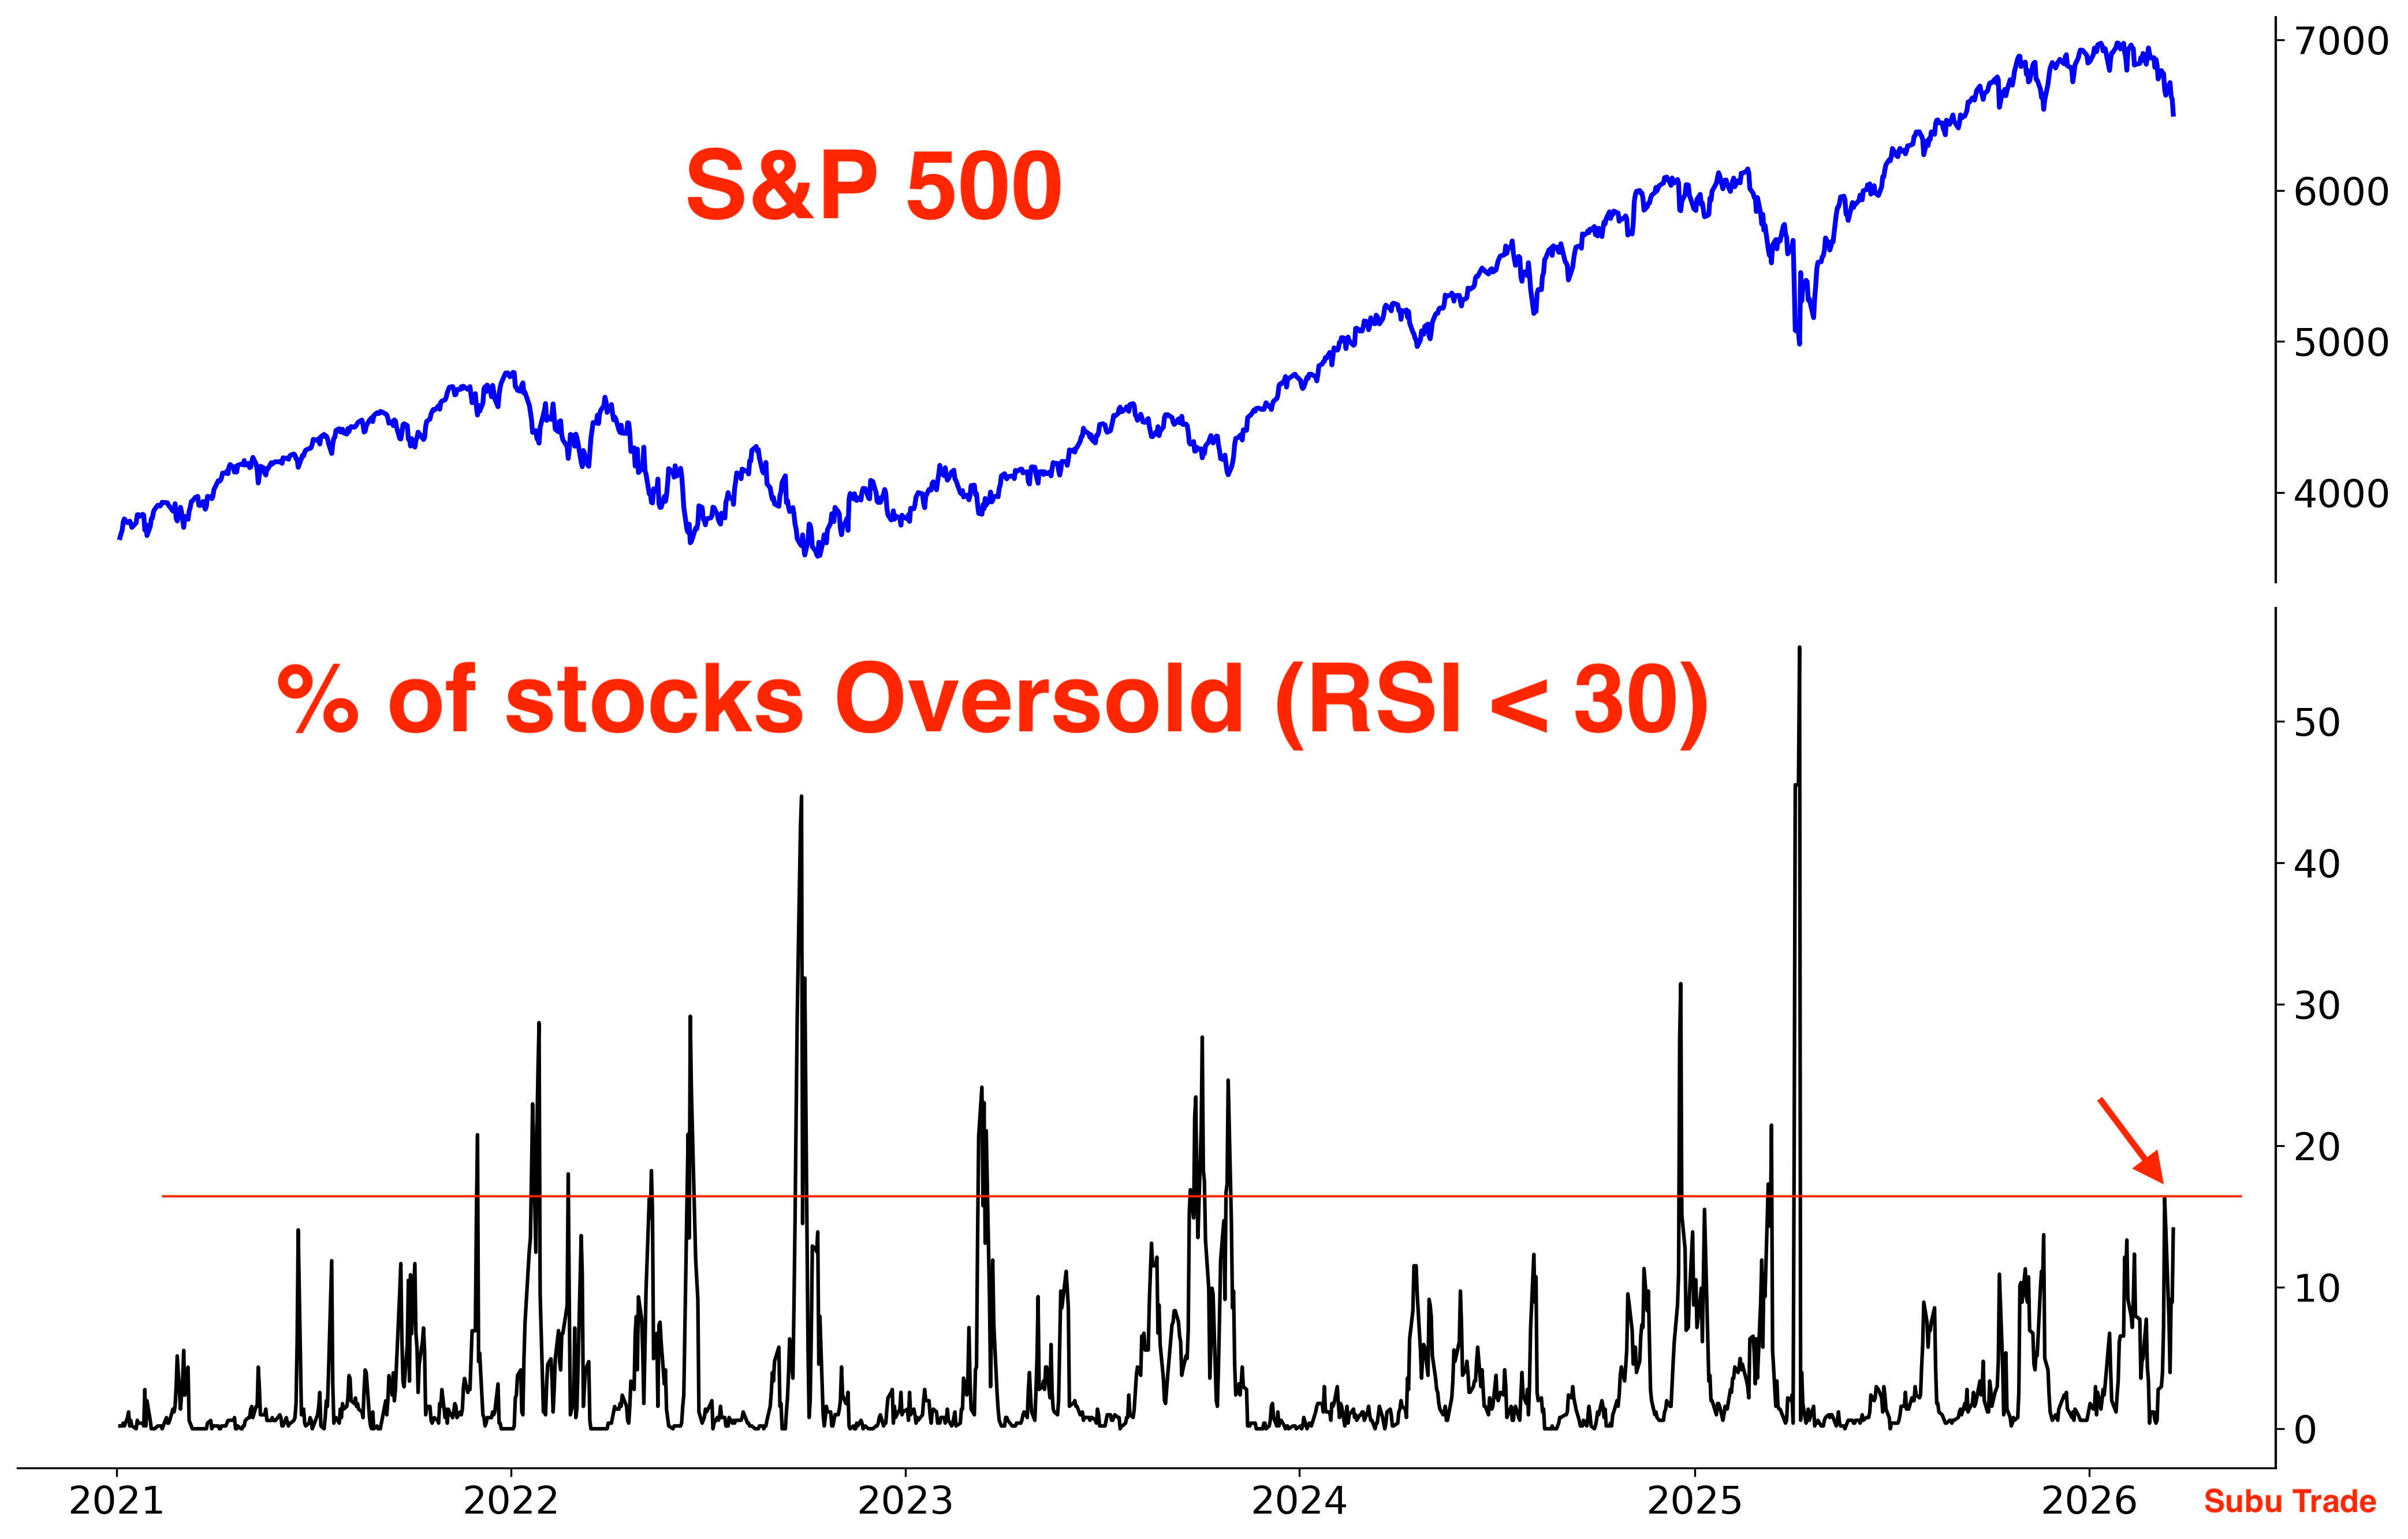
Despite the pullback in stocks, we haven’t seen a big spike in the % of stocks that are oversold. The selloff has been relatively orderly so far, indicating that investors are still holding onto hope of a resolution to the Iran conflict:
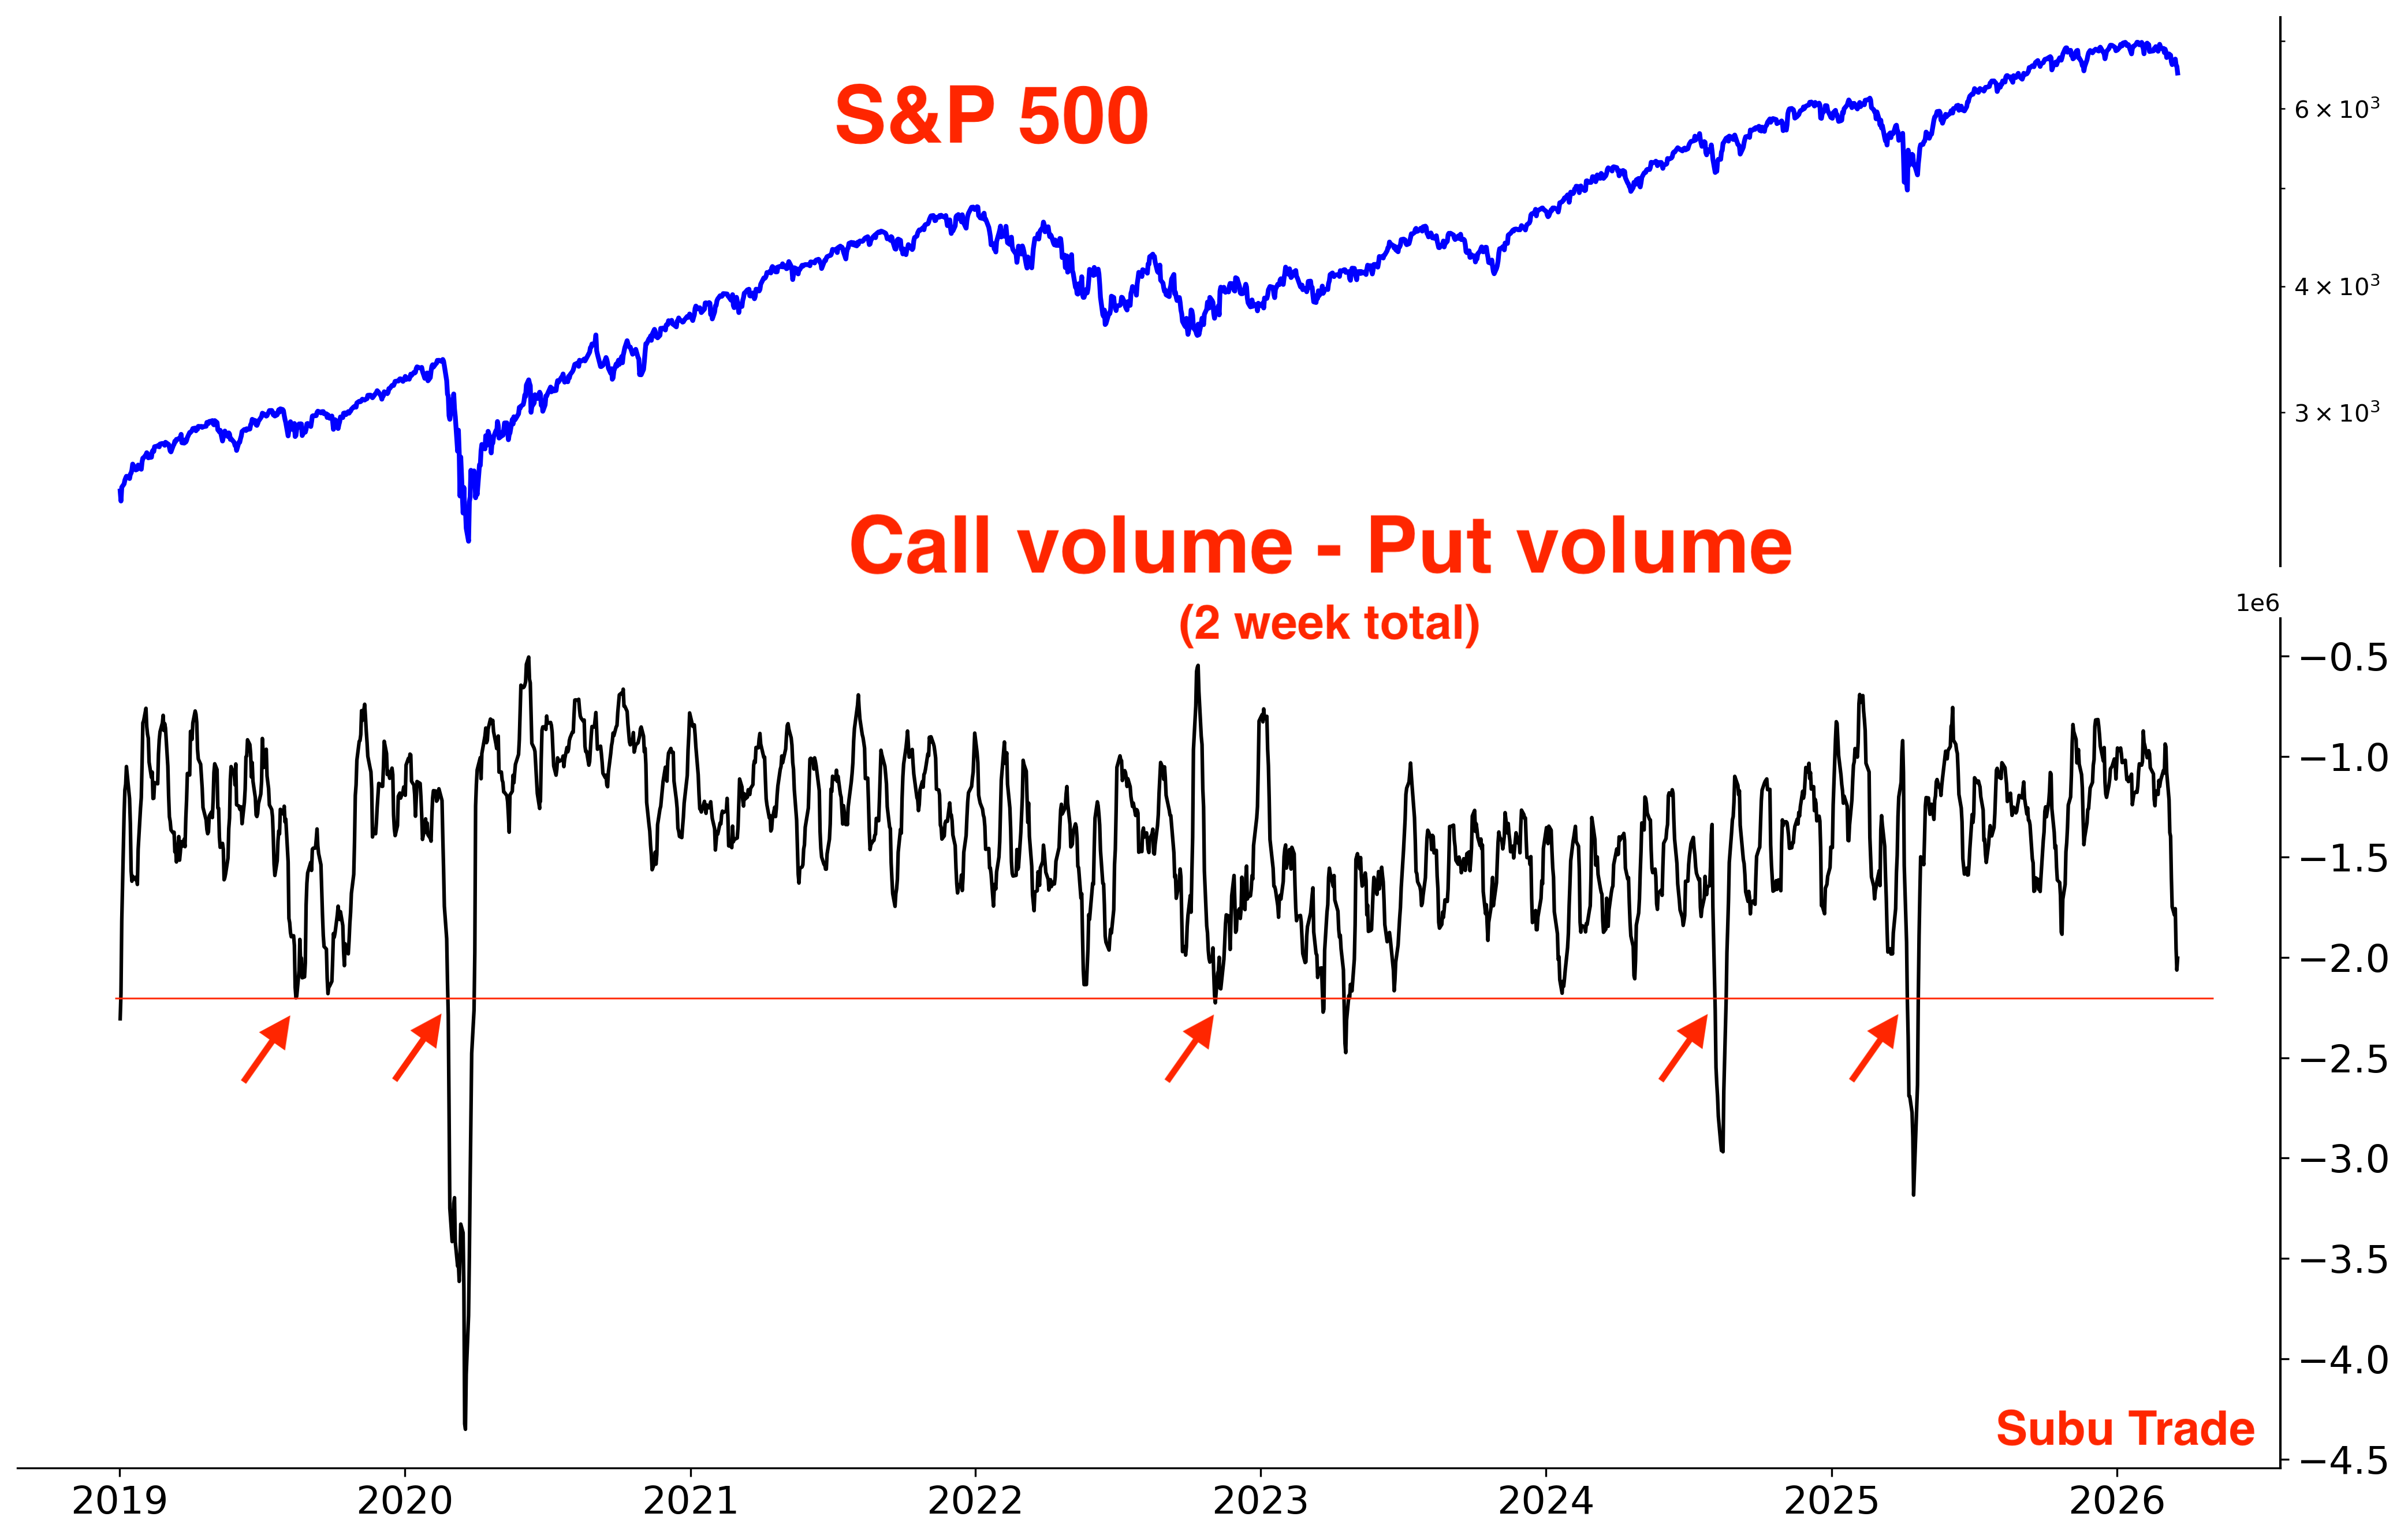
The volume of S&P 500 Calls - volume of Puts spiked down as traders scramble for protection. This could go lower:
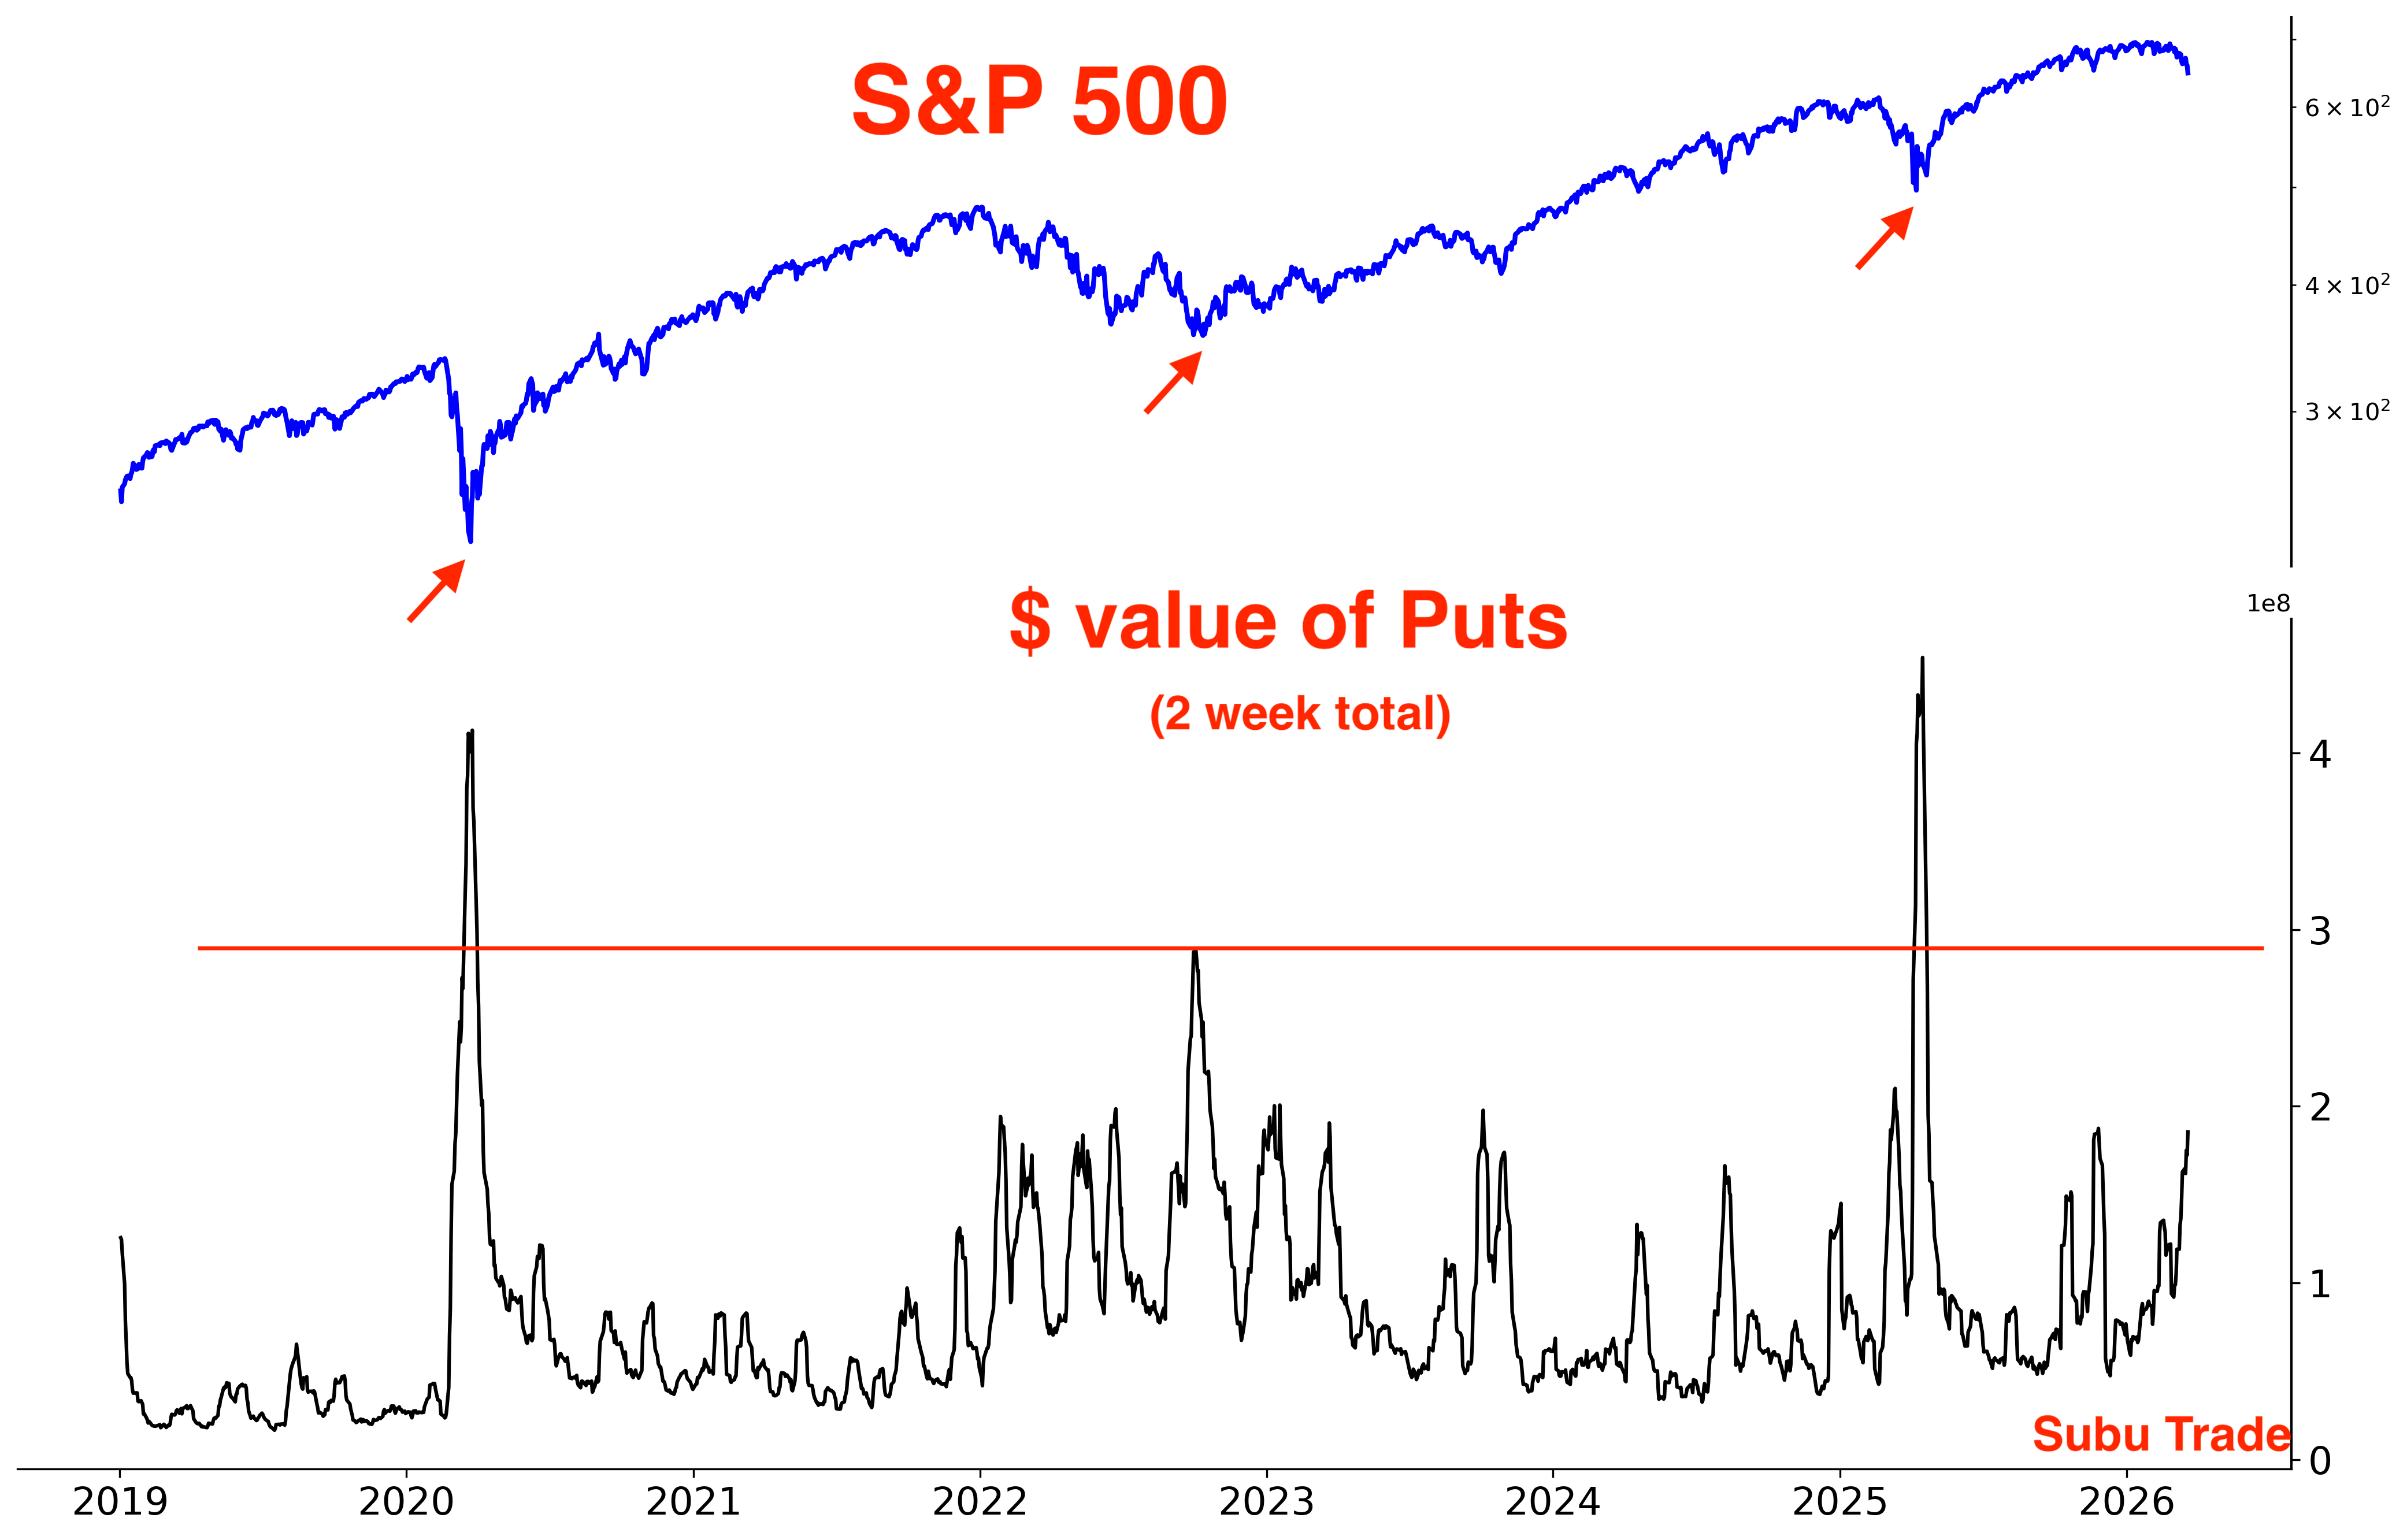
The dollar value of those Puts is creeping up, but not at real Panic levels yet:
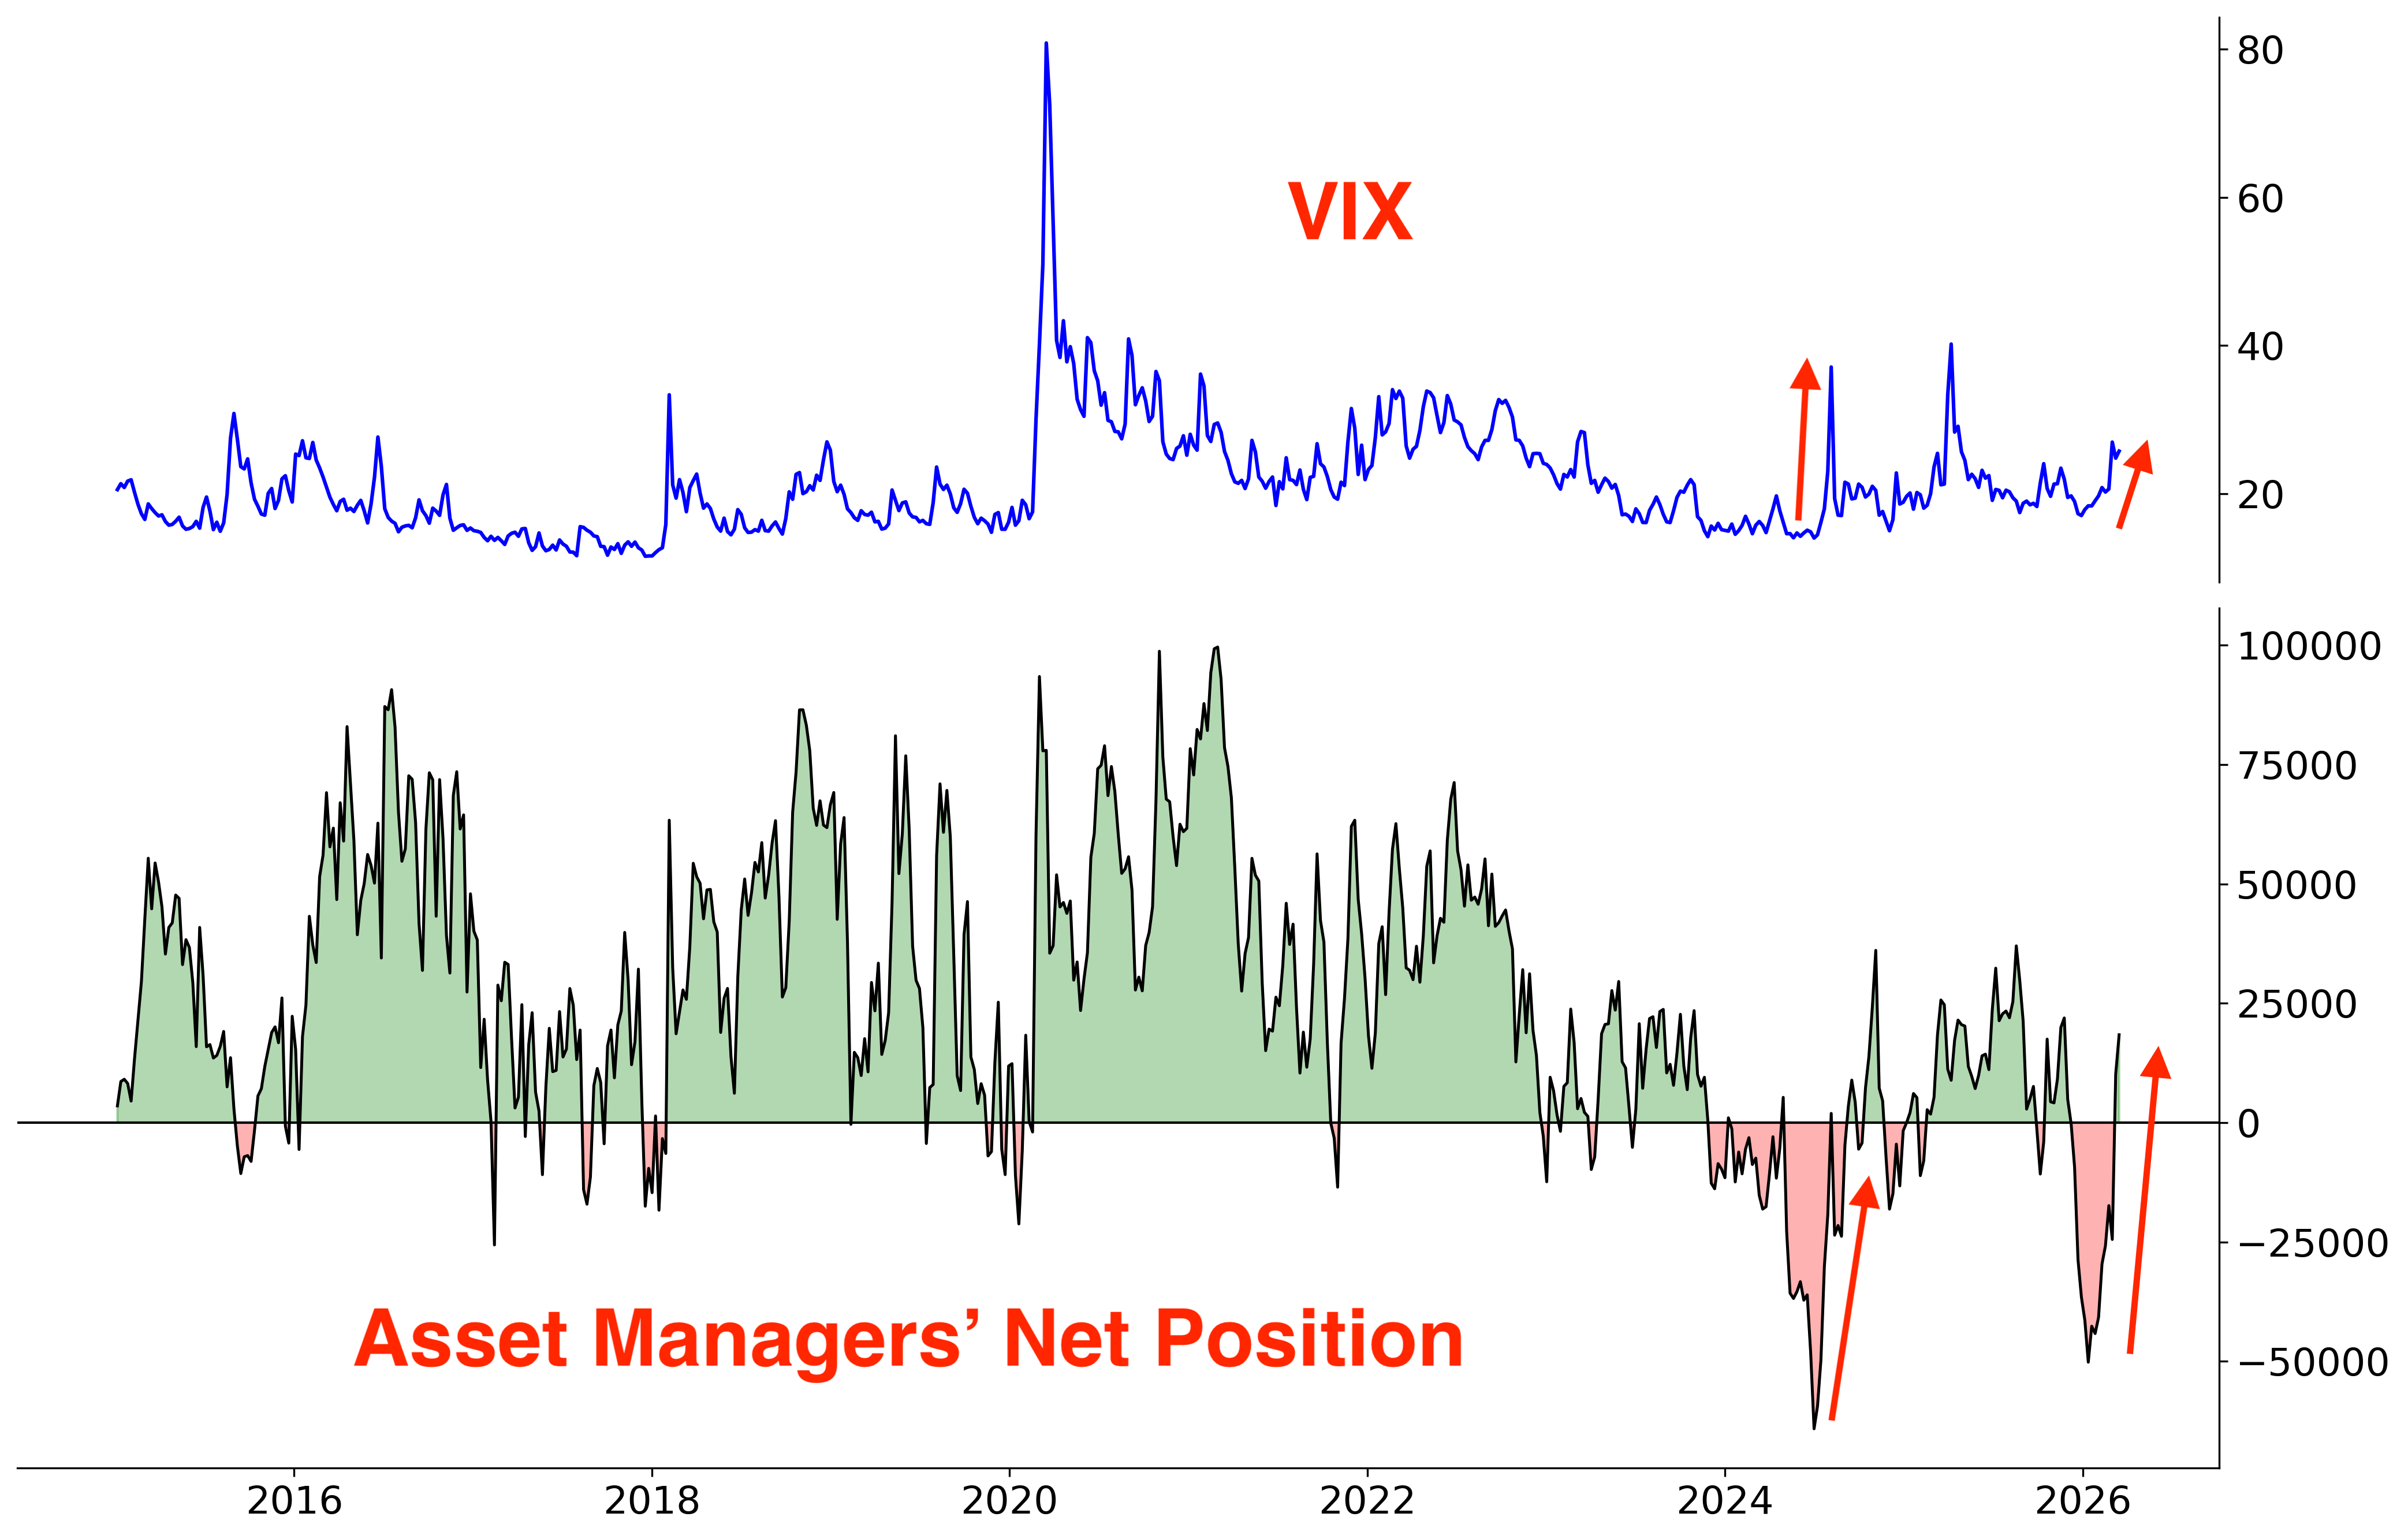
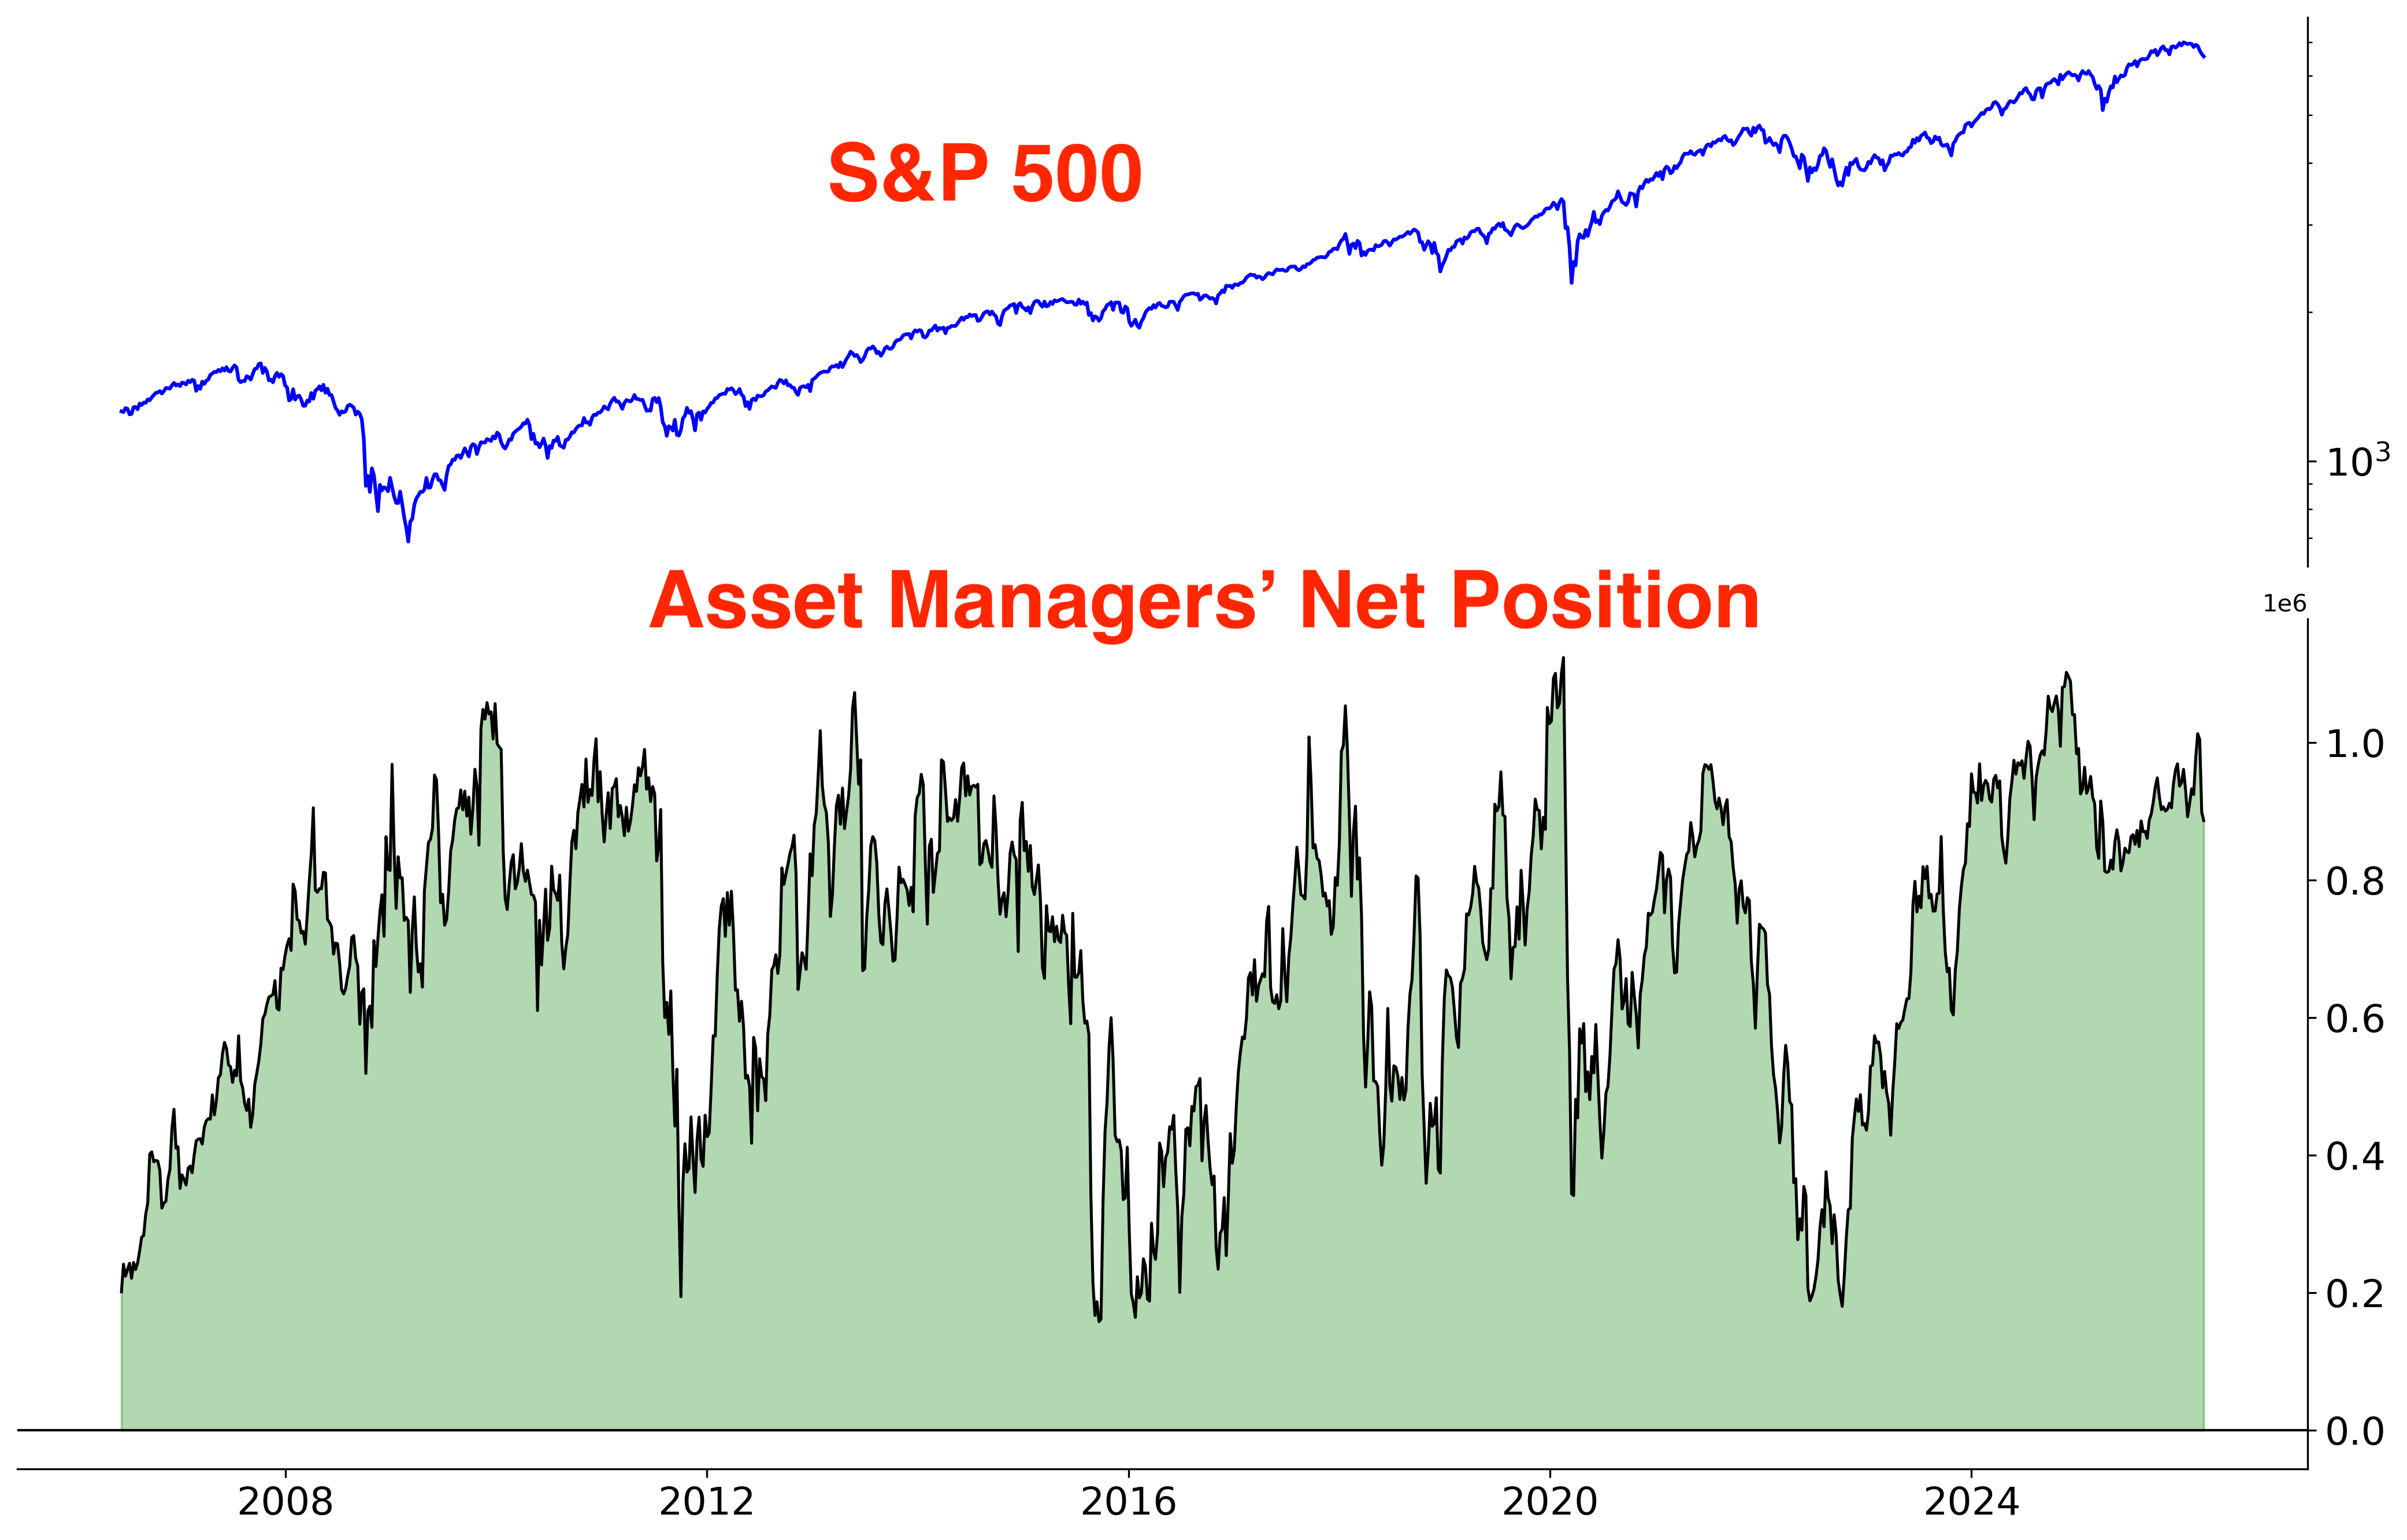
In December I highlighted the extreme positioning towards vol from Asset Managers, which matched levels seen before the August 2024 VIX blow-up. Those Asset Managers are now un-winding their near-record Short positions:
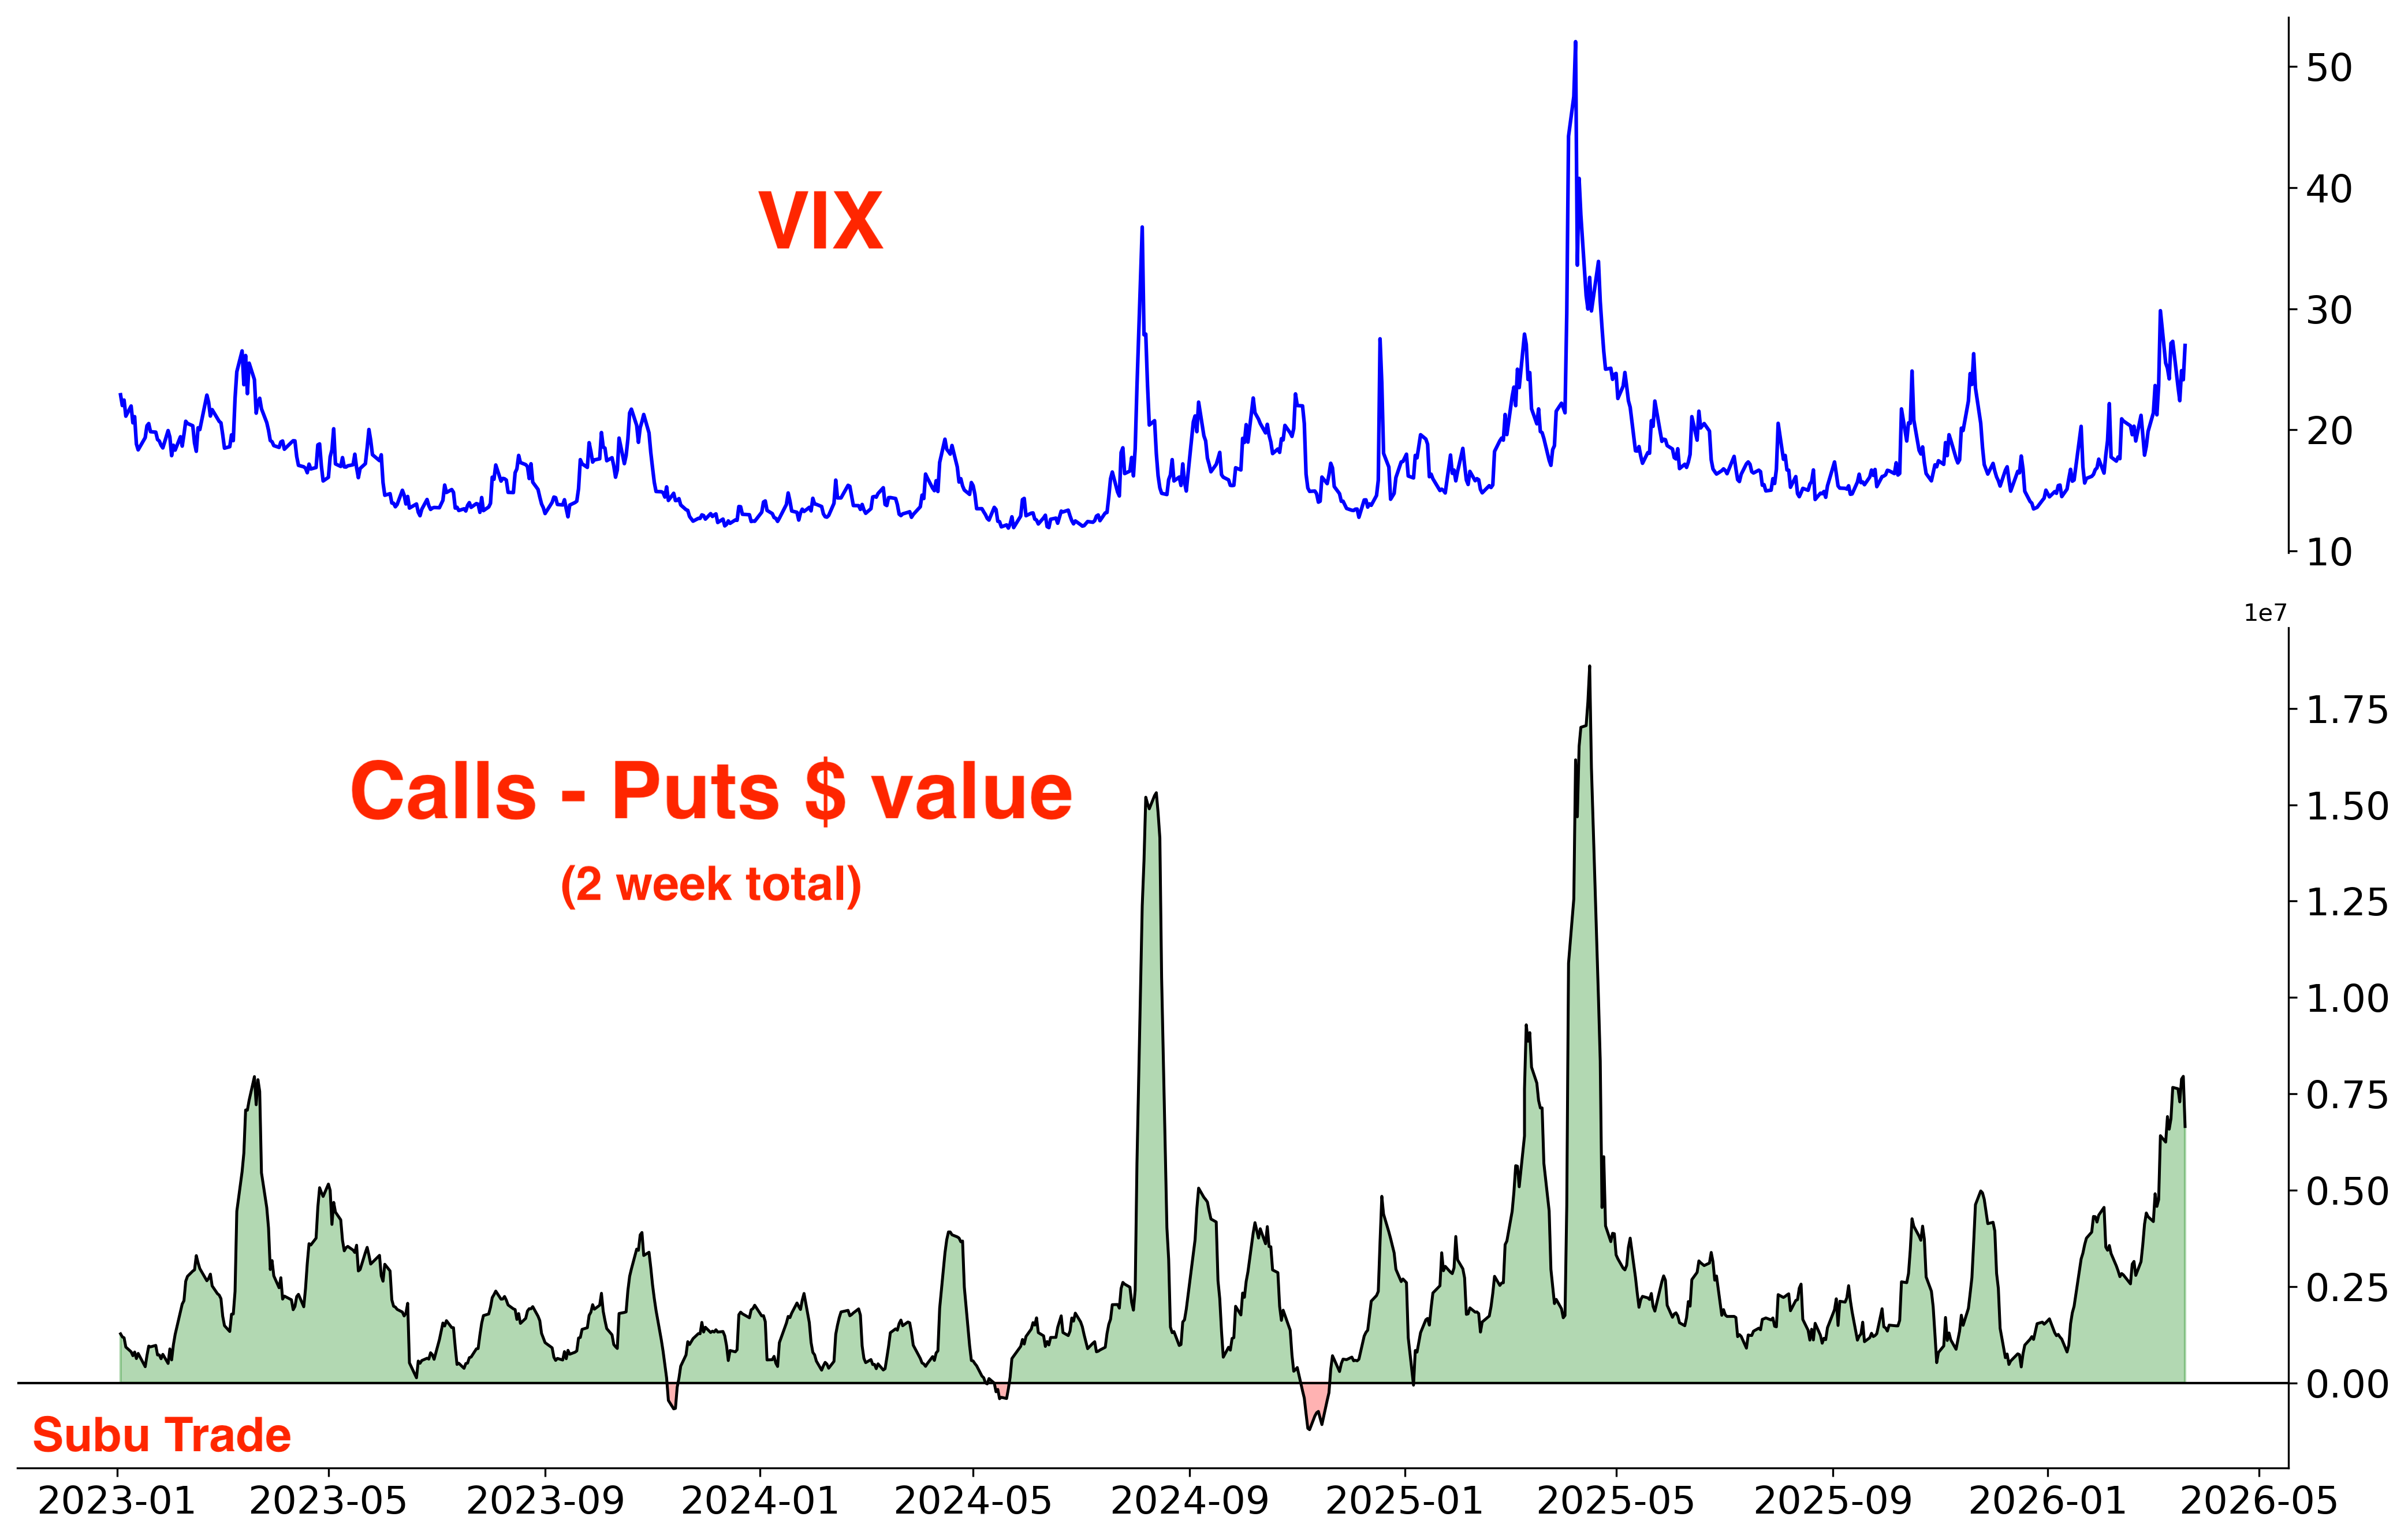
Traders who bought VIX Calls are starting to print money, as seen via the dollar value of VIX Calls - the dollar value of VIX Puts:
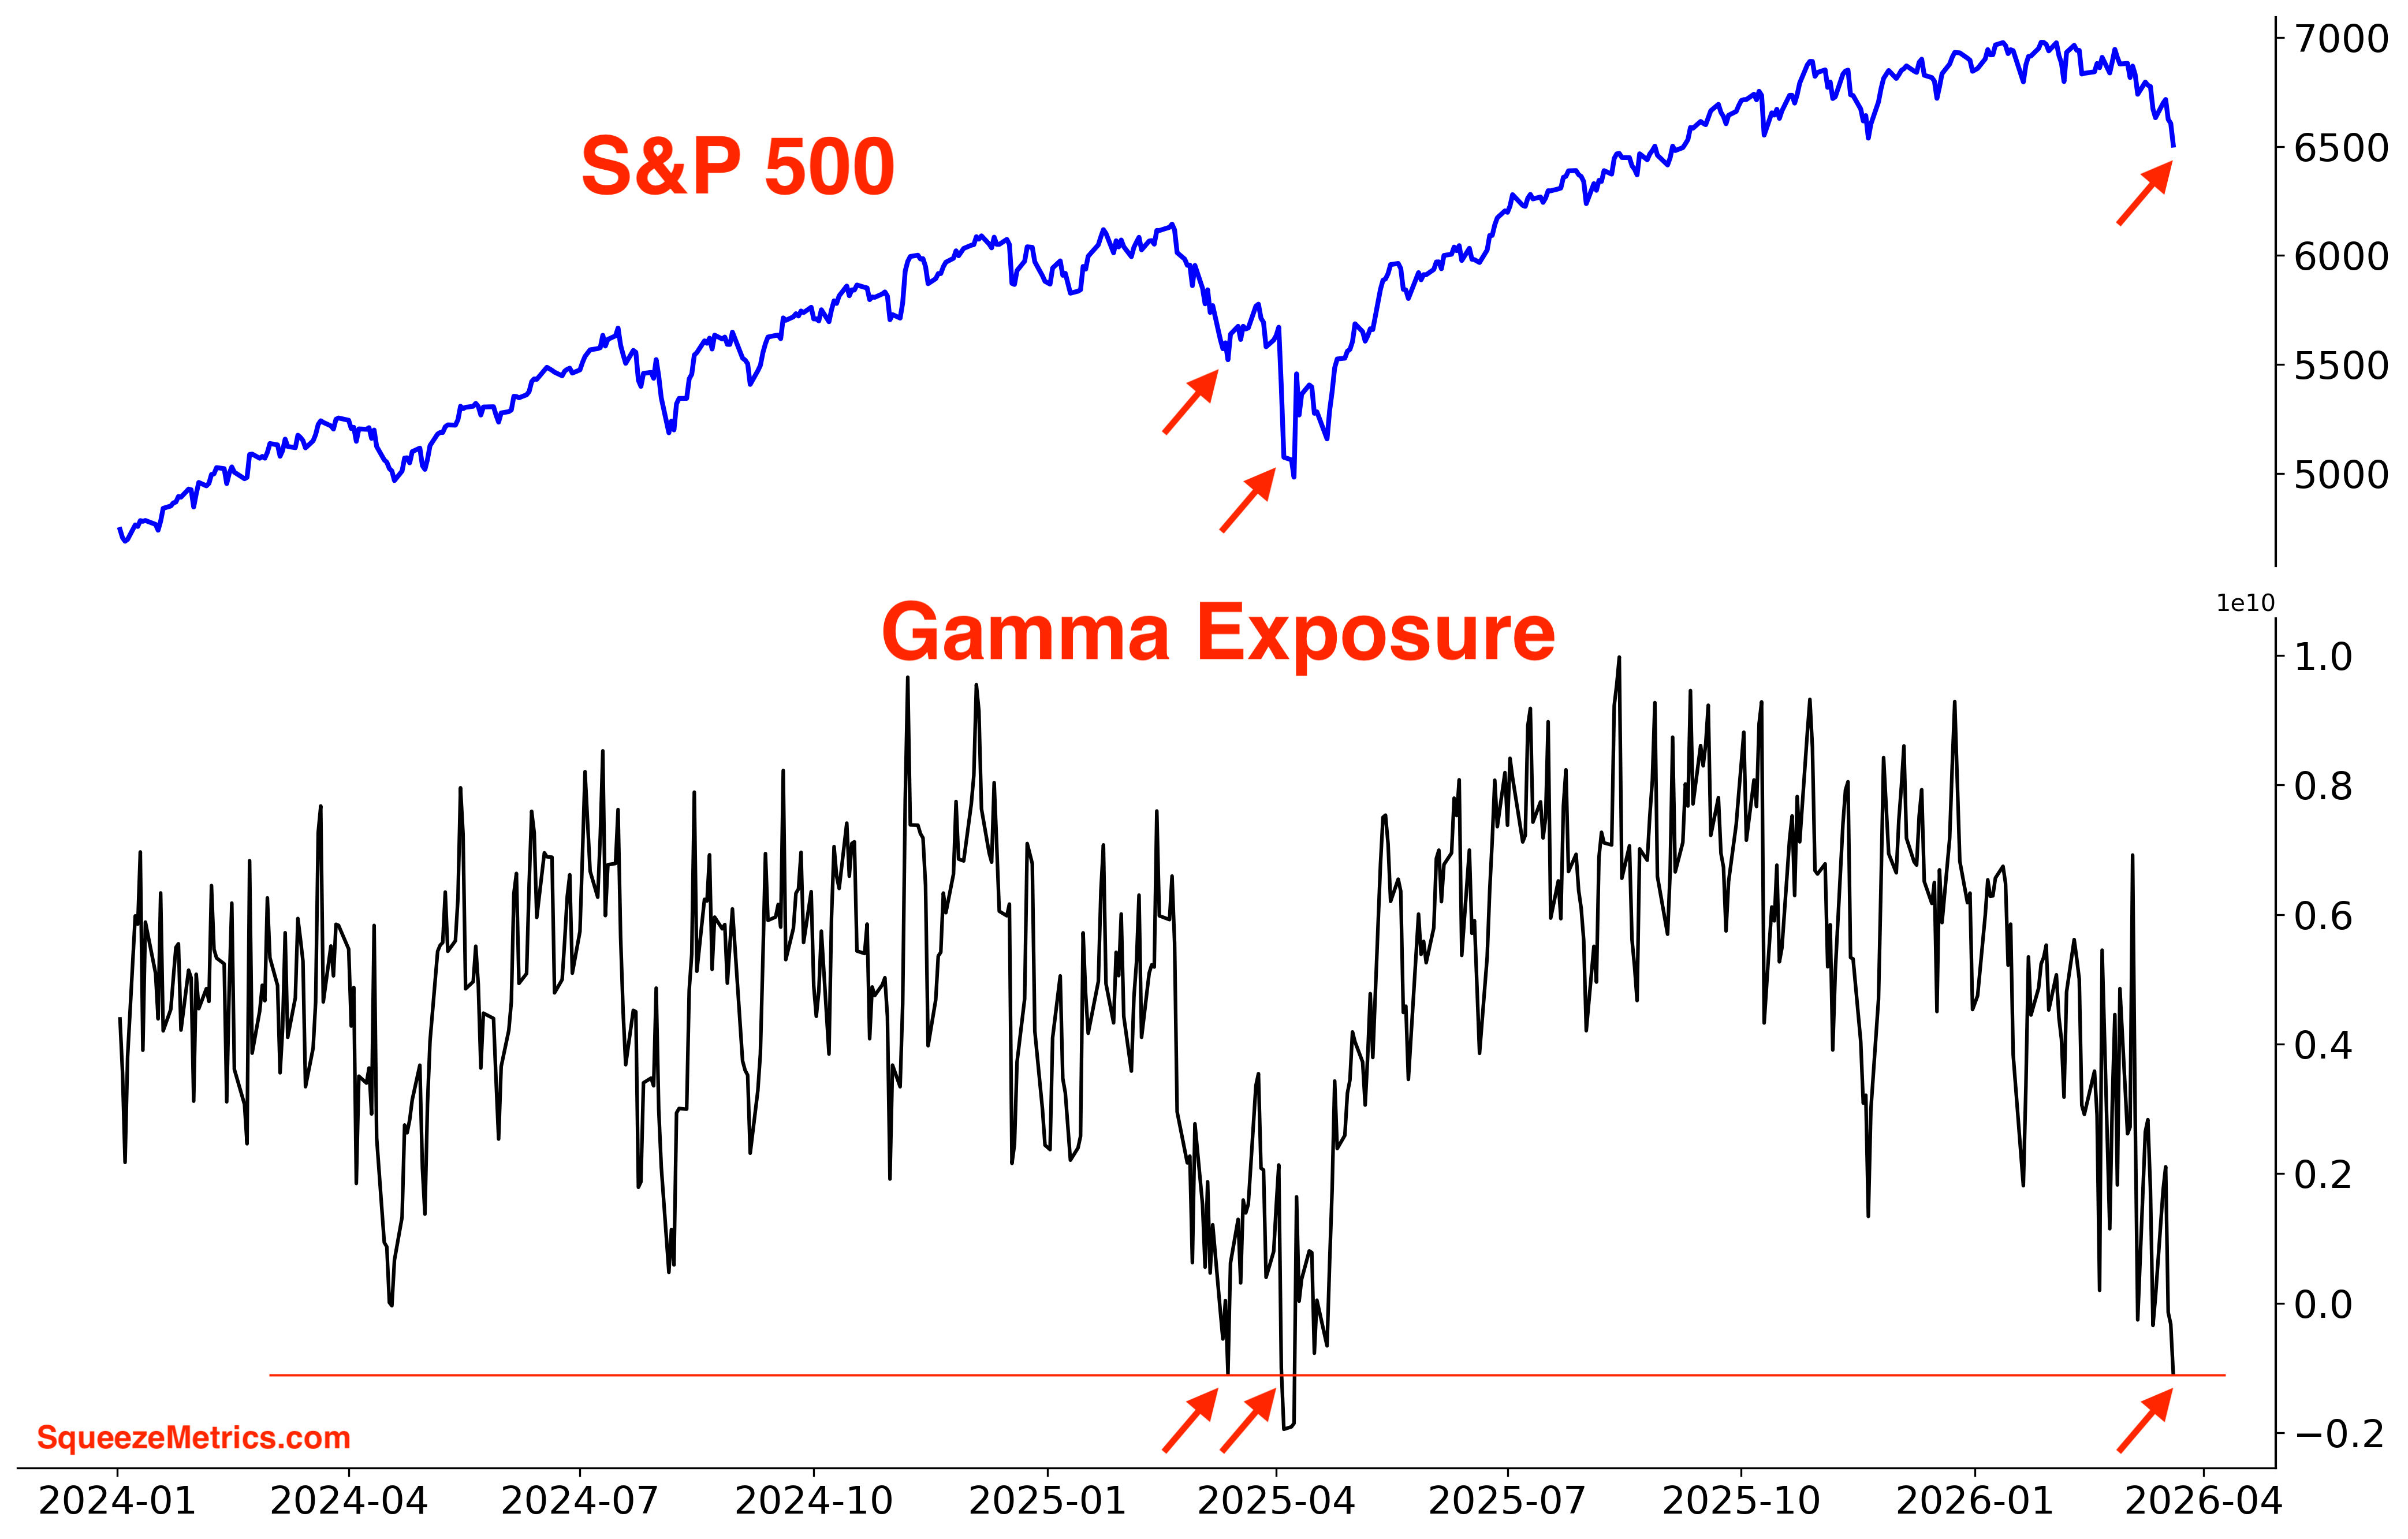
Gamma Exposure is down to levels seen last April (from Squeeze Metrics):
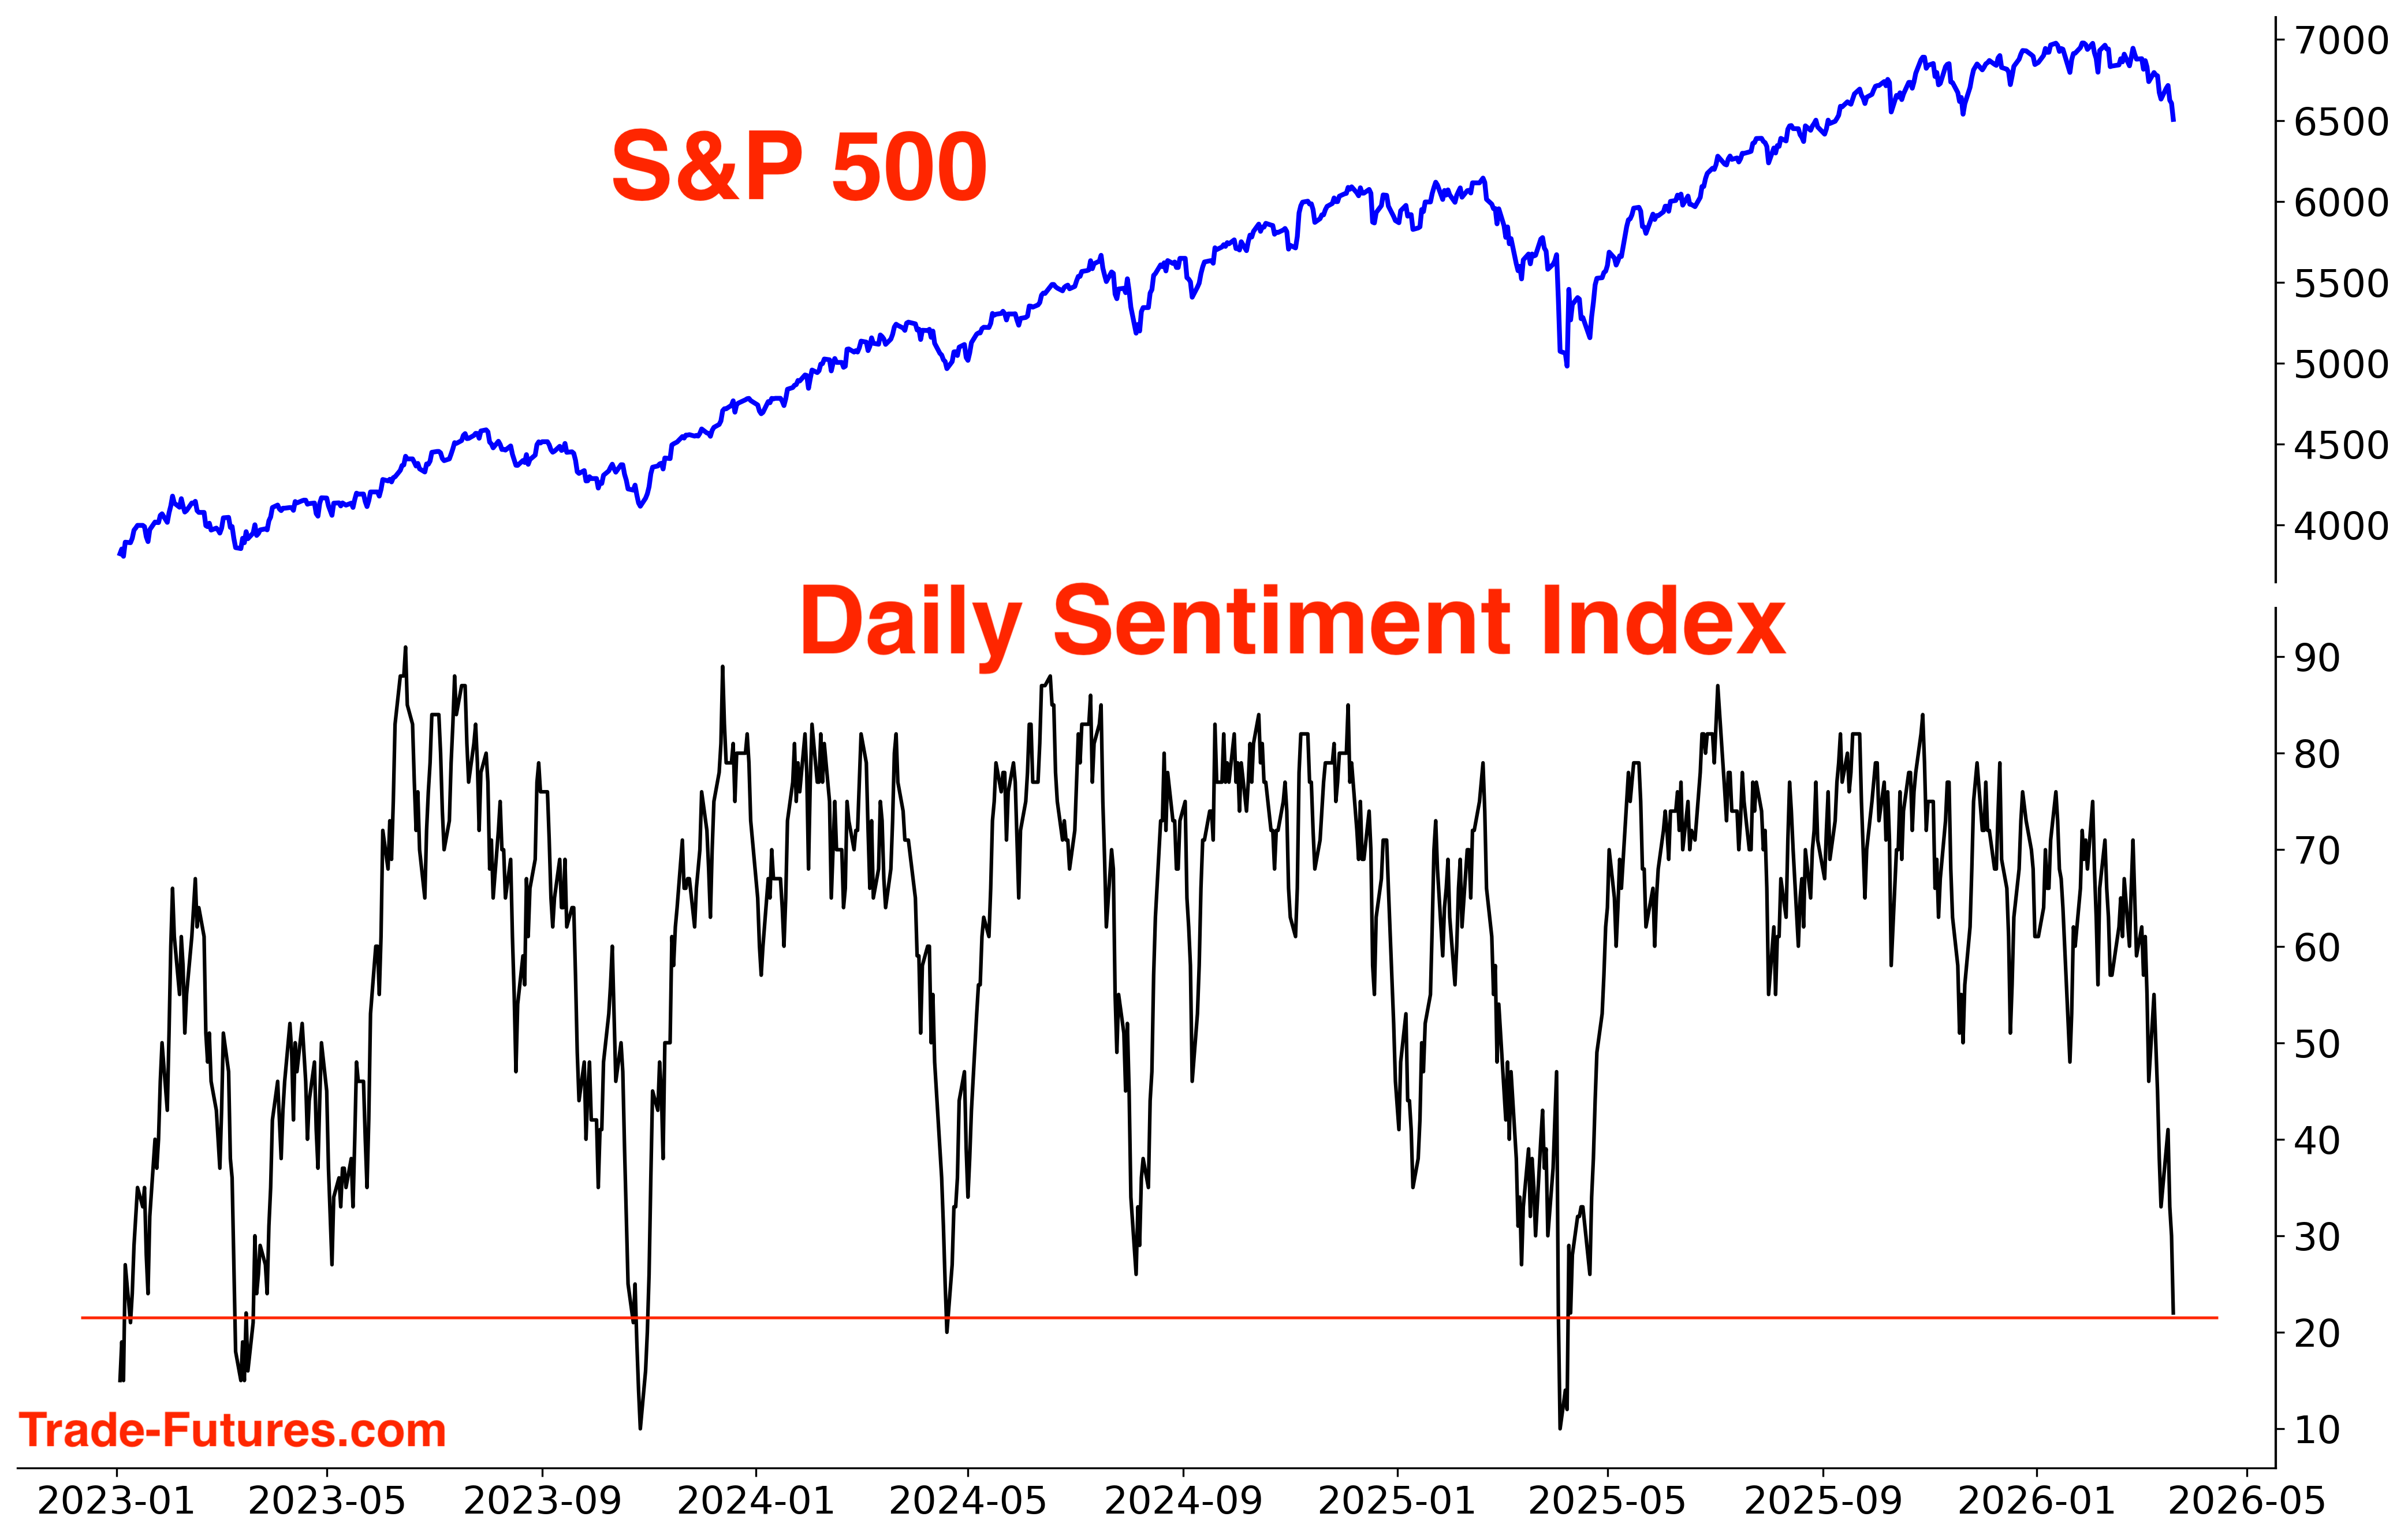
S&P 500’s Daily Sentiment Index (DSI) is coming down, getting close to Extreme Pessimism levels. It would be nice to see DSI get into the Teens:
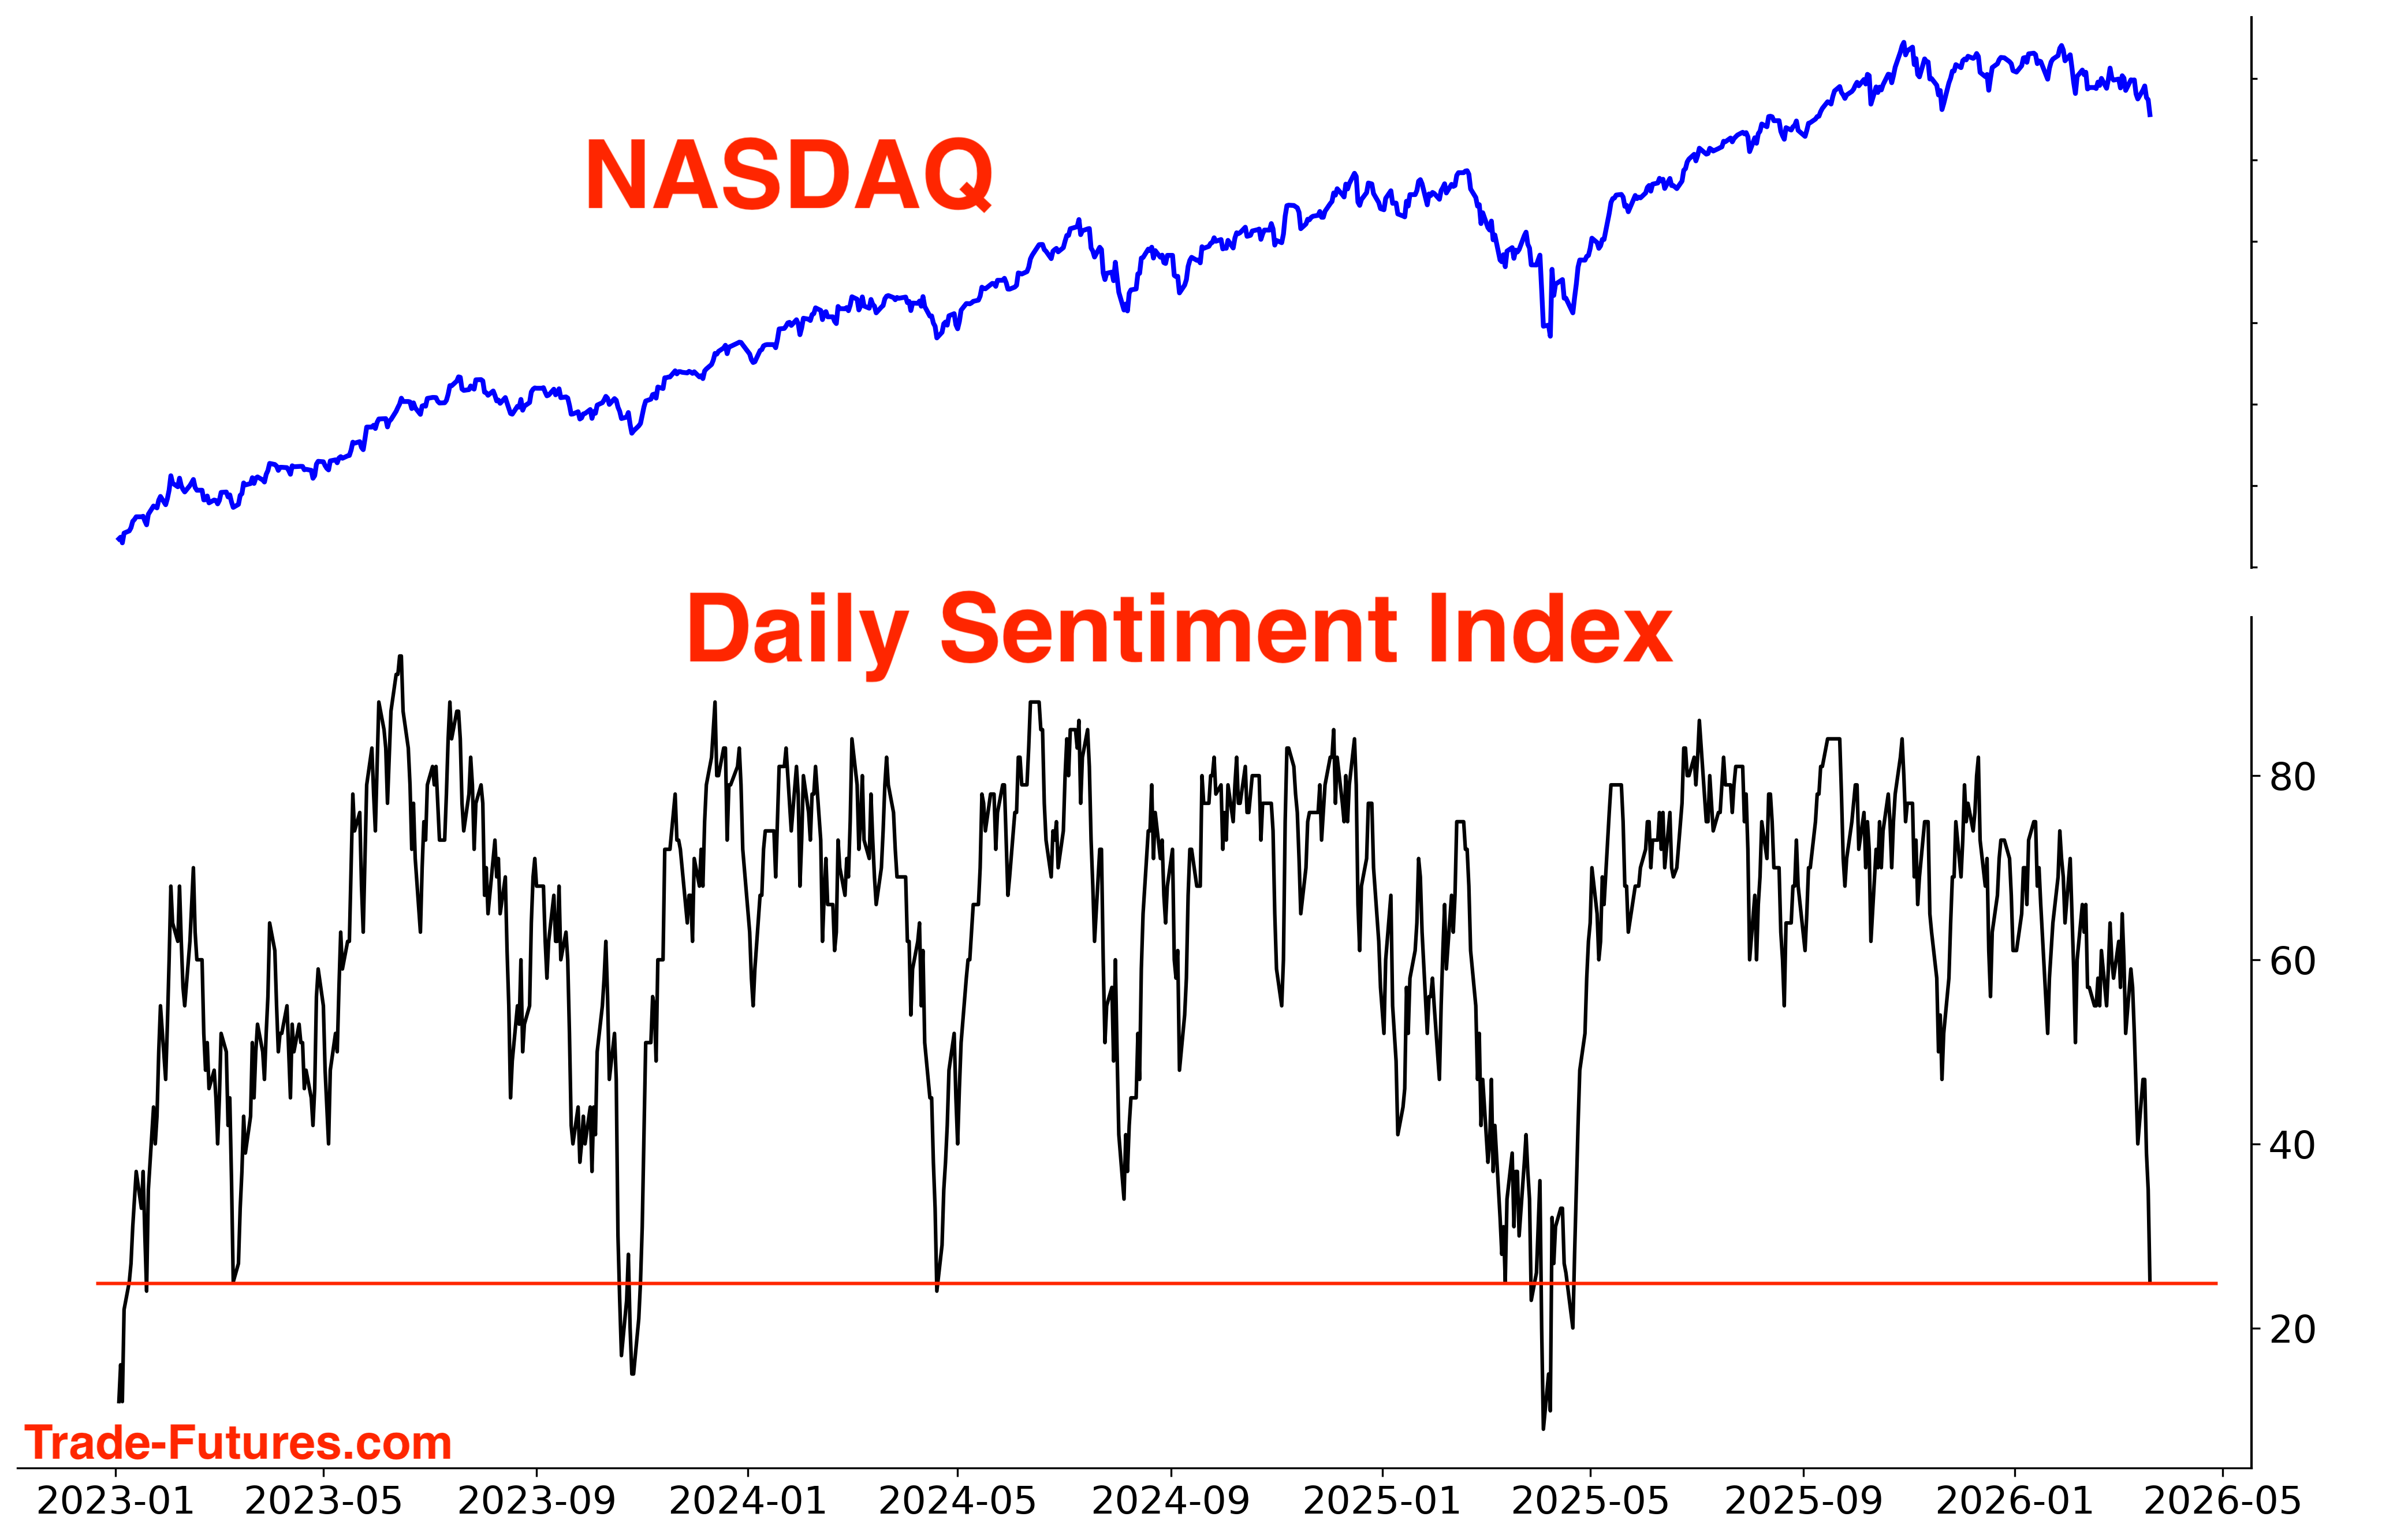
NASDAQ Daily Sentiment Index is coming down:
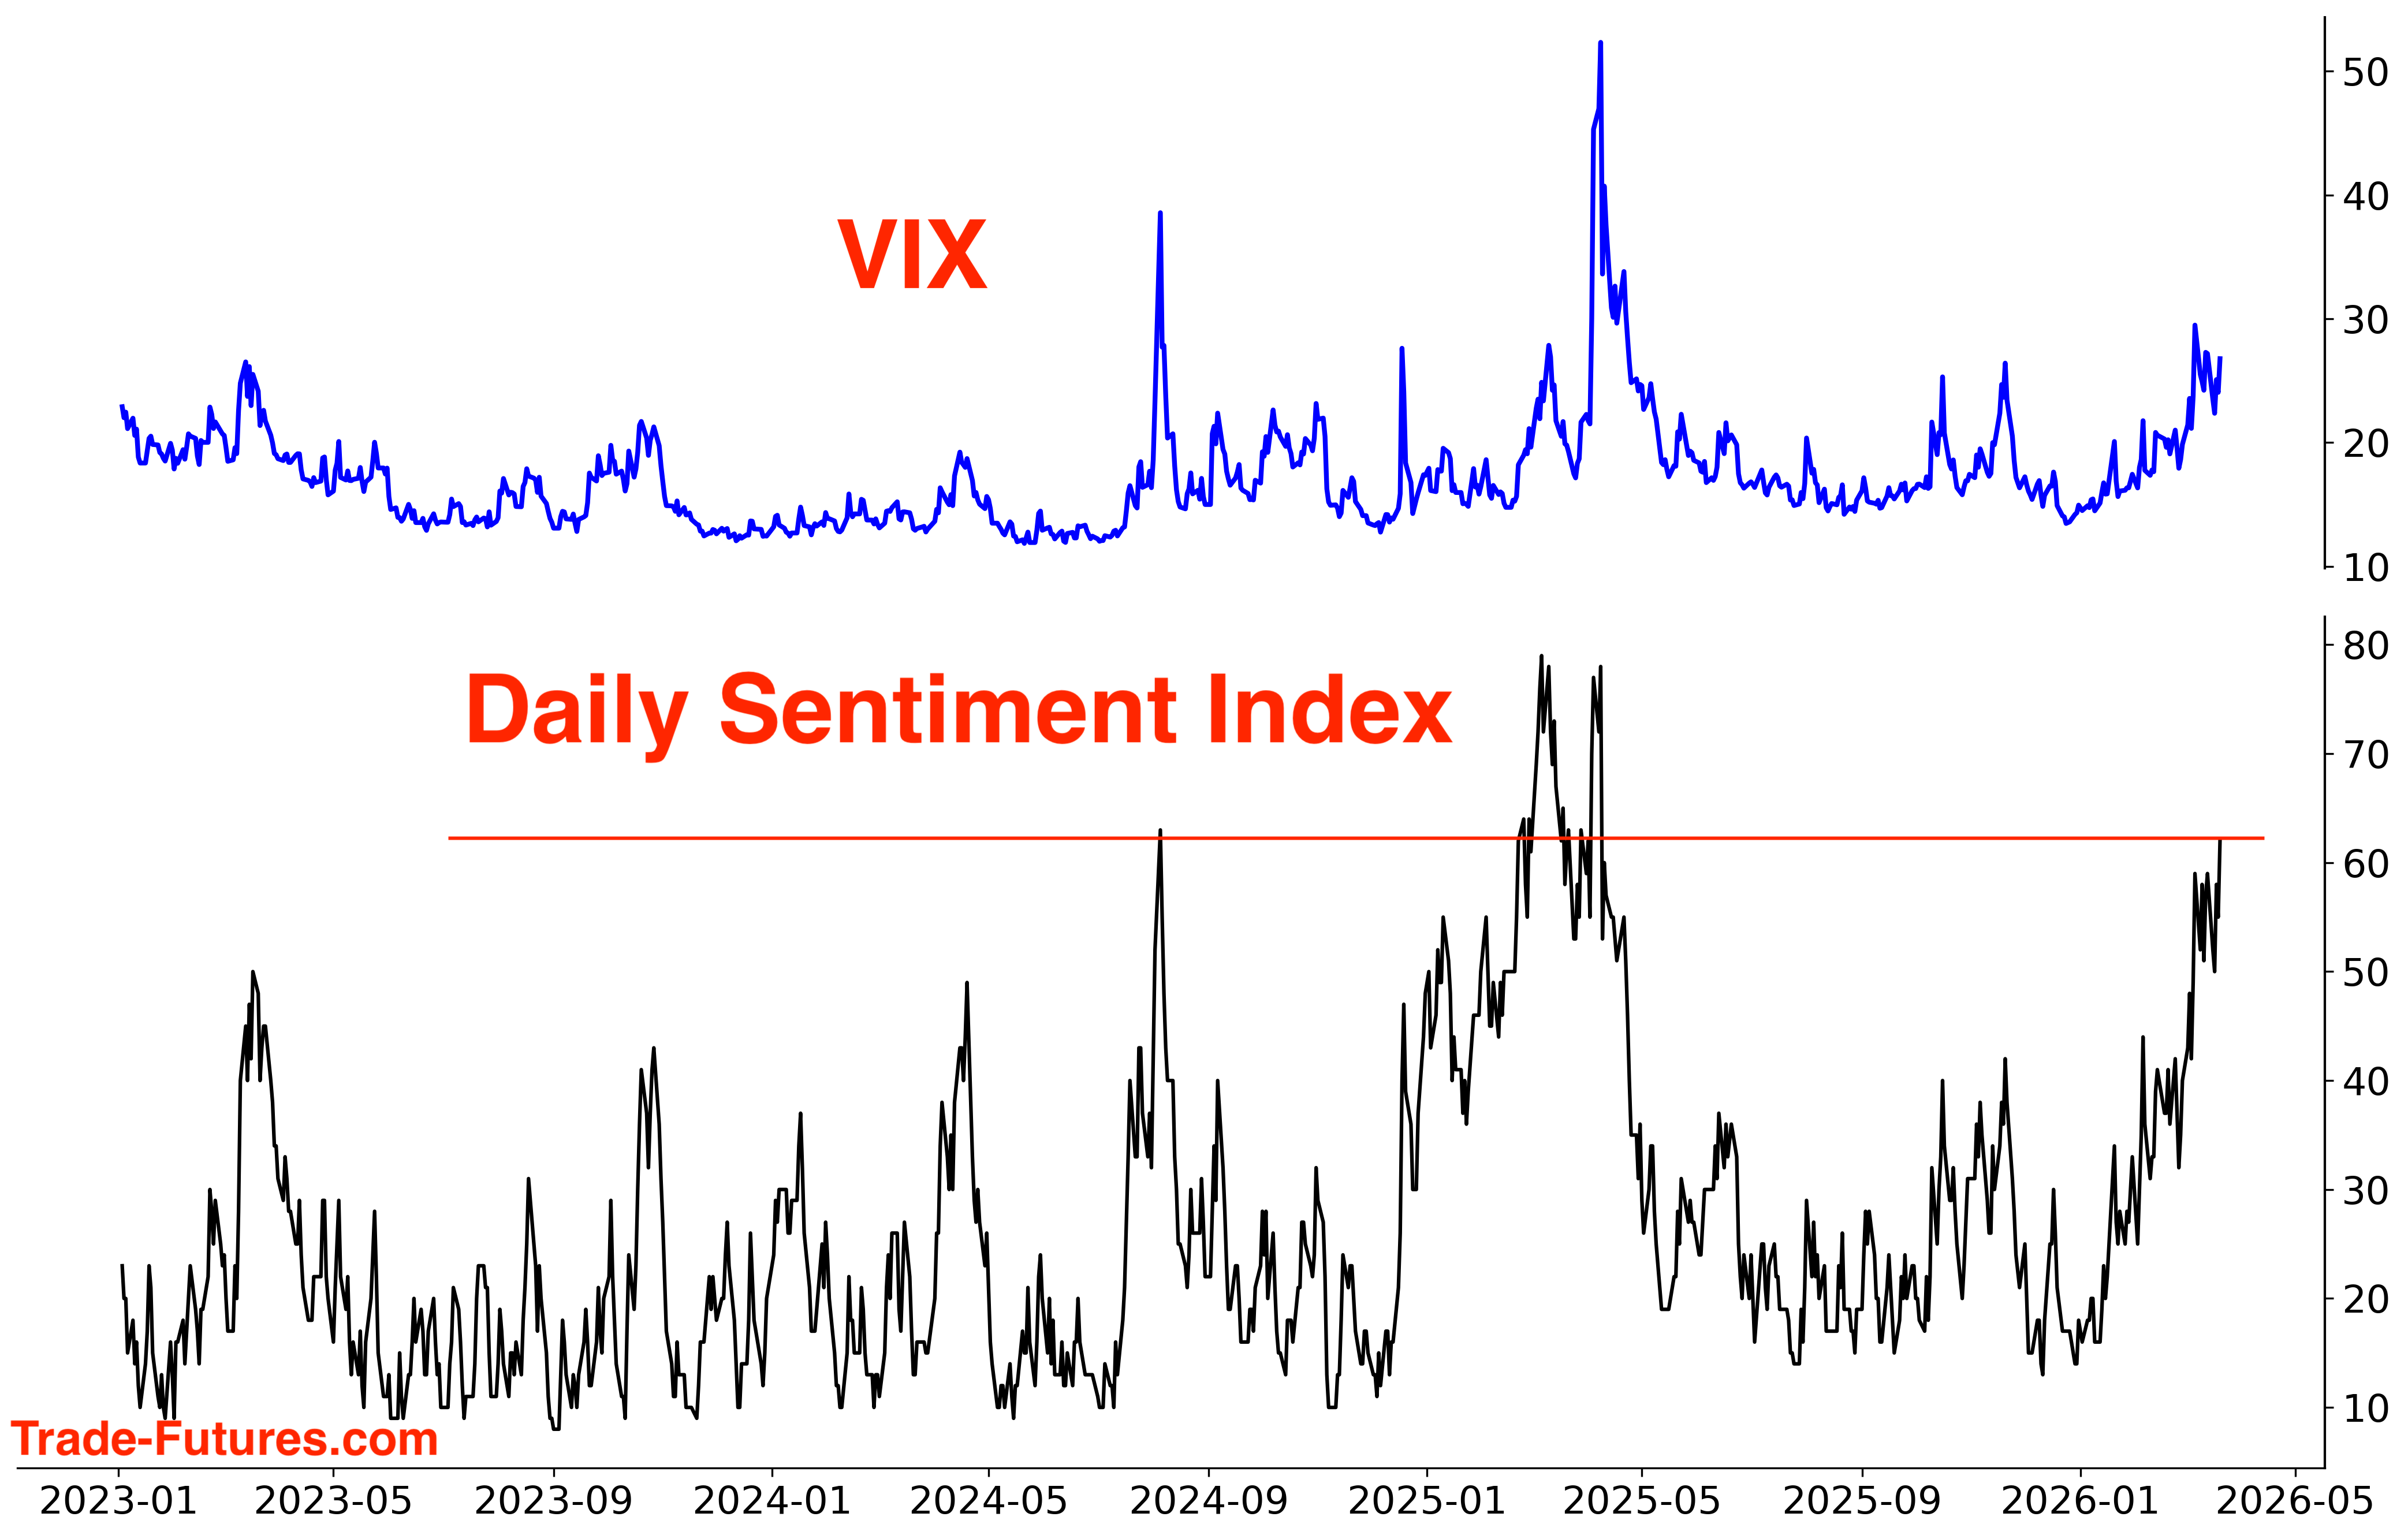
VIX Daily Sentiment Index is pushing higher:
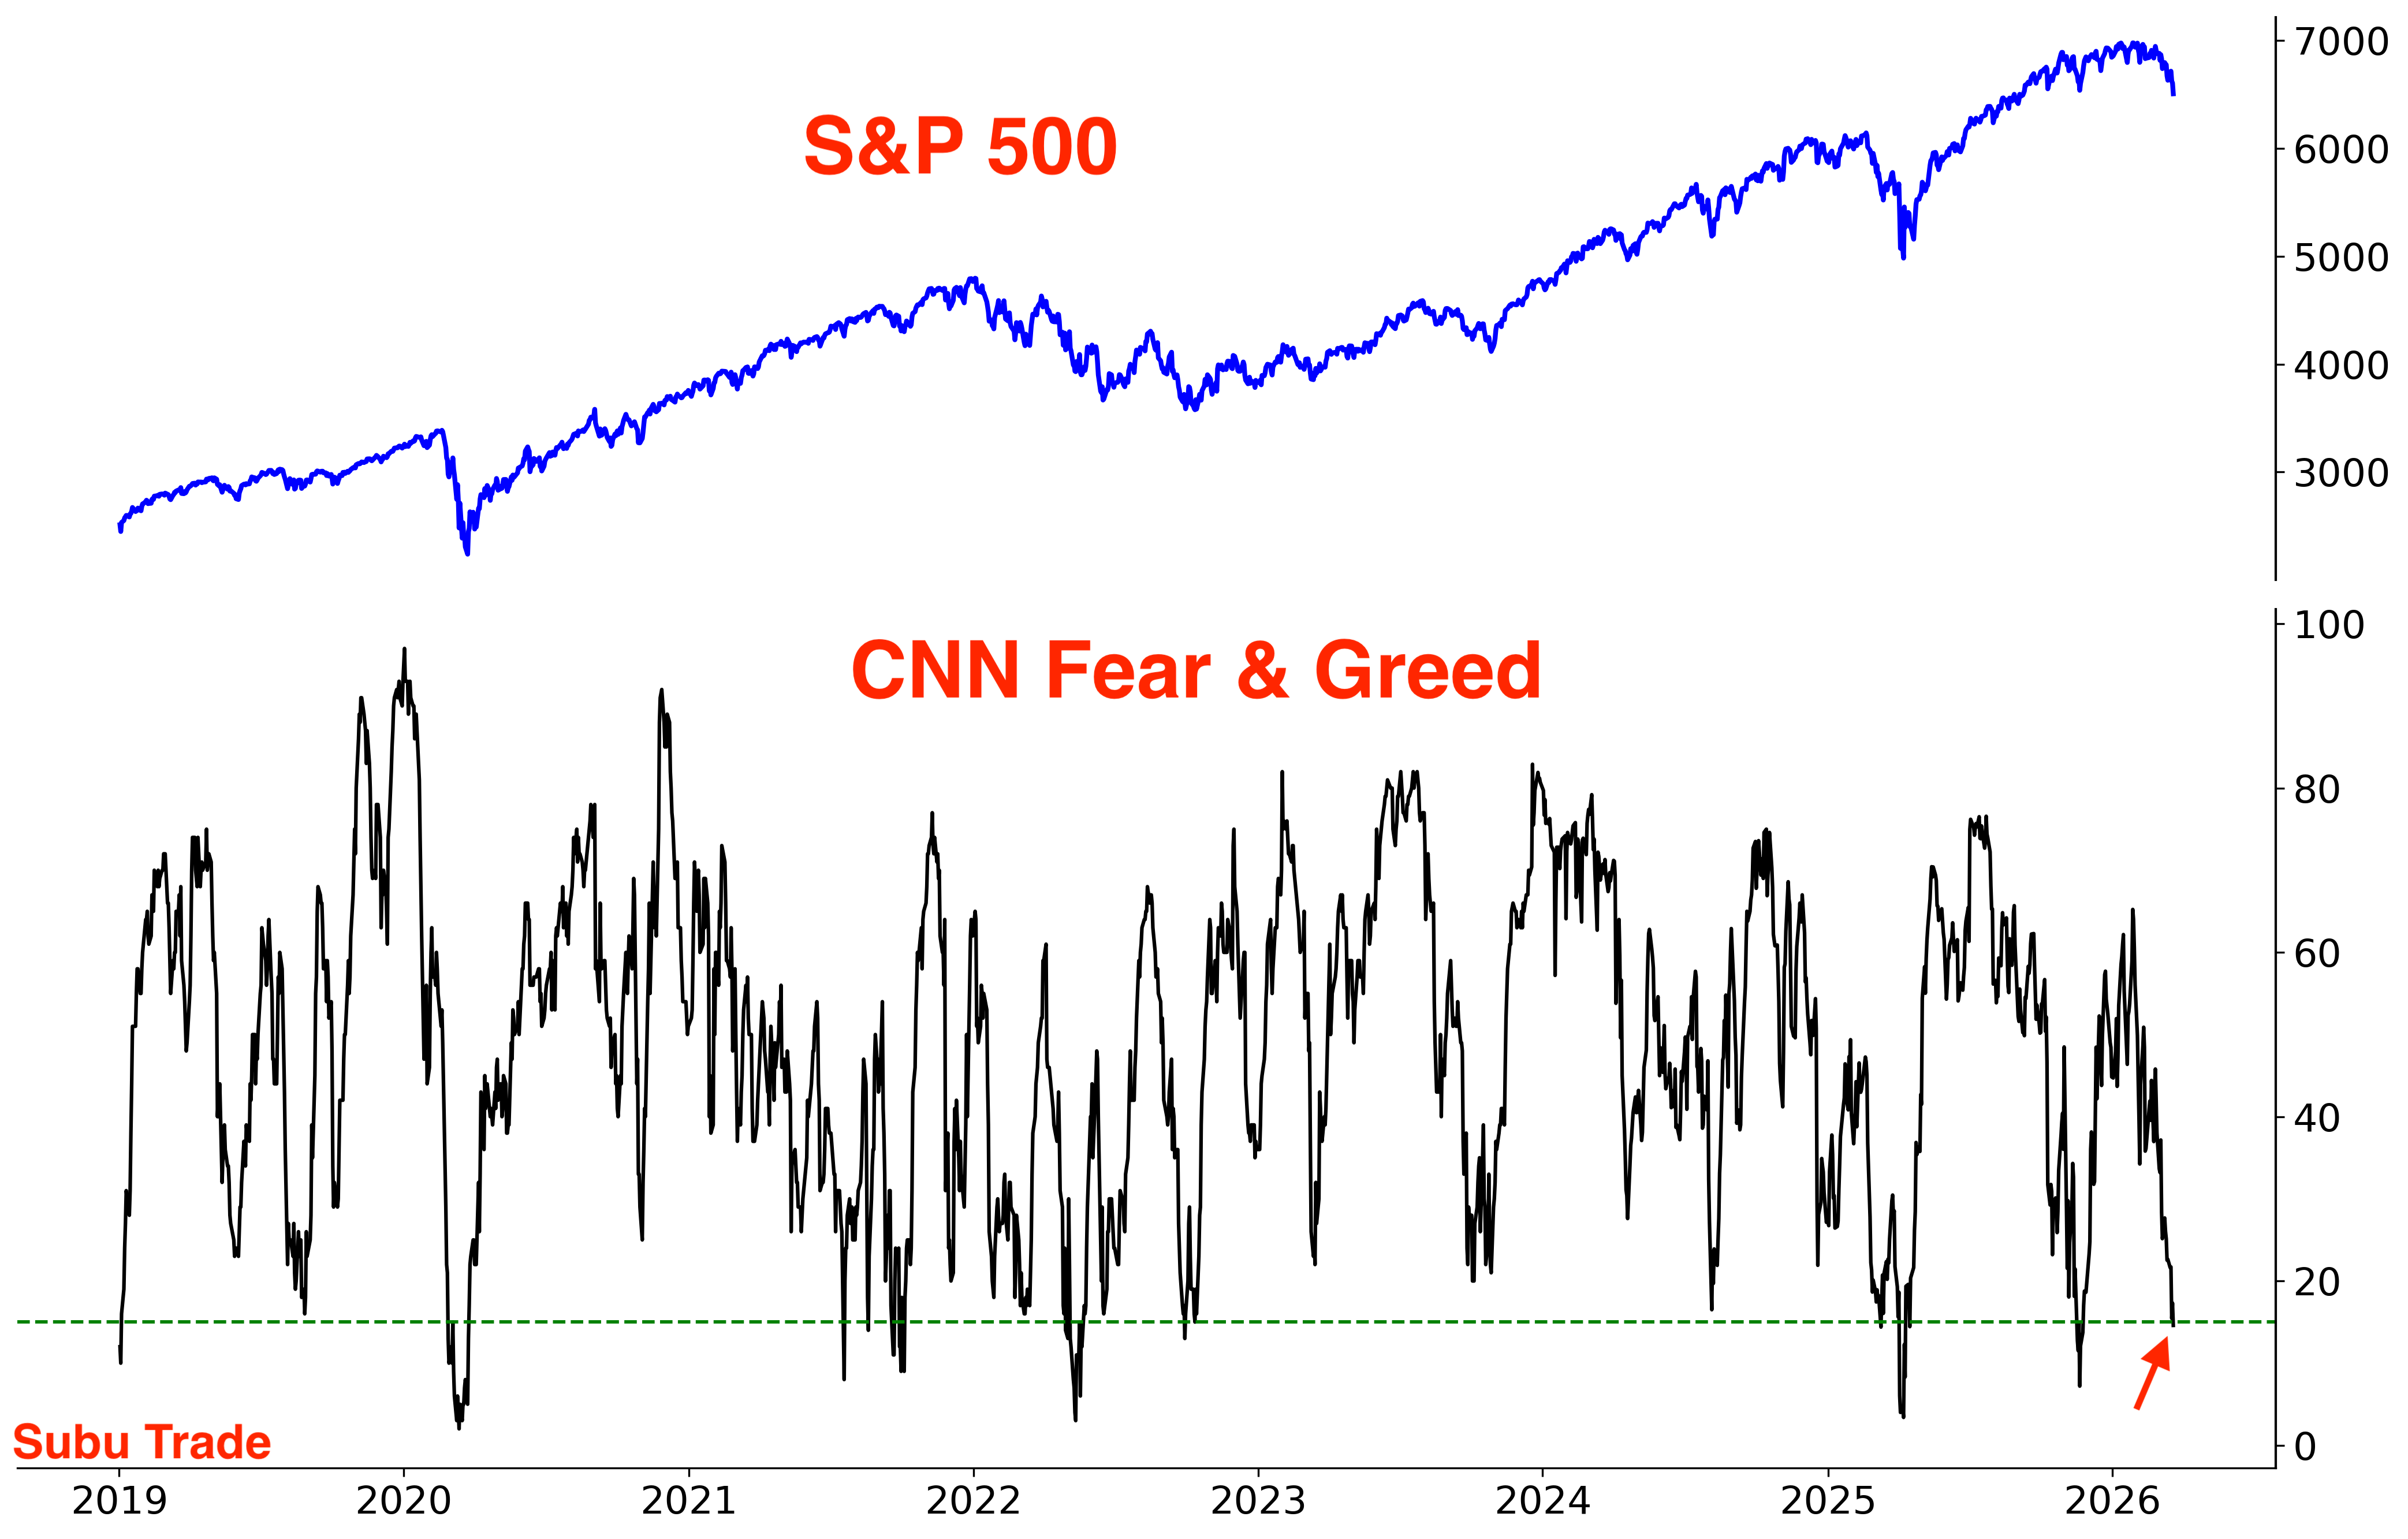
CNN Fear & Greed is in “fear” territory:
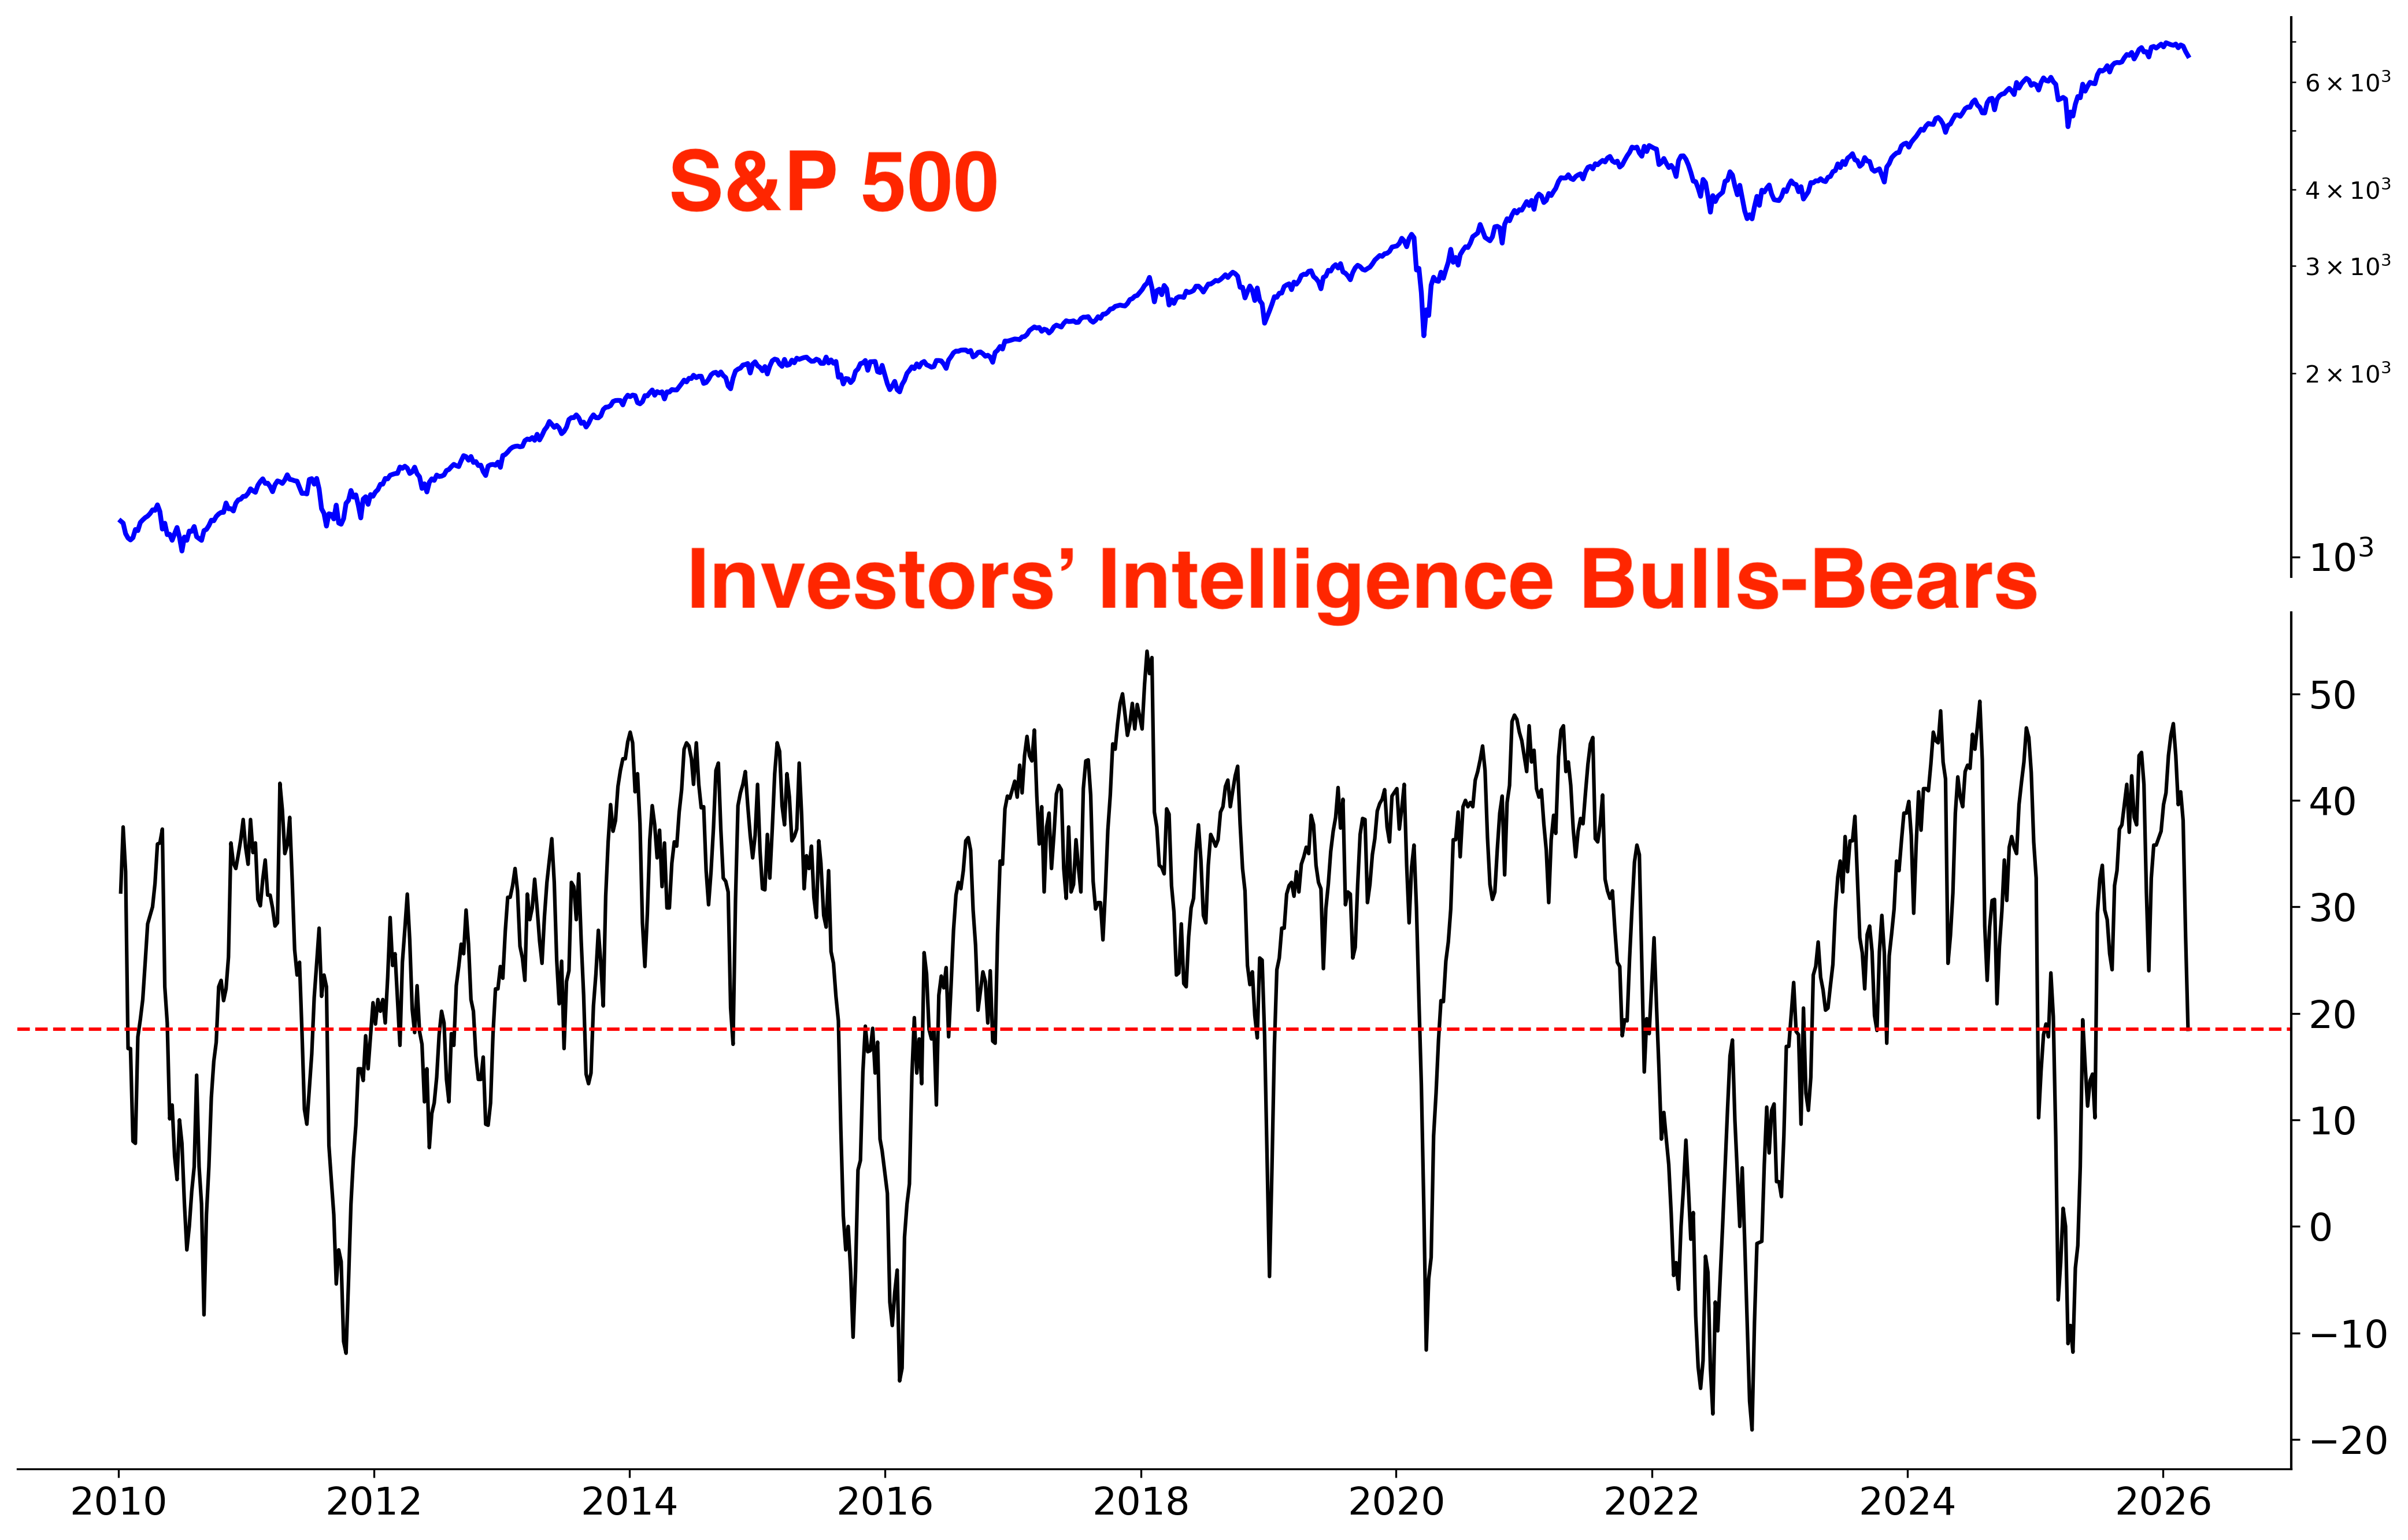
Investors’ Intelligence Bulls-Bears is falling. Expect this figure to be even lower next week:
Asset Managers are just starting to un-wind their long-SPX positions:
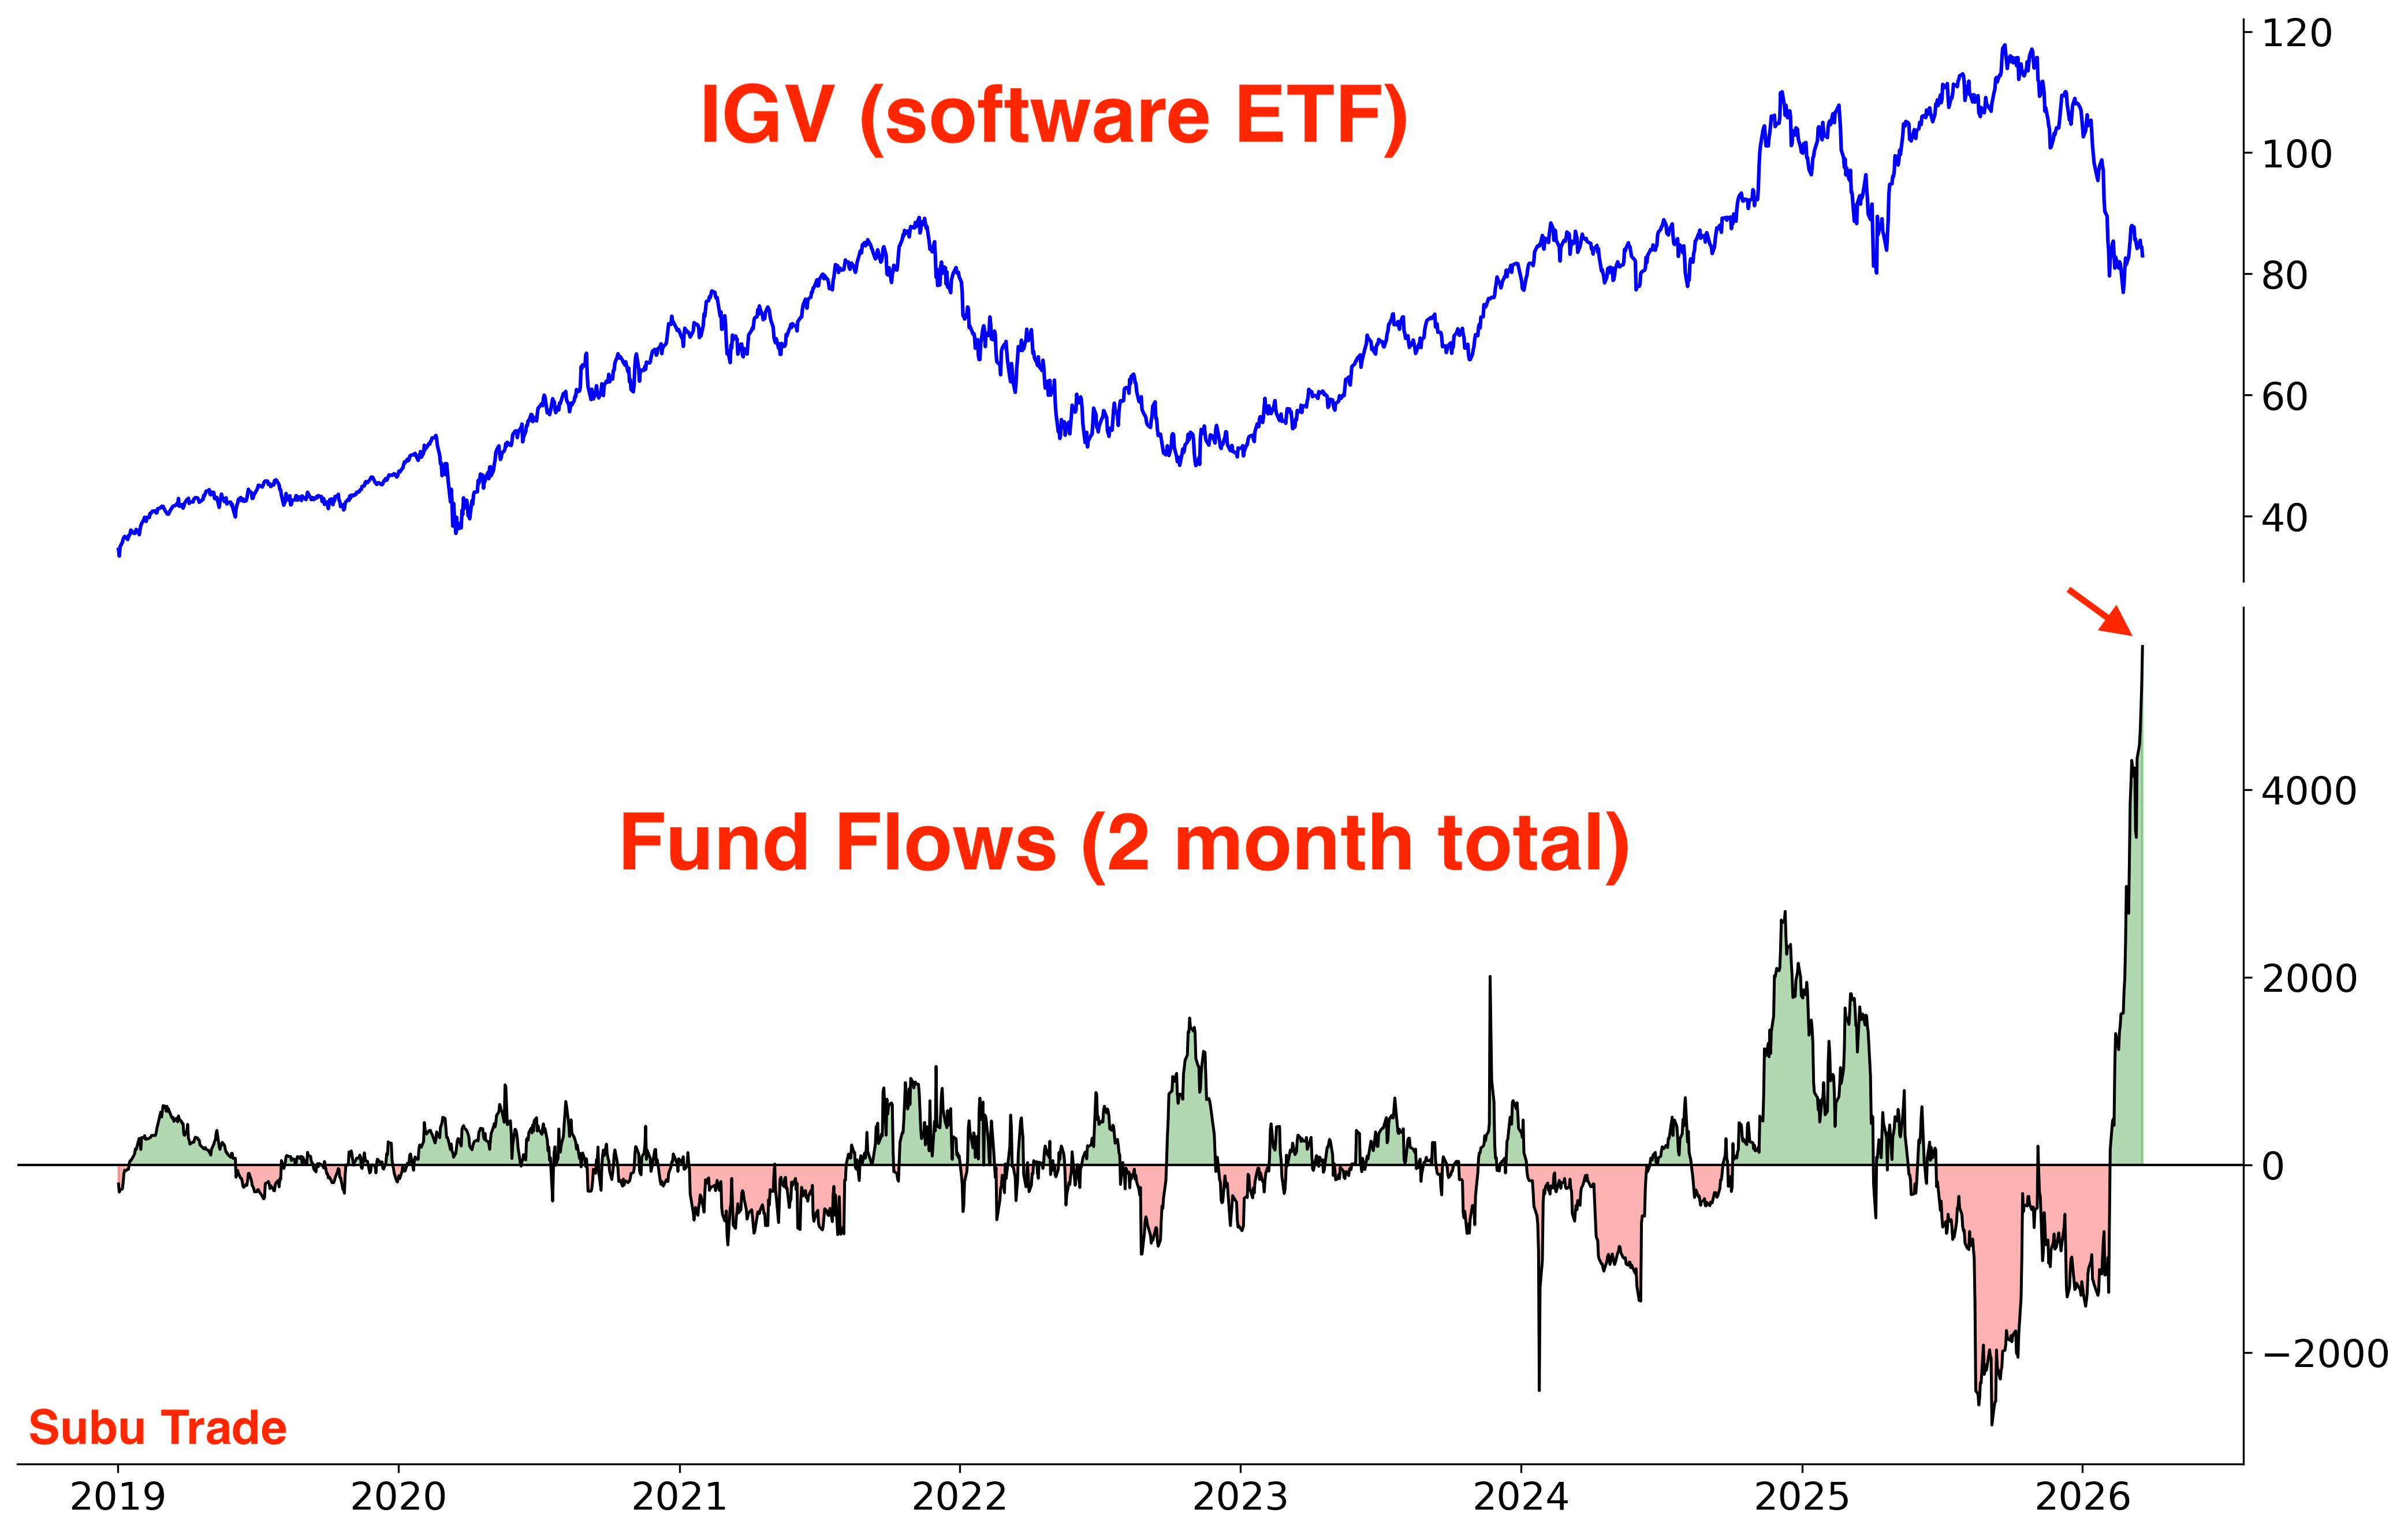
In February I highlighted the extreme selloff in software stocks. Since then, IGV has seen massive inflows. Everyone wants to call the bottom in software:
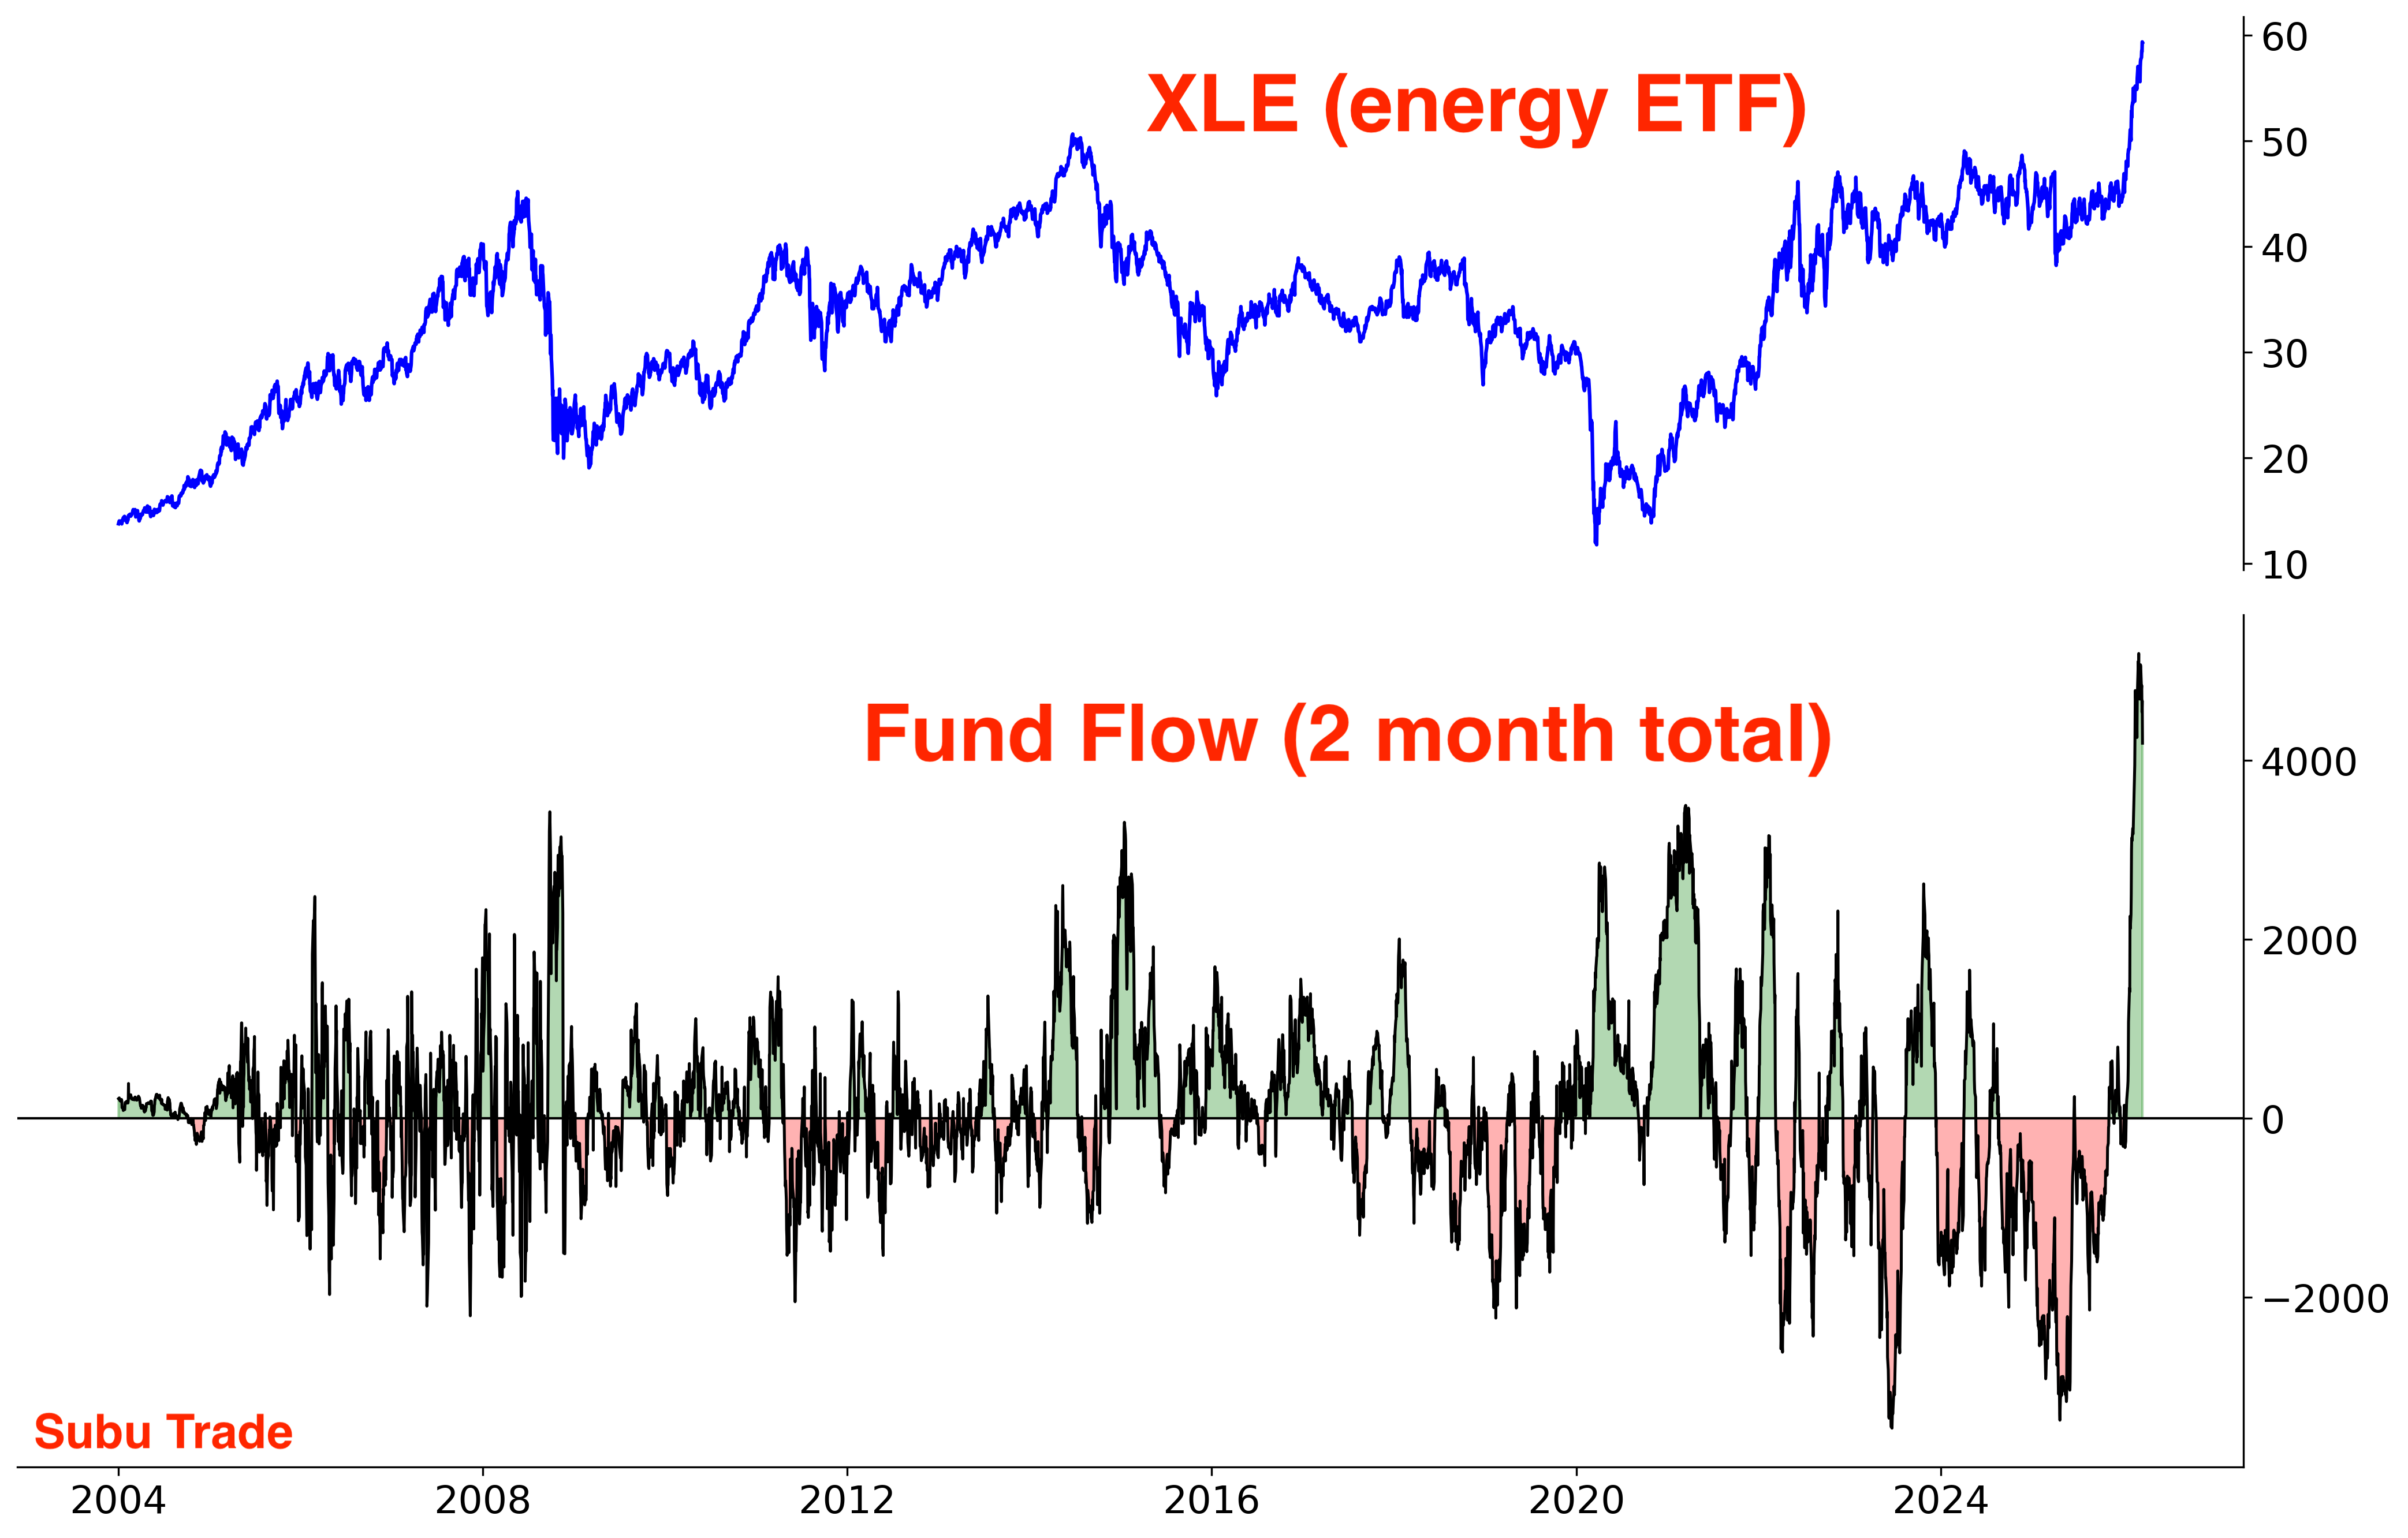
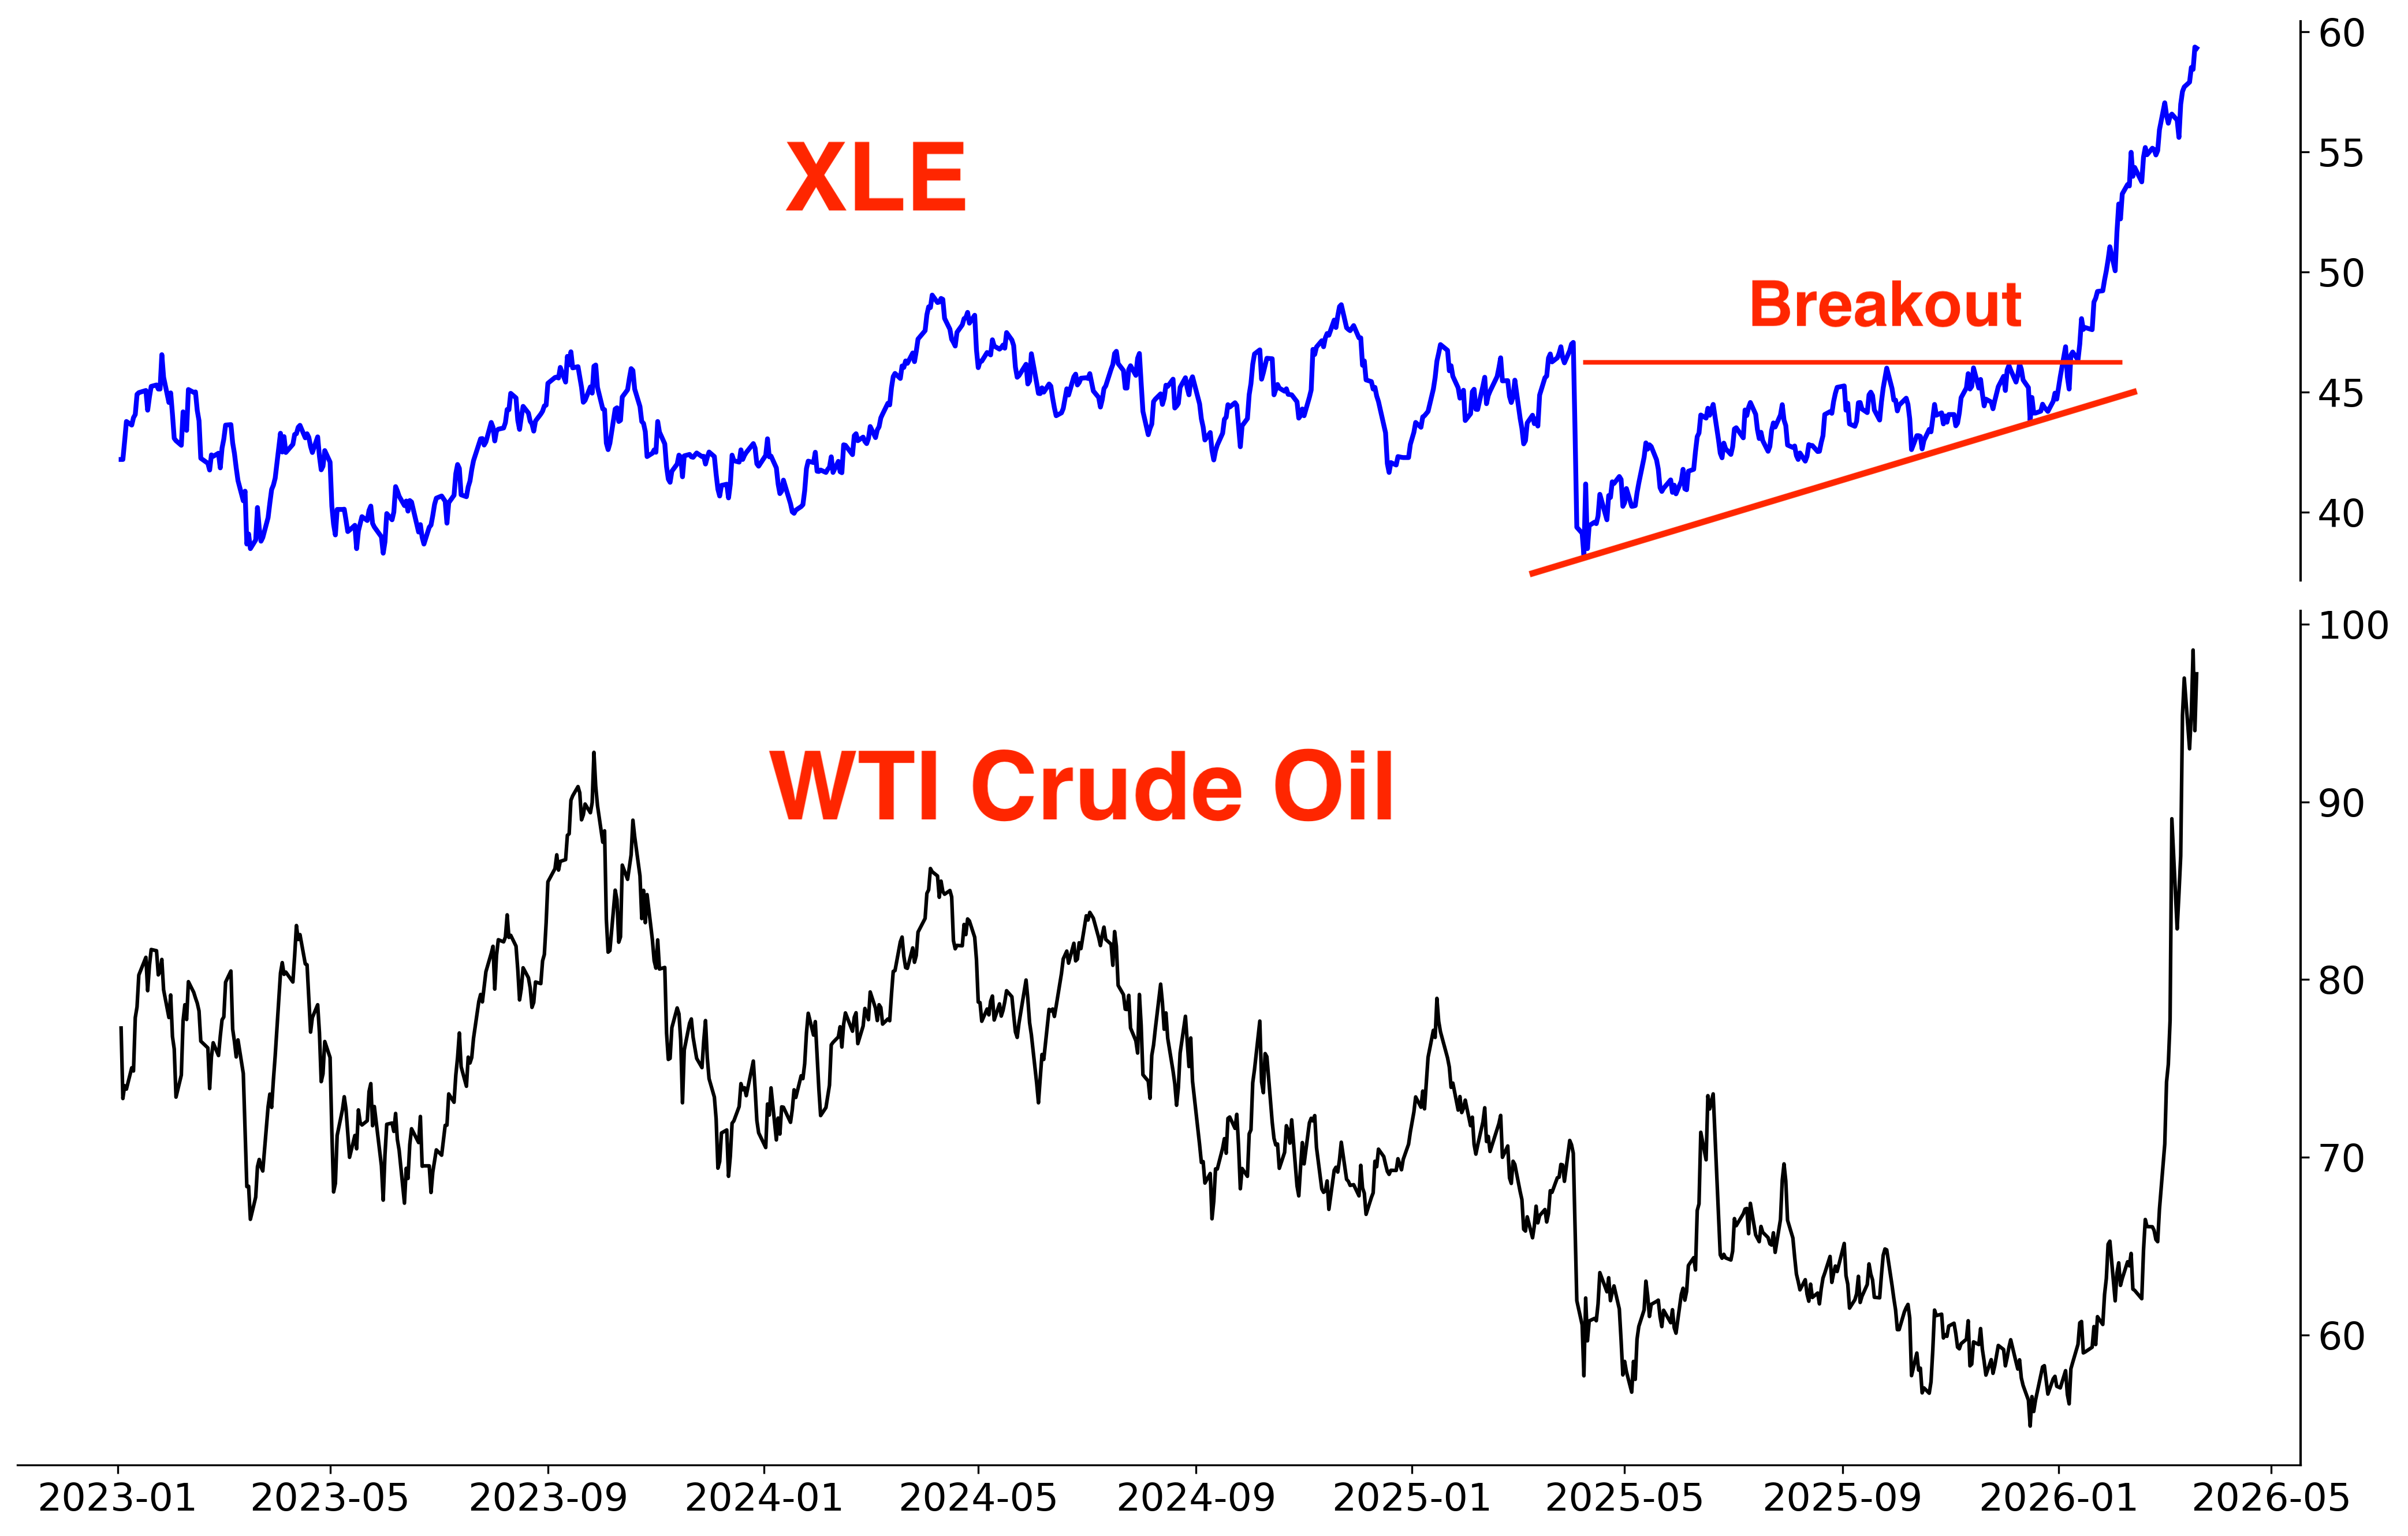
Another sector with extreme inflows is energy. Energy went from one of the most-hated sectors in 2025 to one of the most-loved sectors this year:
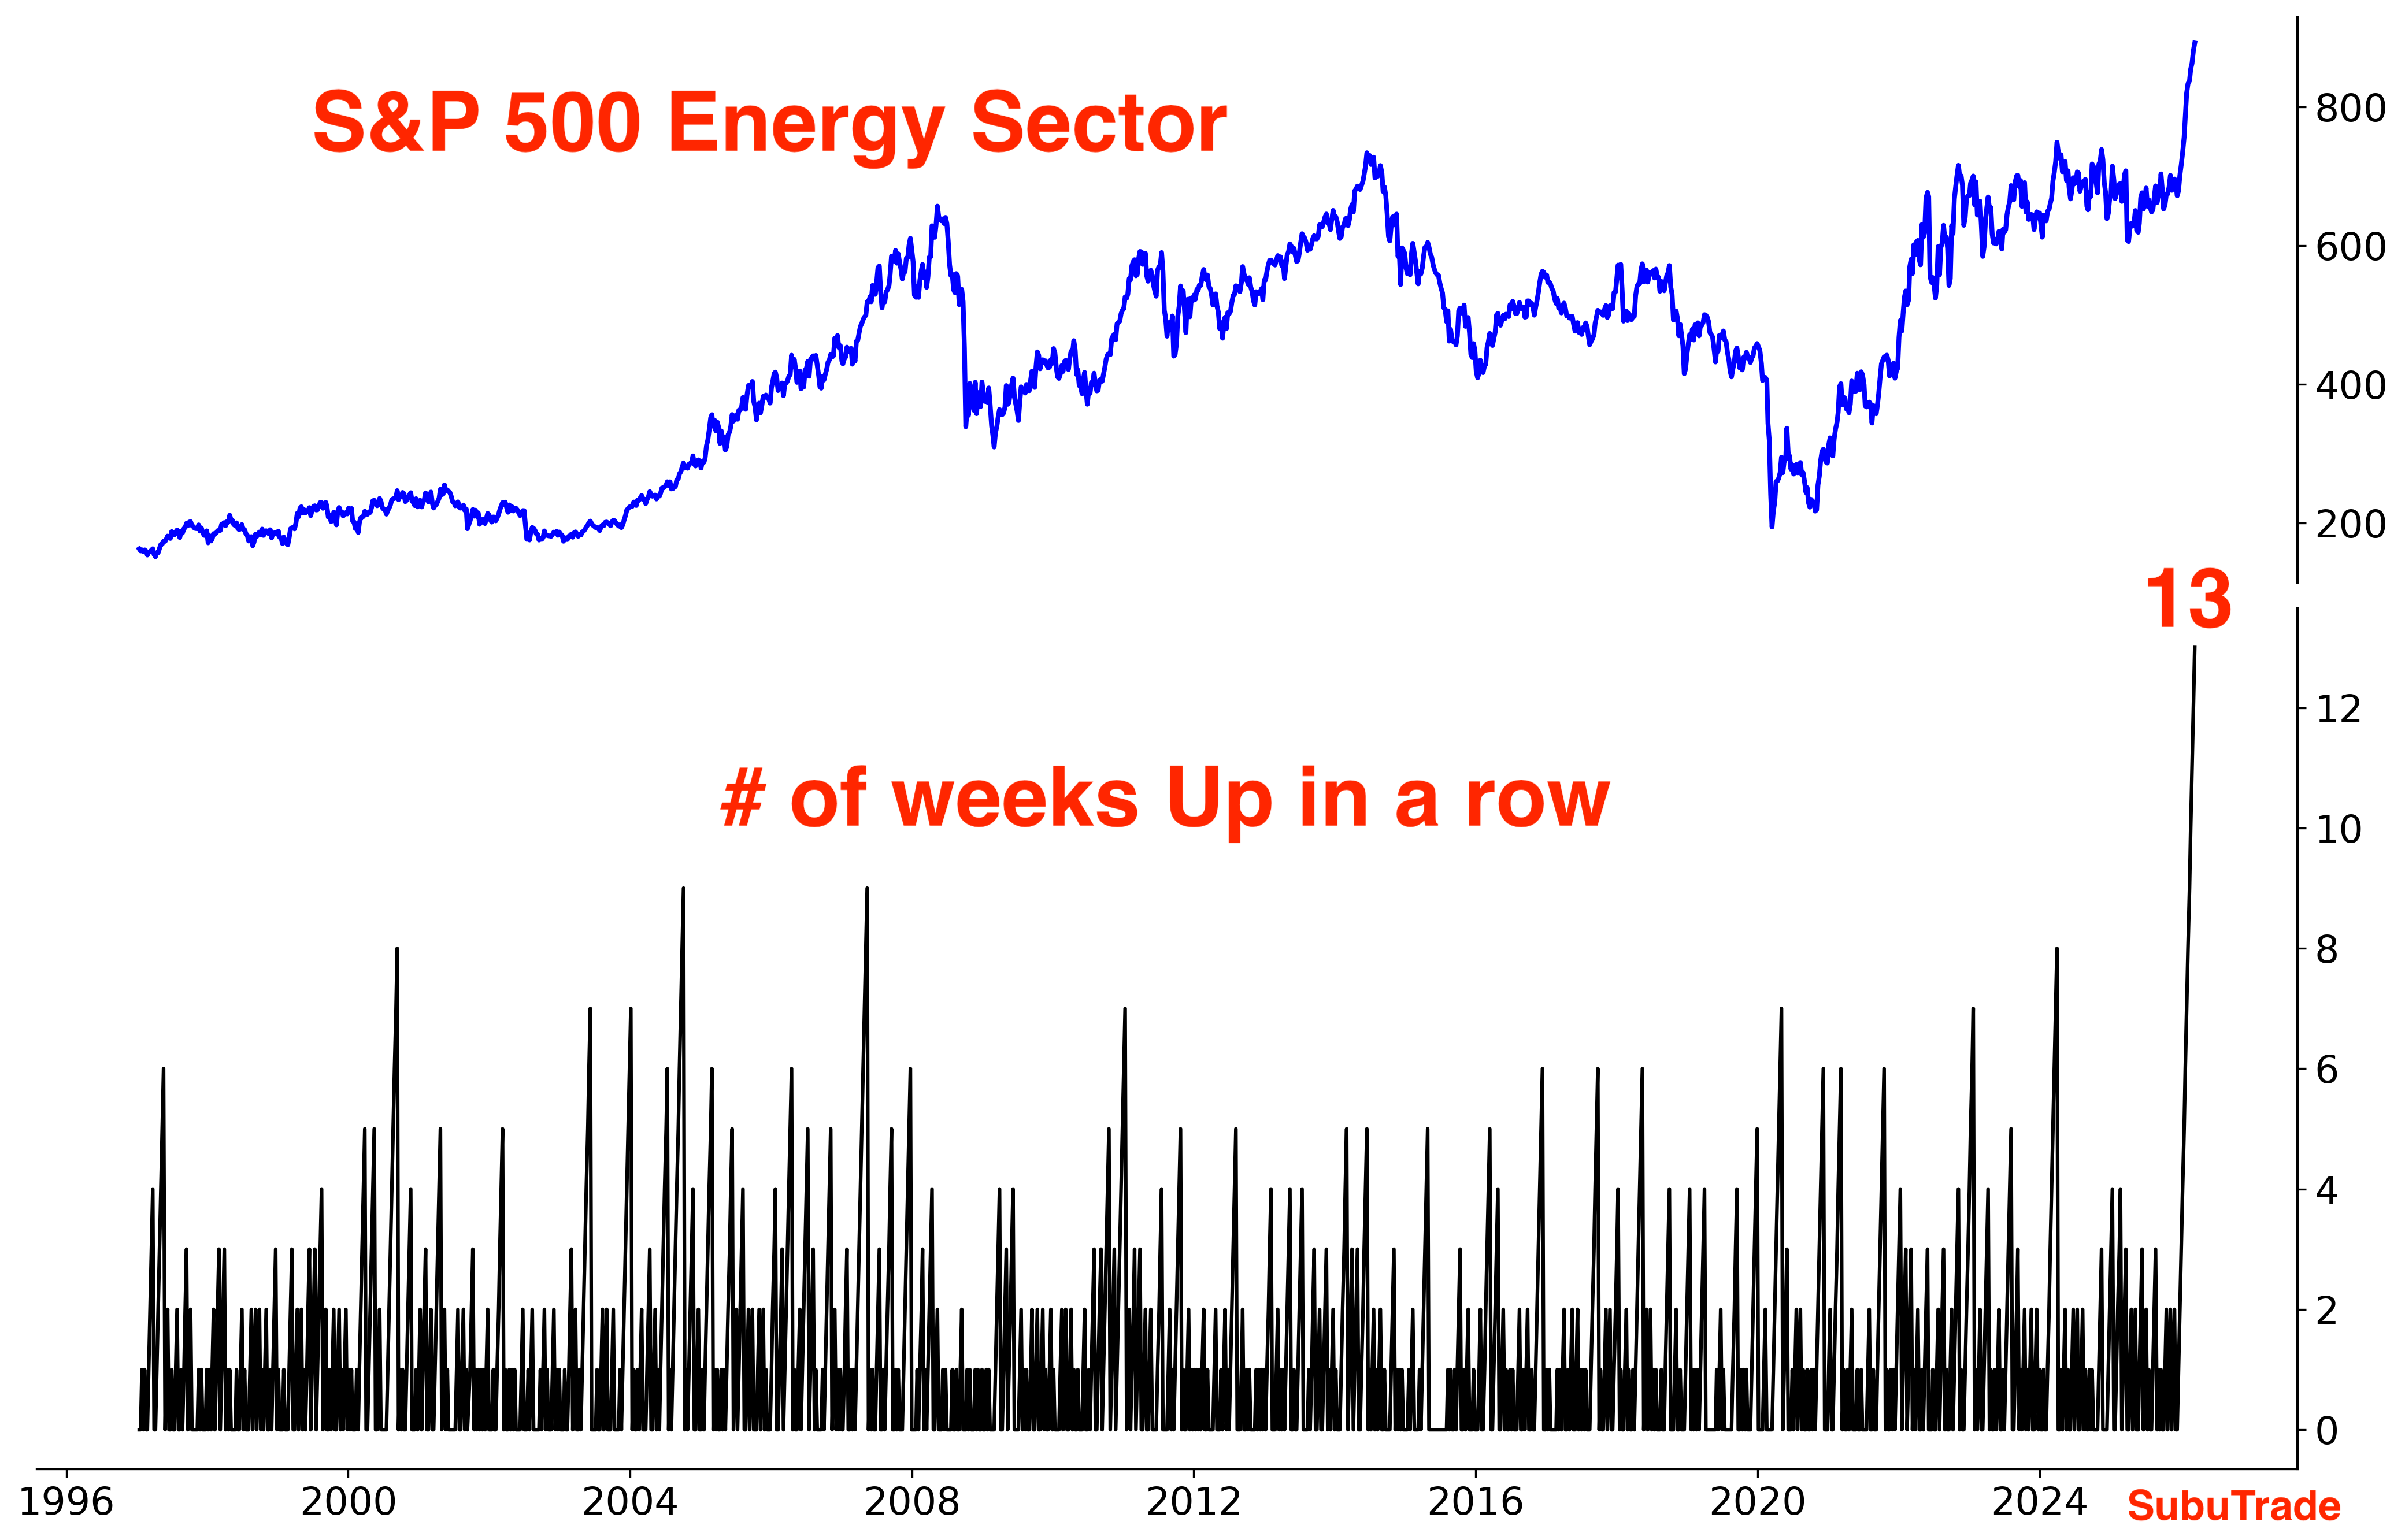
Energy stocks are up a record 13 weeks in a row. As I said last month, the Momentum factor is stronger than ever before. Herd behavior among traders is becoming stronger and stronger, which is why we keep seeing “RECORD” and “HISTORIC” signals. When markets go up, they go up non-stop. When markets go down, they go down non-stop. Price action is changing and increasingly favoring Momentum traders:
So how did we get into this mess? The Iran conflict can be blamed. But it’s important to remember that even before the Iran conflict, markets and positioning were so one-sided that ANY catalyst could trigger a meaningful selloff. Markets rallied without any meaningful pullback off the Liberation Day lows, and we’re finally getting that overdue pullback.
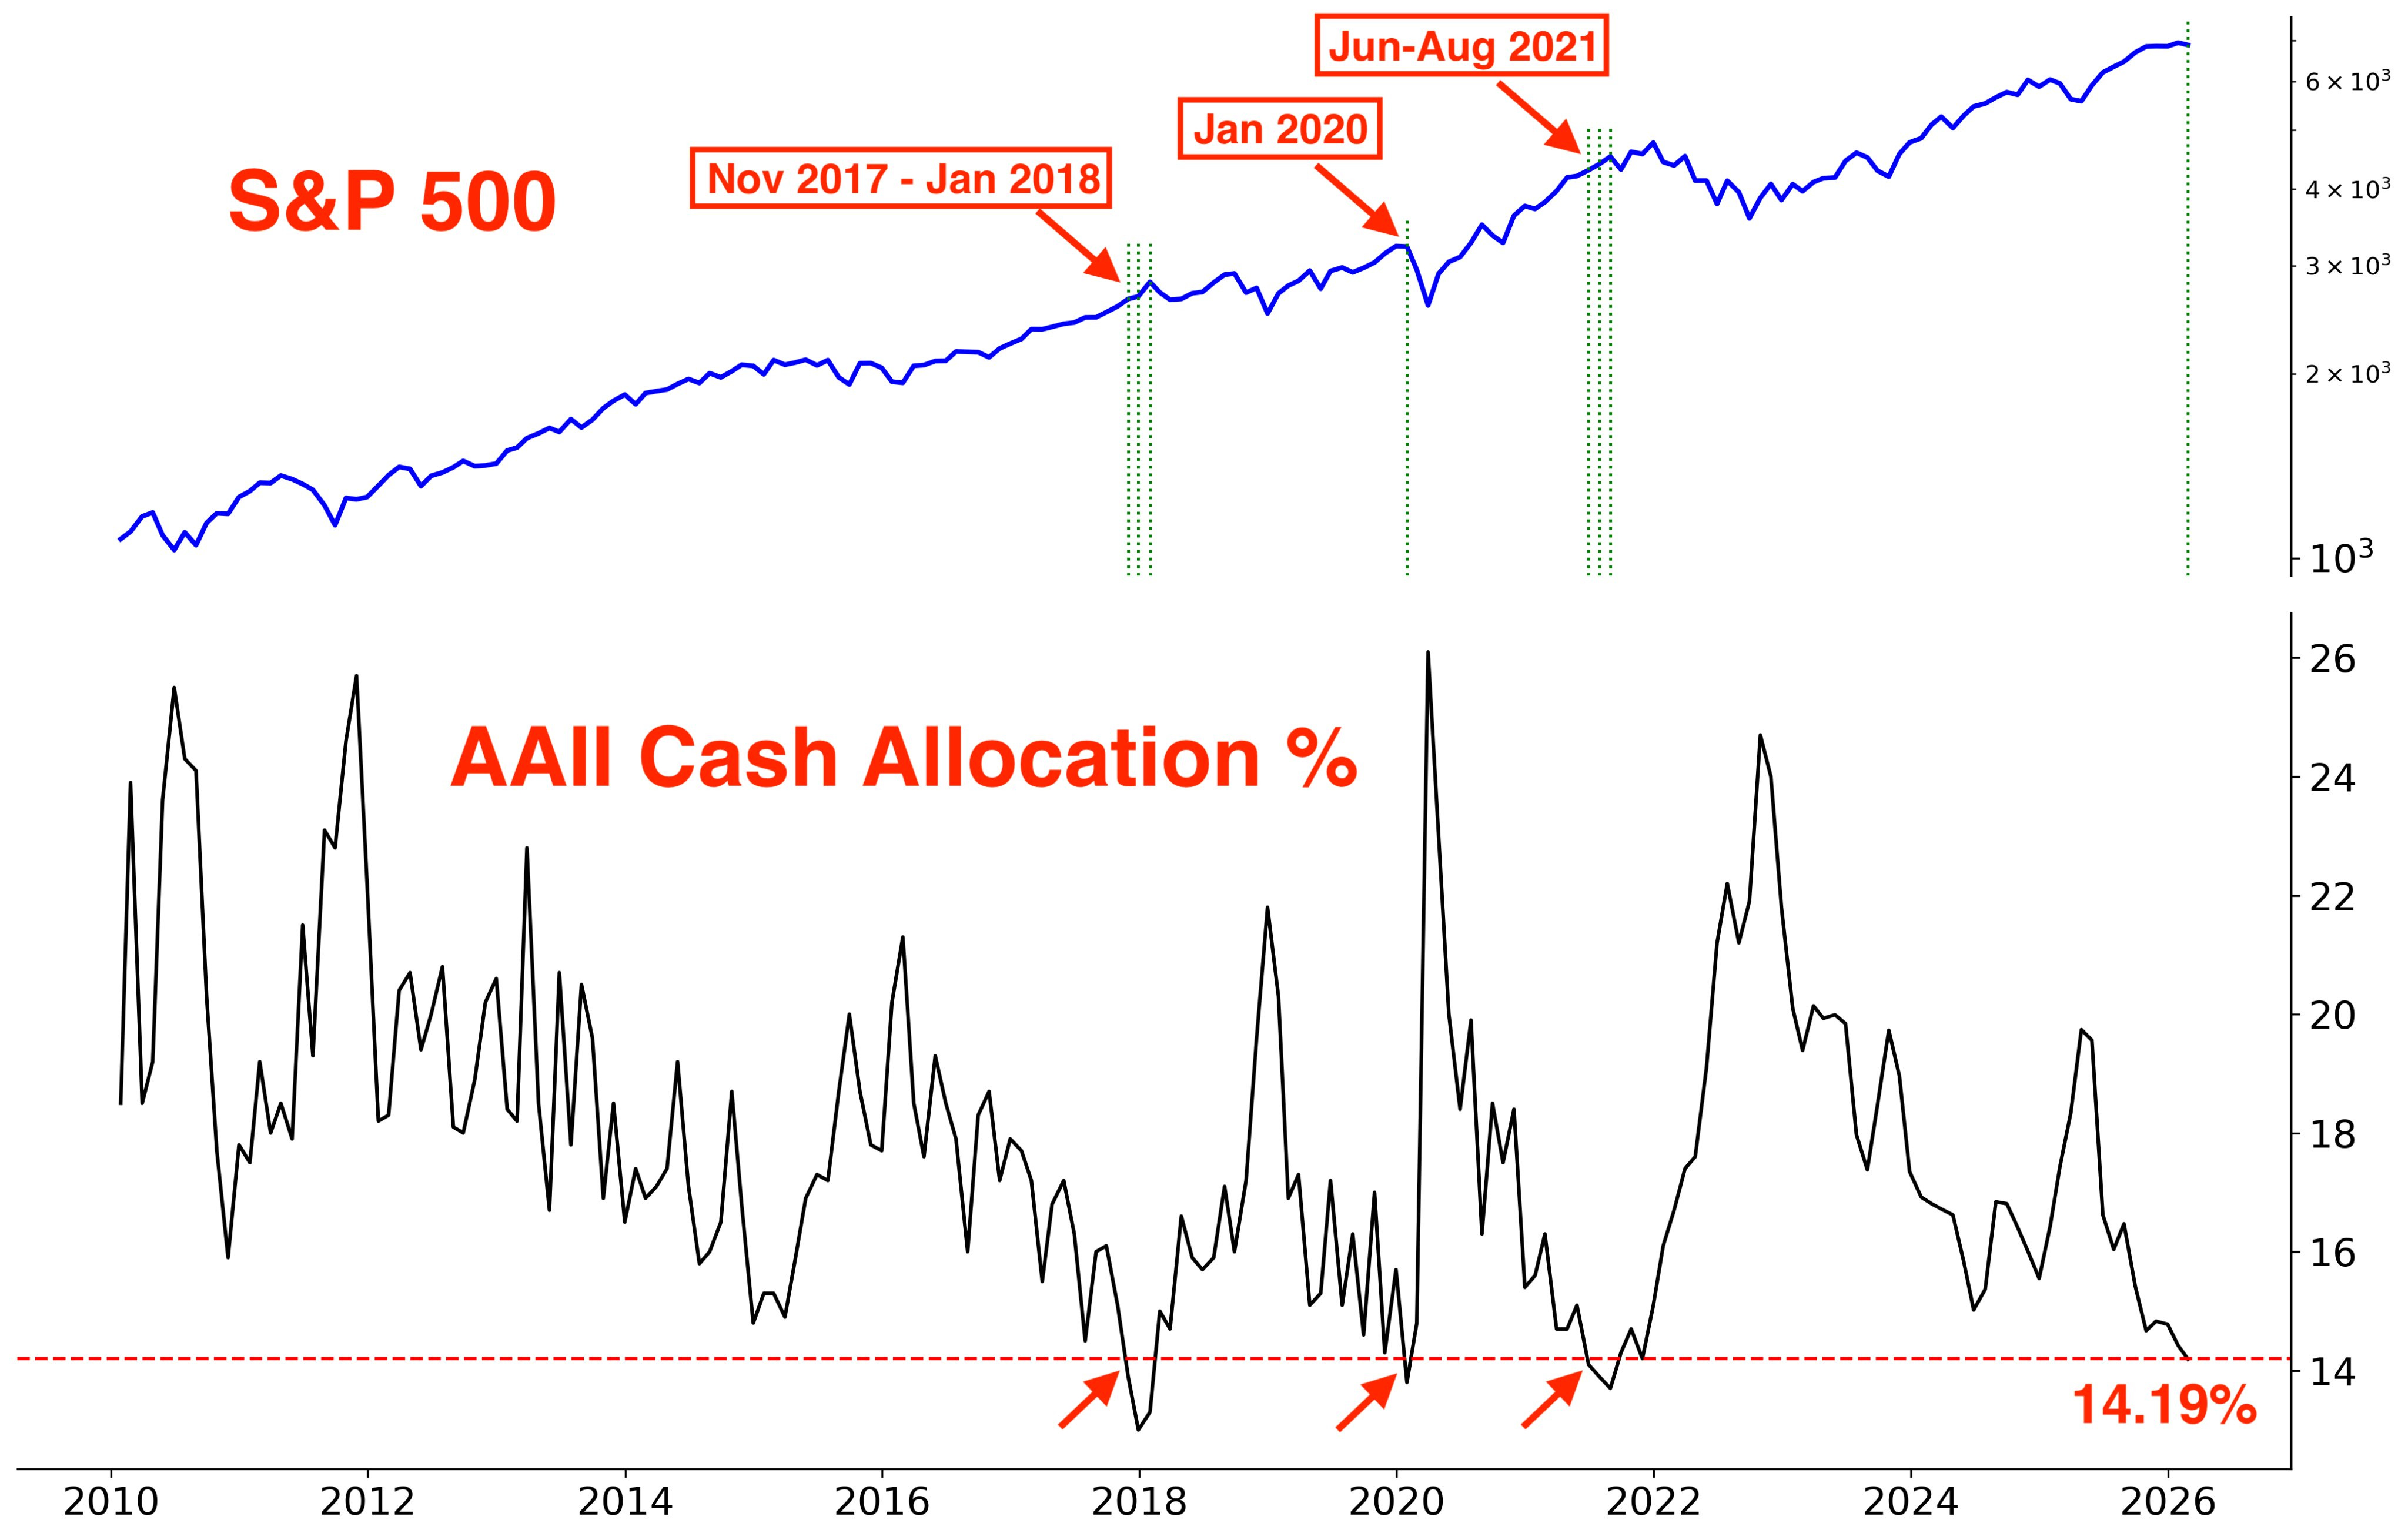
The extreme positioning is best seen via AAII Cash Allocations. Extremely low Cash Allocations didn’t always mark the exact top for stocks, but it did setup the conditions for corrections and bear markets. The last 3 times we saw such low cash was before:
2018 Volmaggedon
2020 COVID crash
2022 bear market
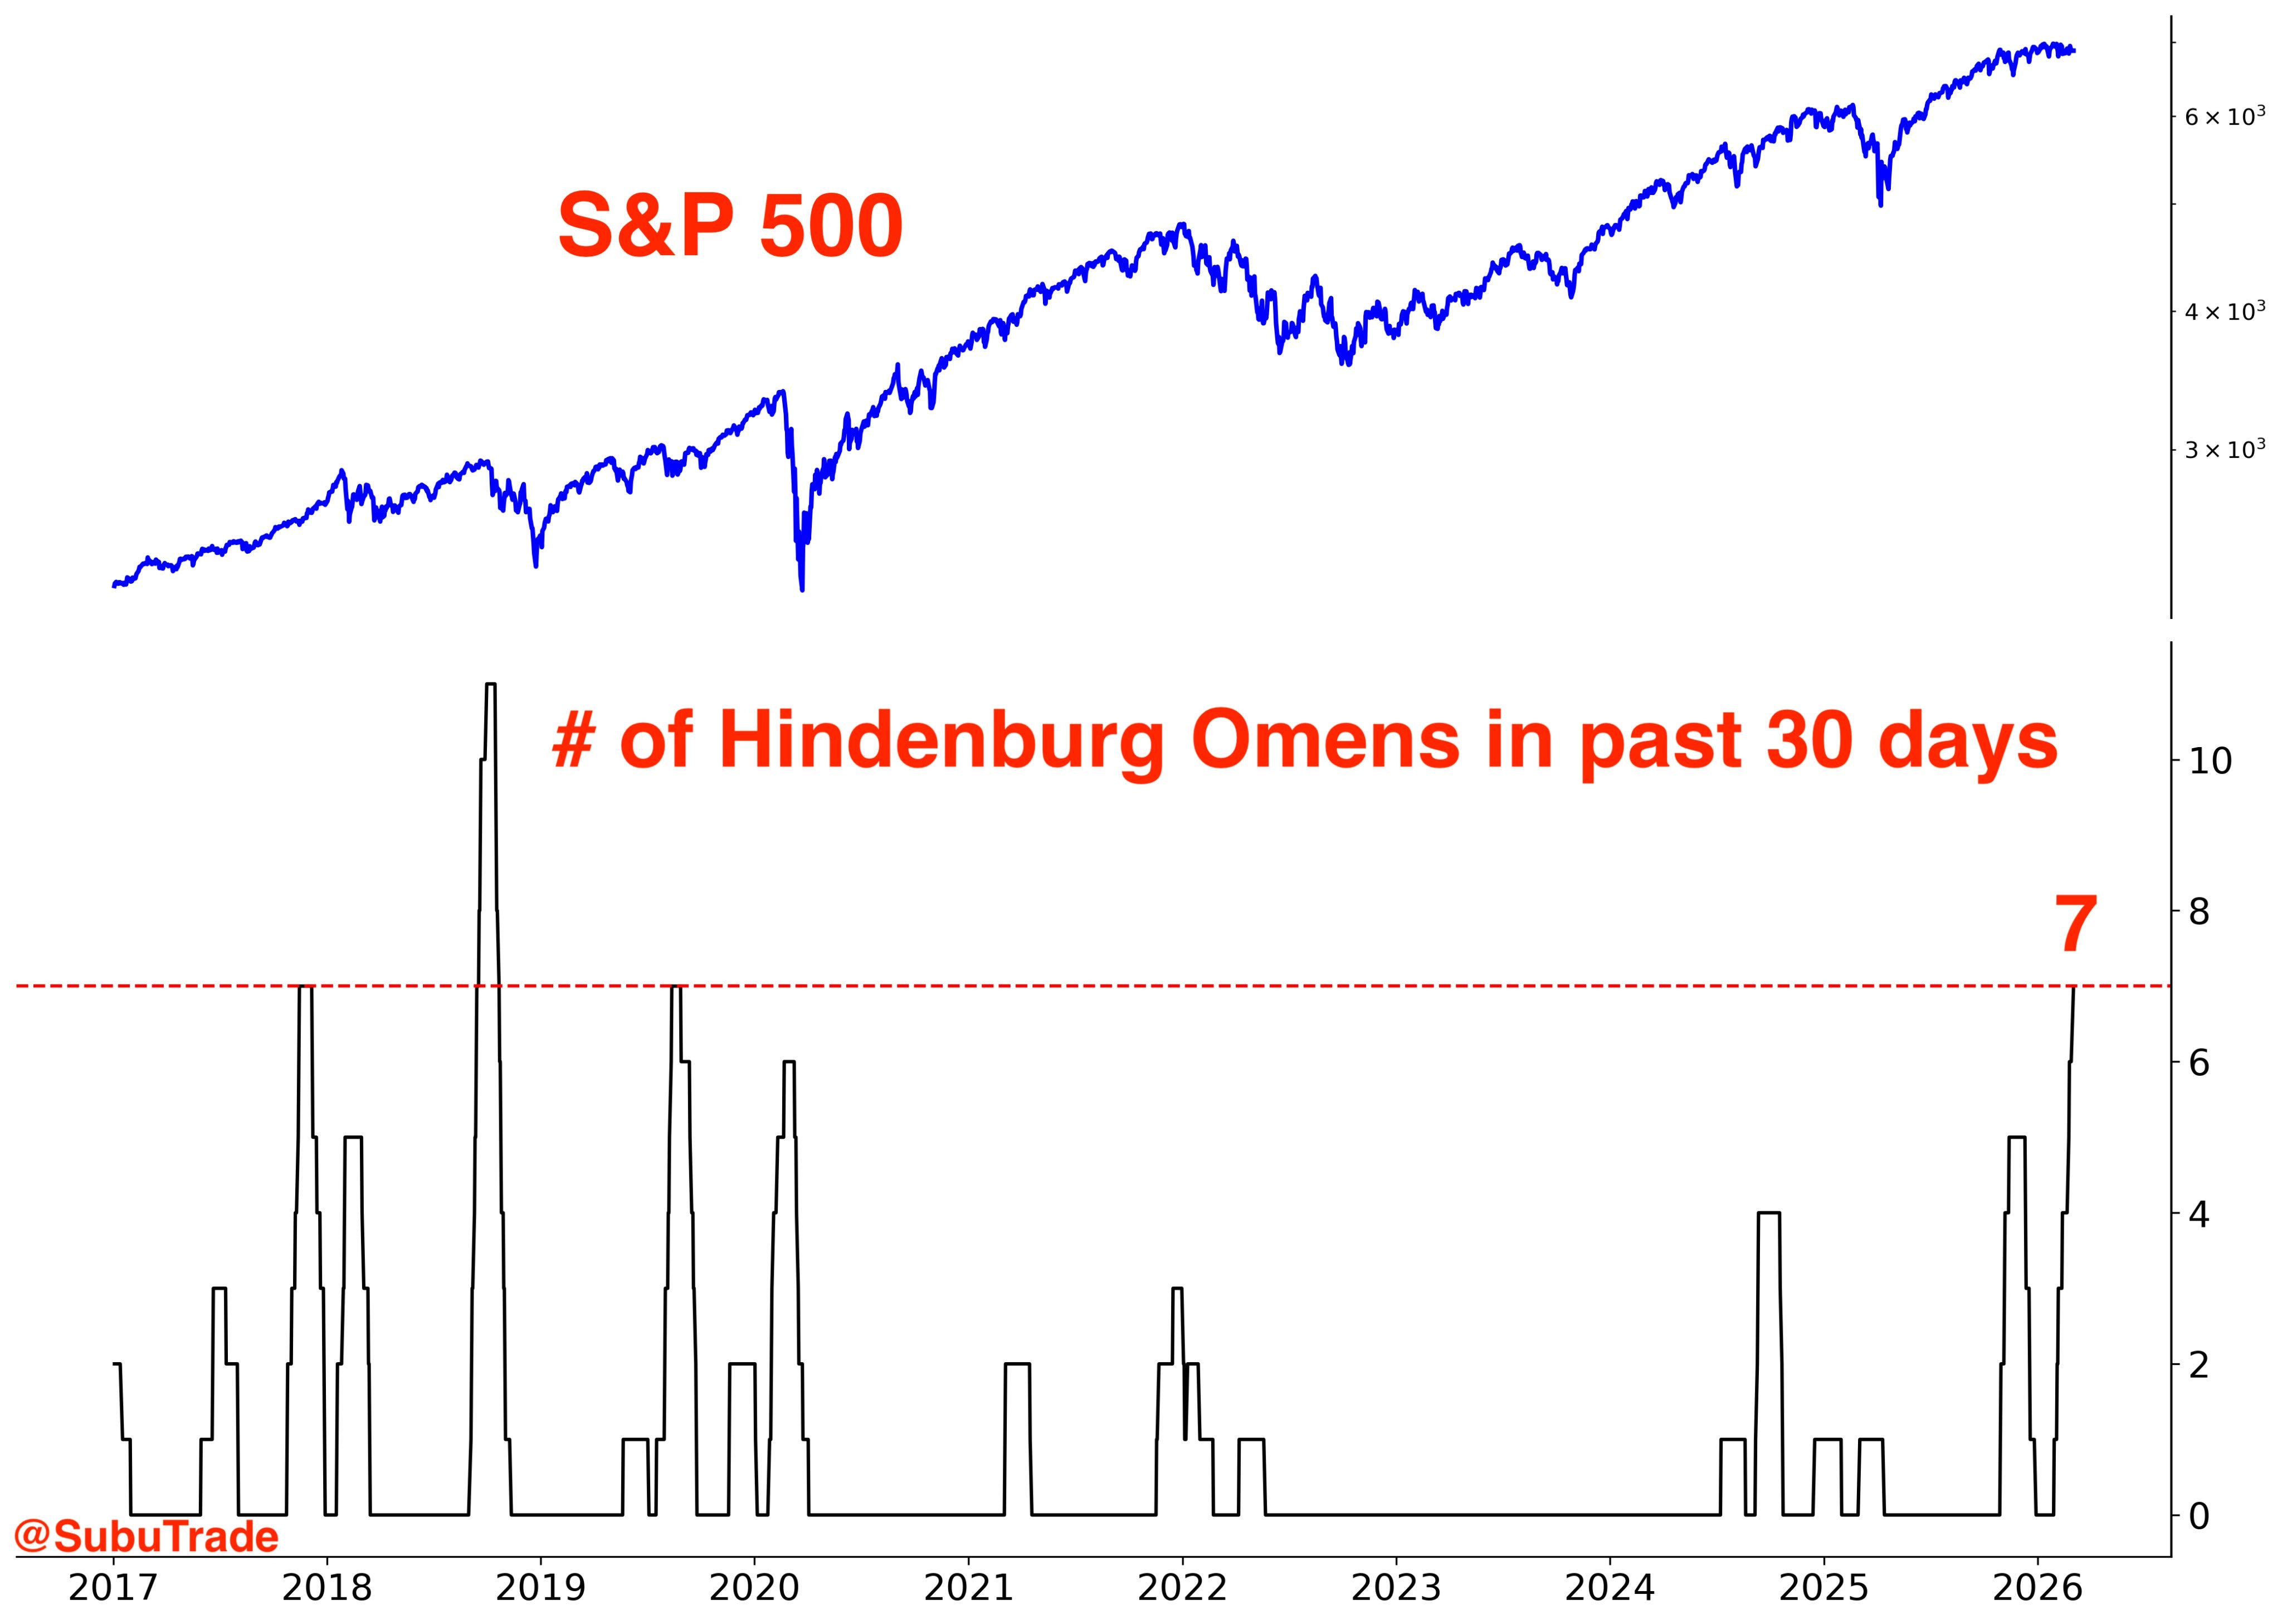
Another factor worth noting is the persistent Hindenburg Omen signals that we kept getting since last October, after which the S&P started trending sideways.
As I shared on March 4:
Bitcoin
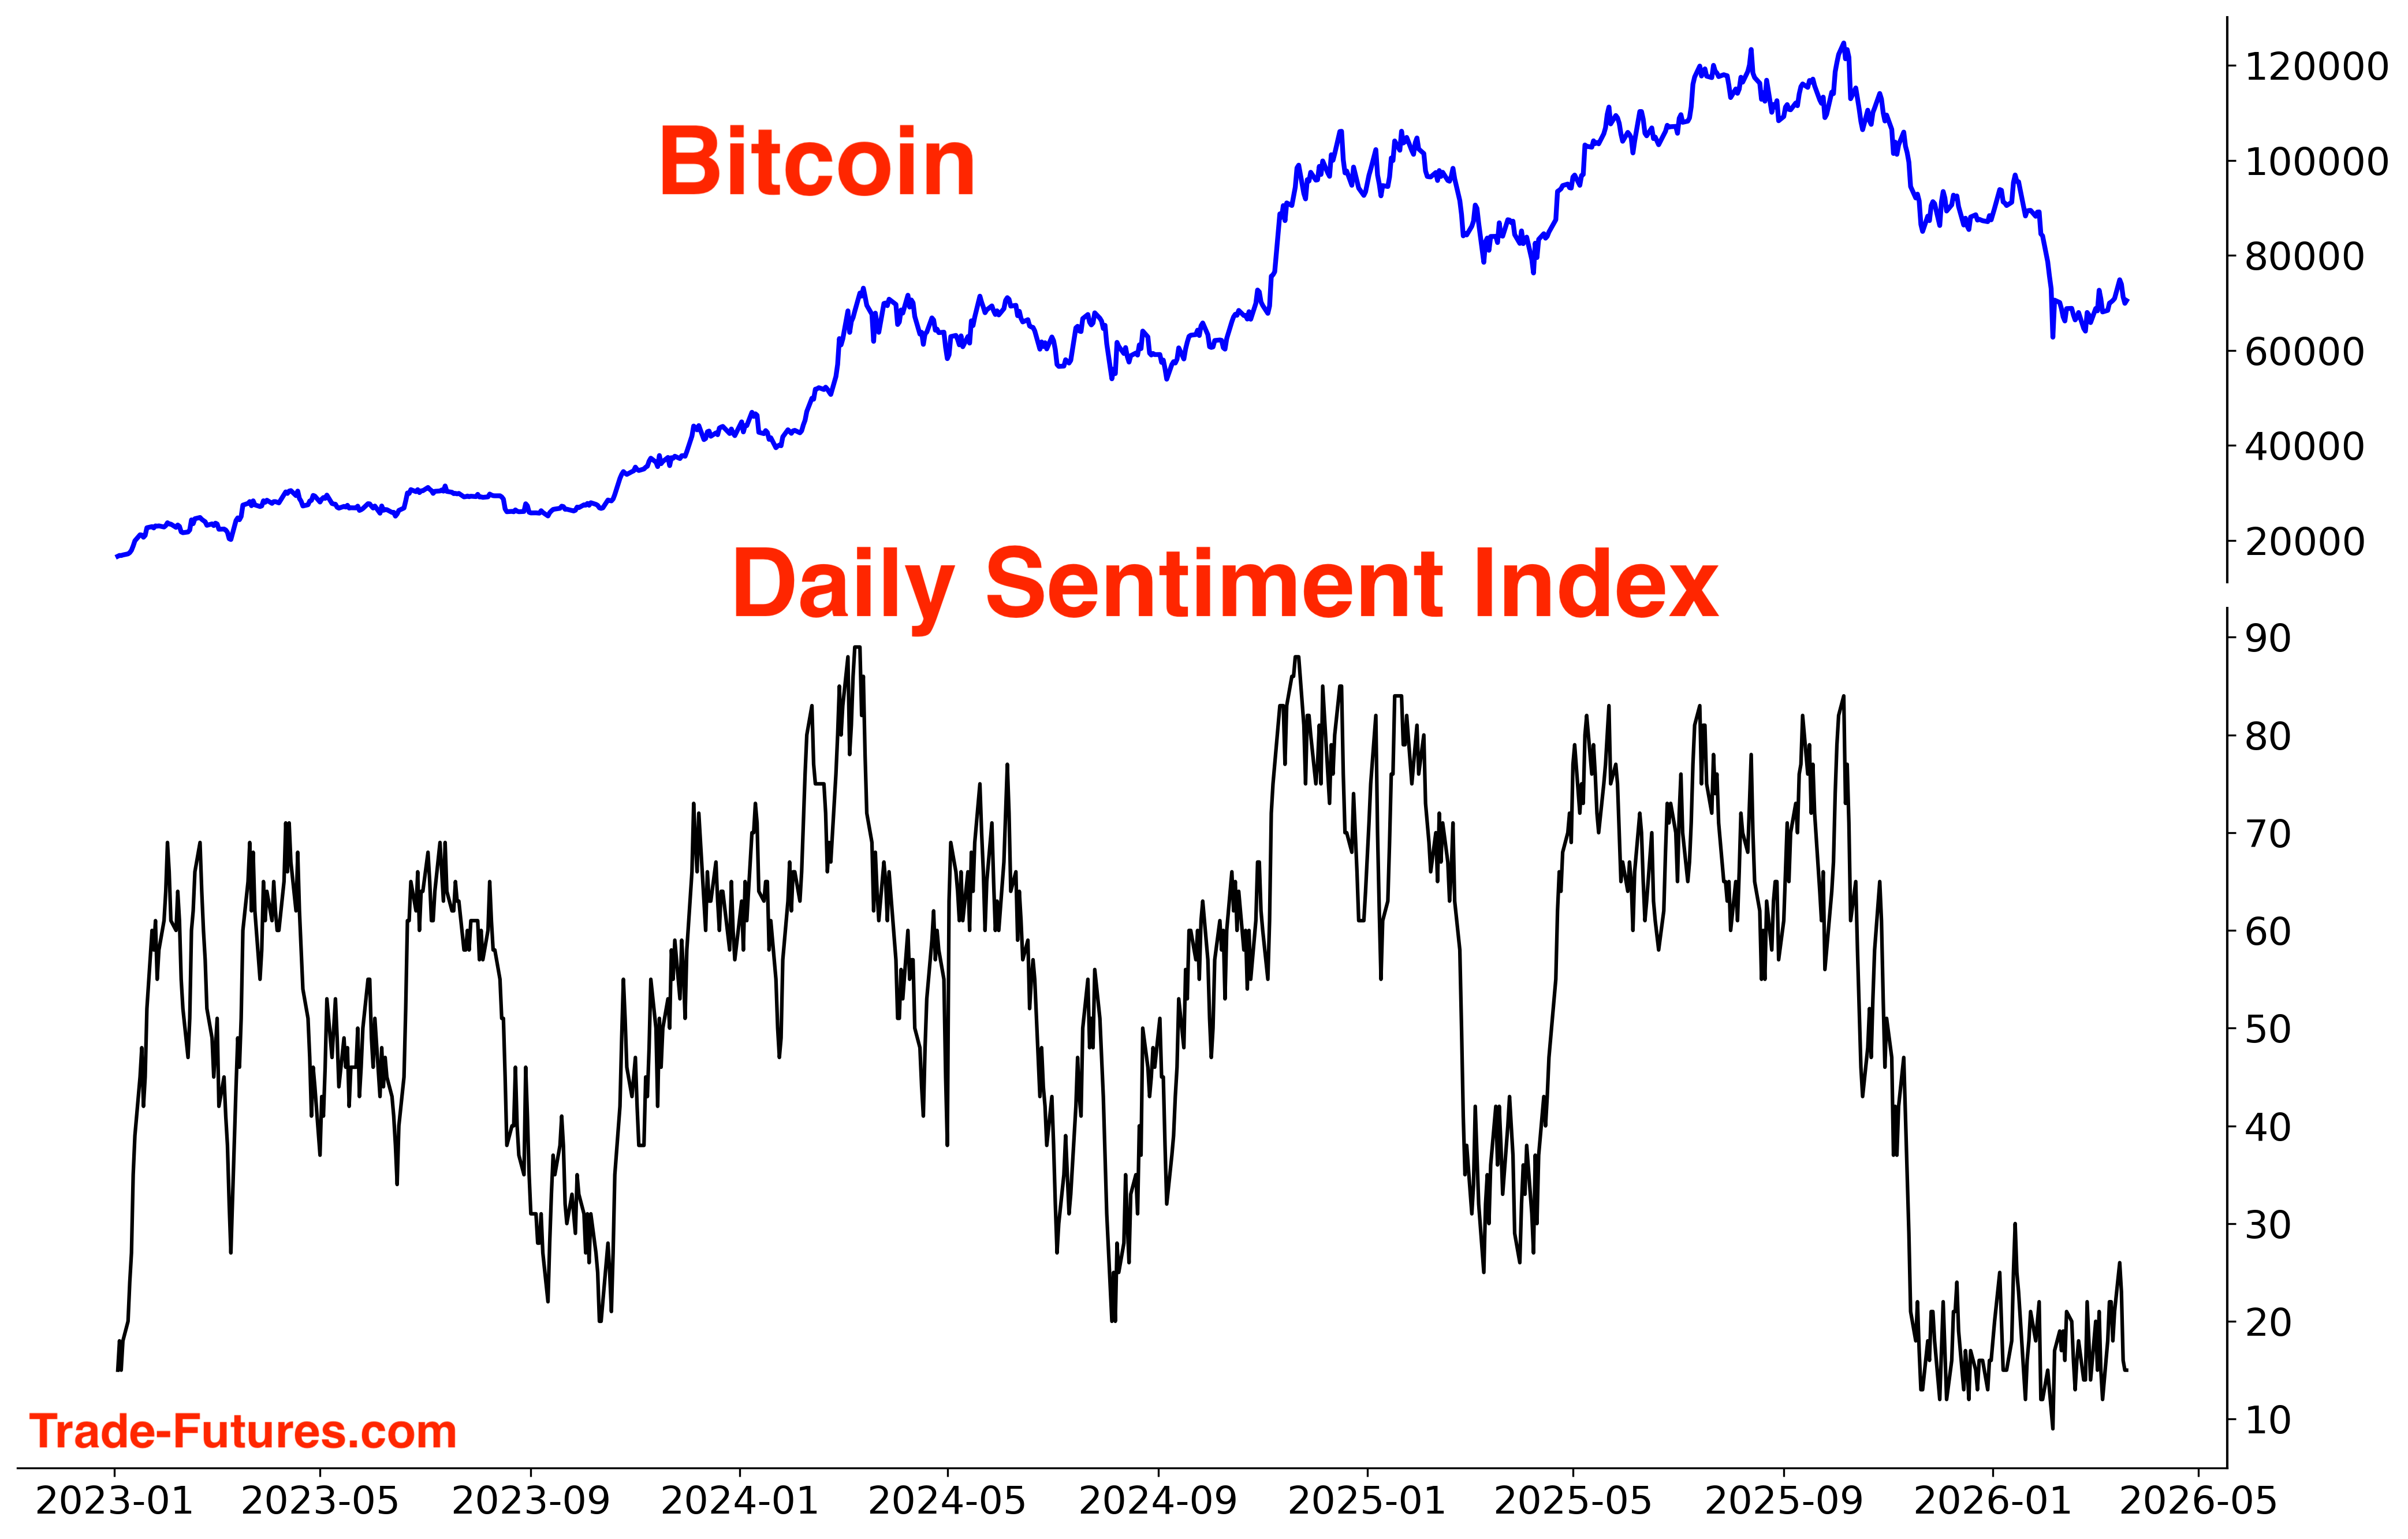
Bitcoin led the way down since October, as it did in late-2021 before the 2022 bear market:
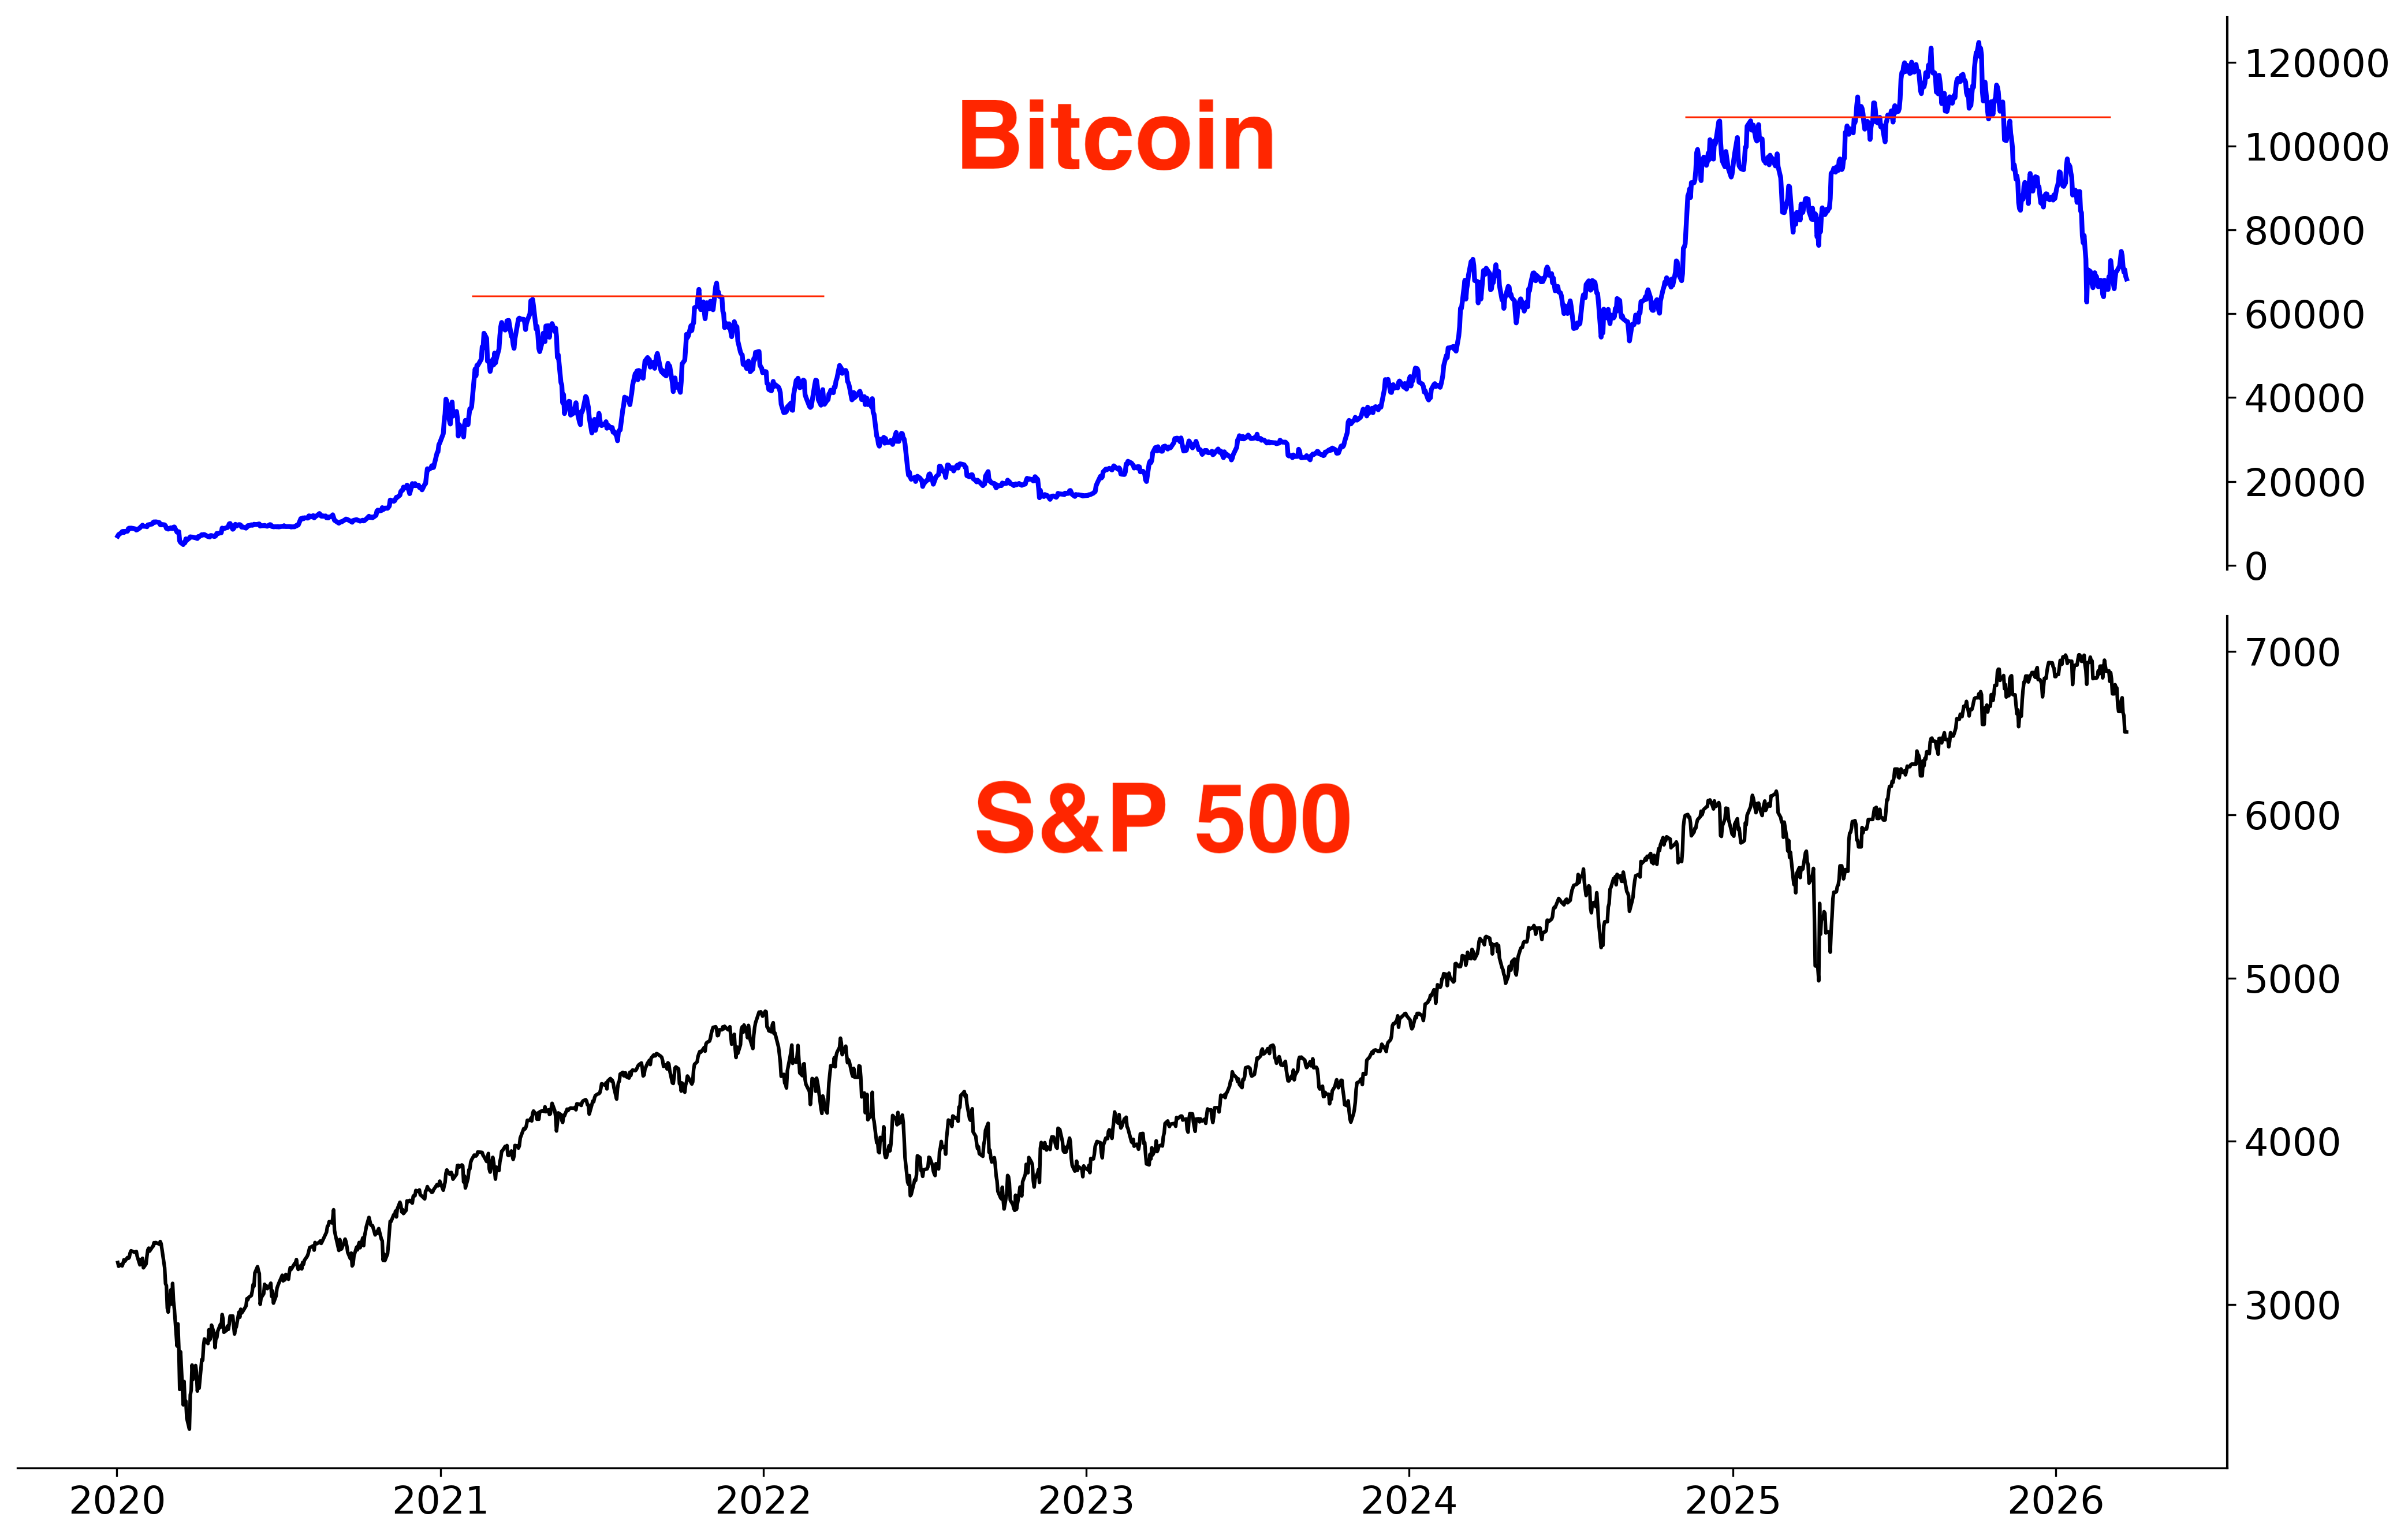
A narrative gaining traction on FinX is that Bitcoin “led the selloff and is now leading the recovery.” Bitcoin bottomed in early-February, even as equities pushed to fresh lows. While this divergence is being interpreted by some as a bullish signal for both stocks and crypto, an alternative explanation is that Bitcoin is being utilized amid geopolitical stress as a vehicle for capital movement, helping Bitcoin holders bypass traditional financial restrictions. In other words, we are seeing increased tangible demand for Bitcoin during this war.
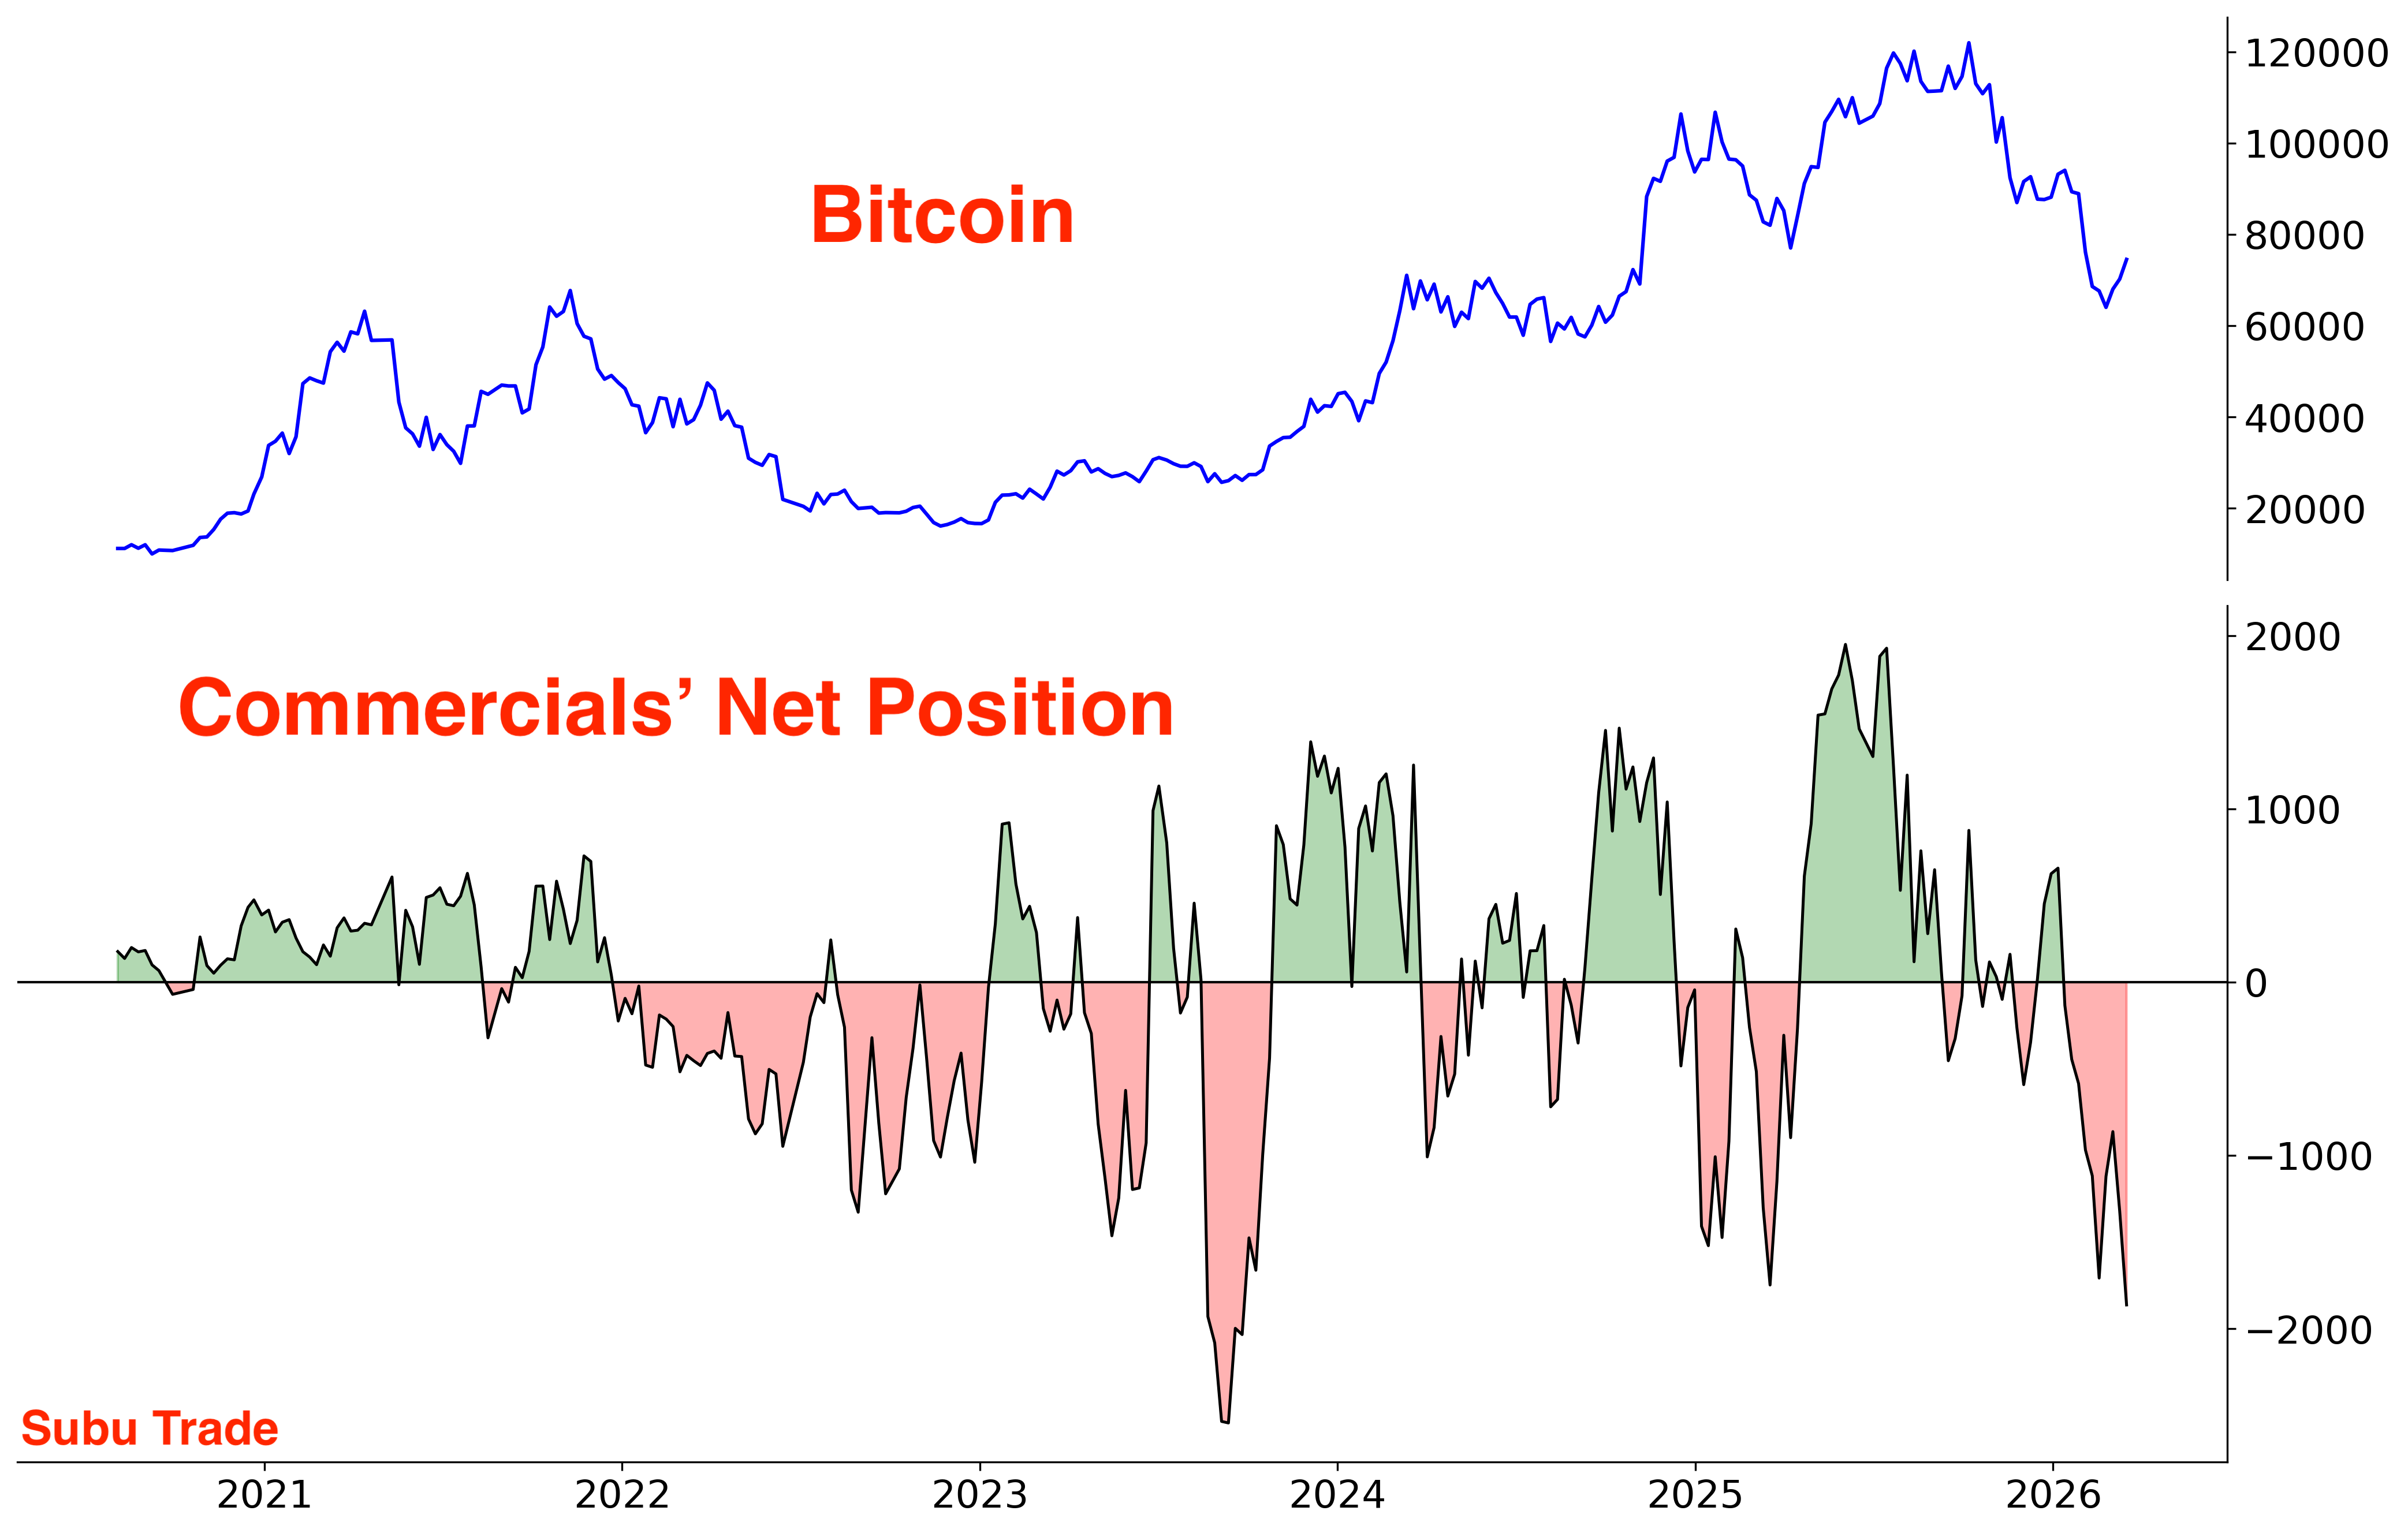
Regardless of why Bitcoin has been steady while stocks fell, we can see that Commercials are extremely net-short Bitcoin while Large Speculators are extremely net-long. This has been a bullish sign for Bitcoin in the past.
From the COT Report:
Bitcoin sentiment is in the dumps:
Energy
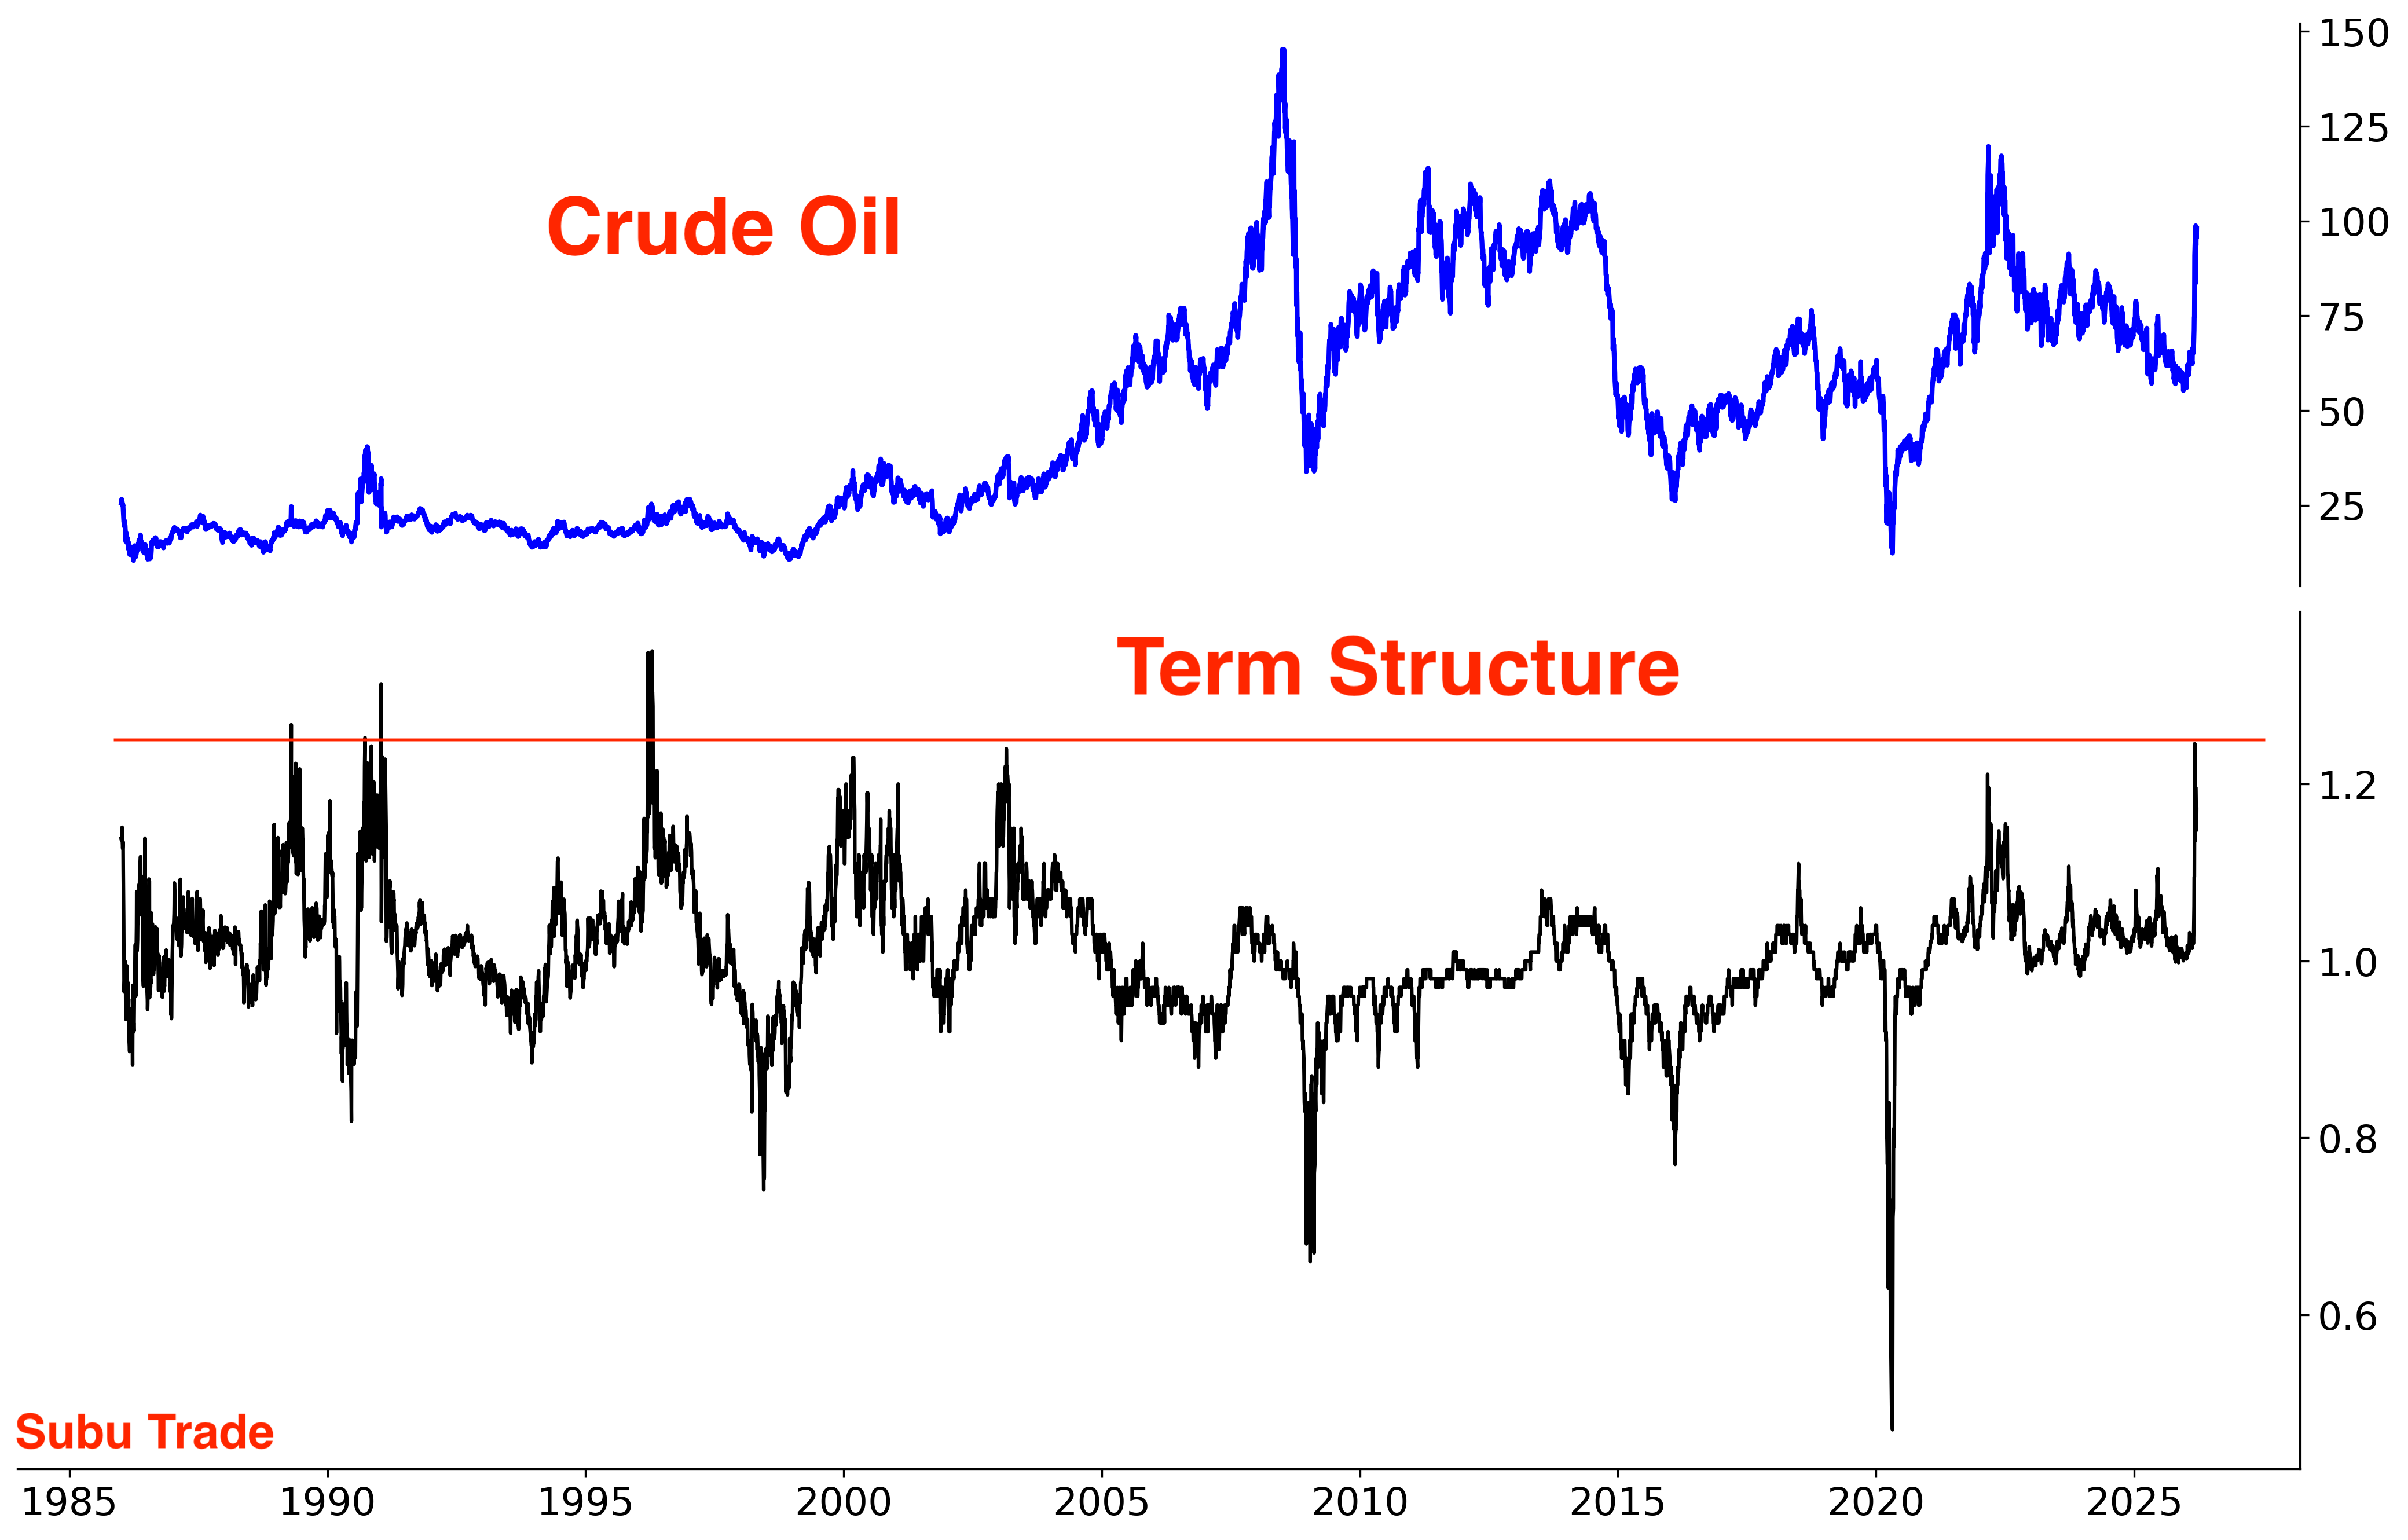
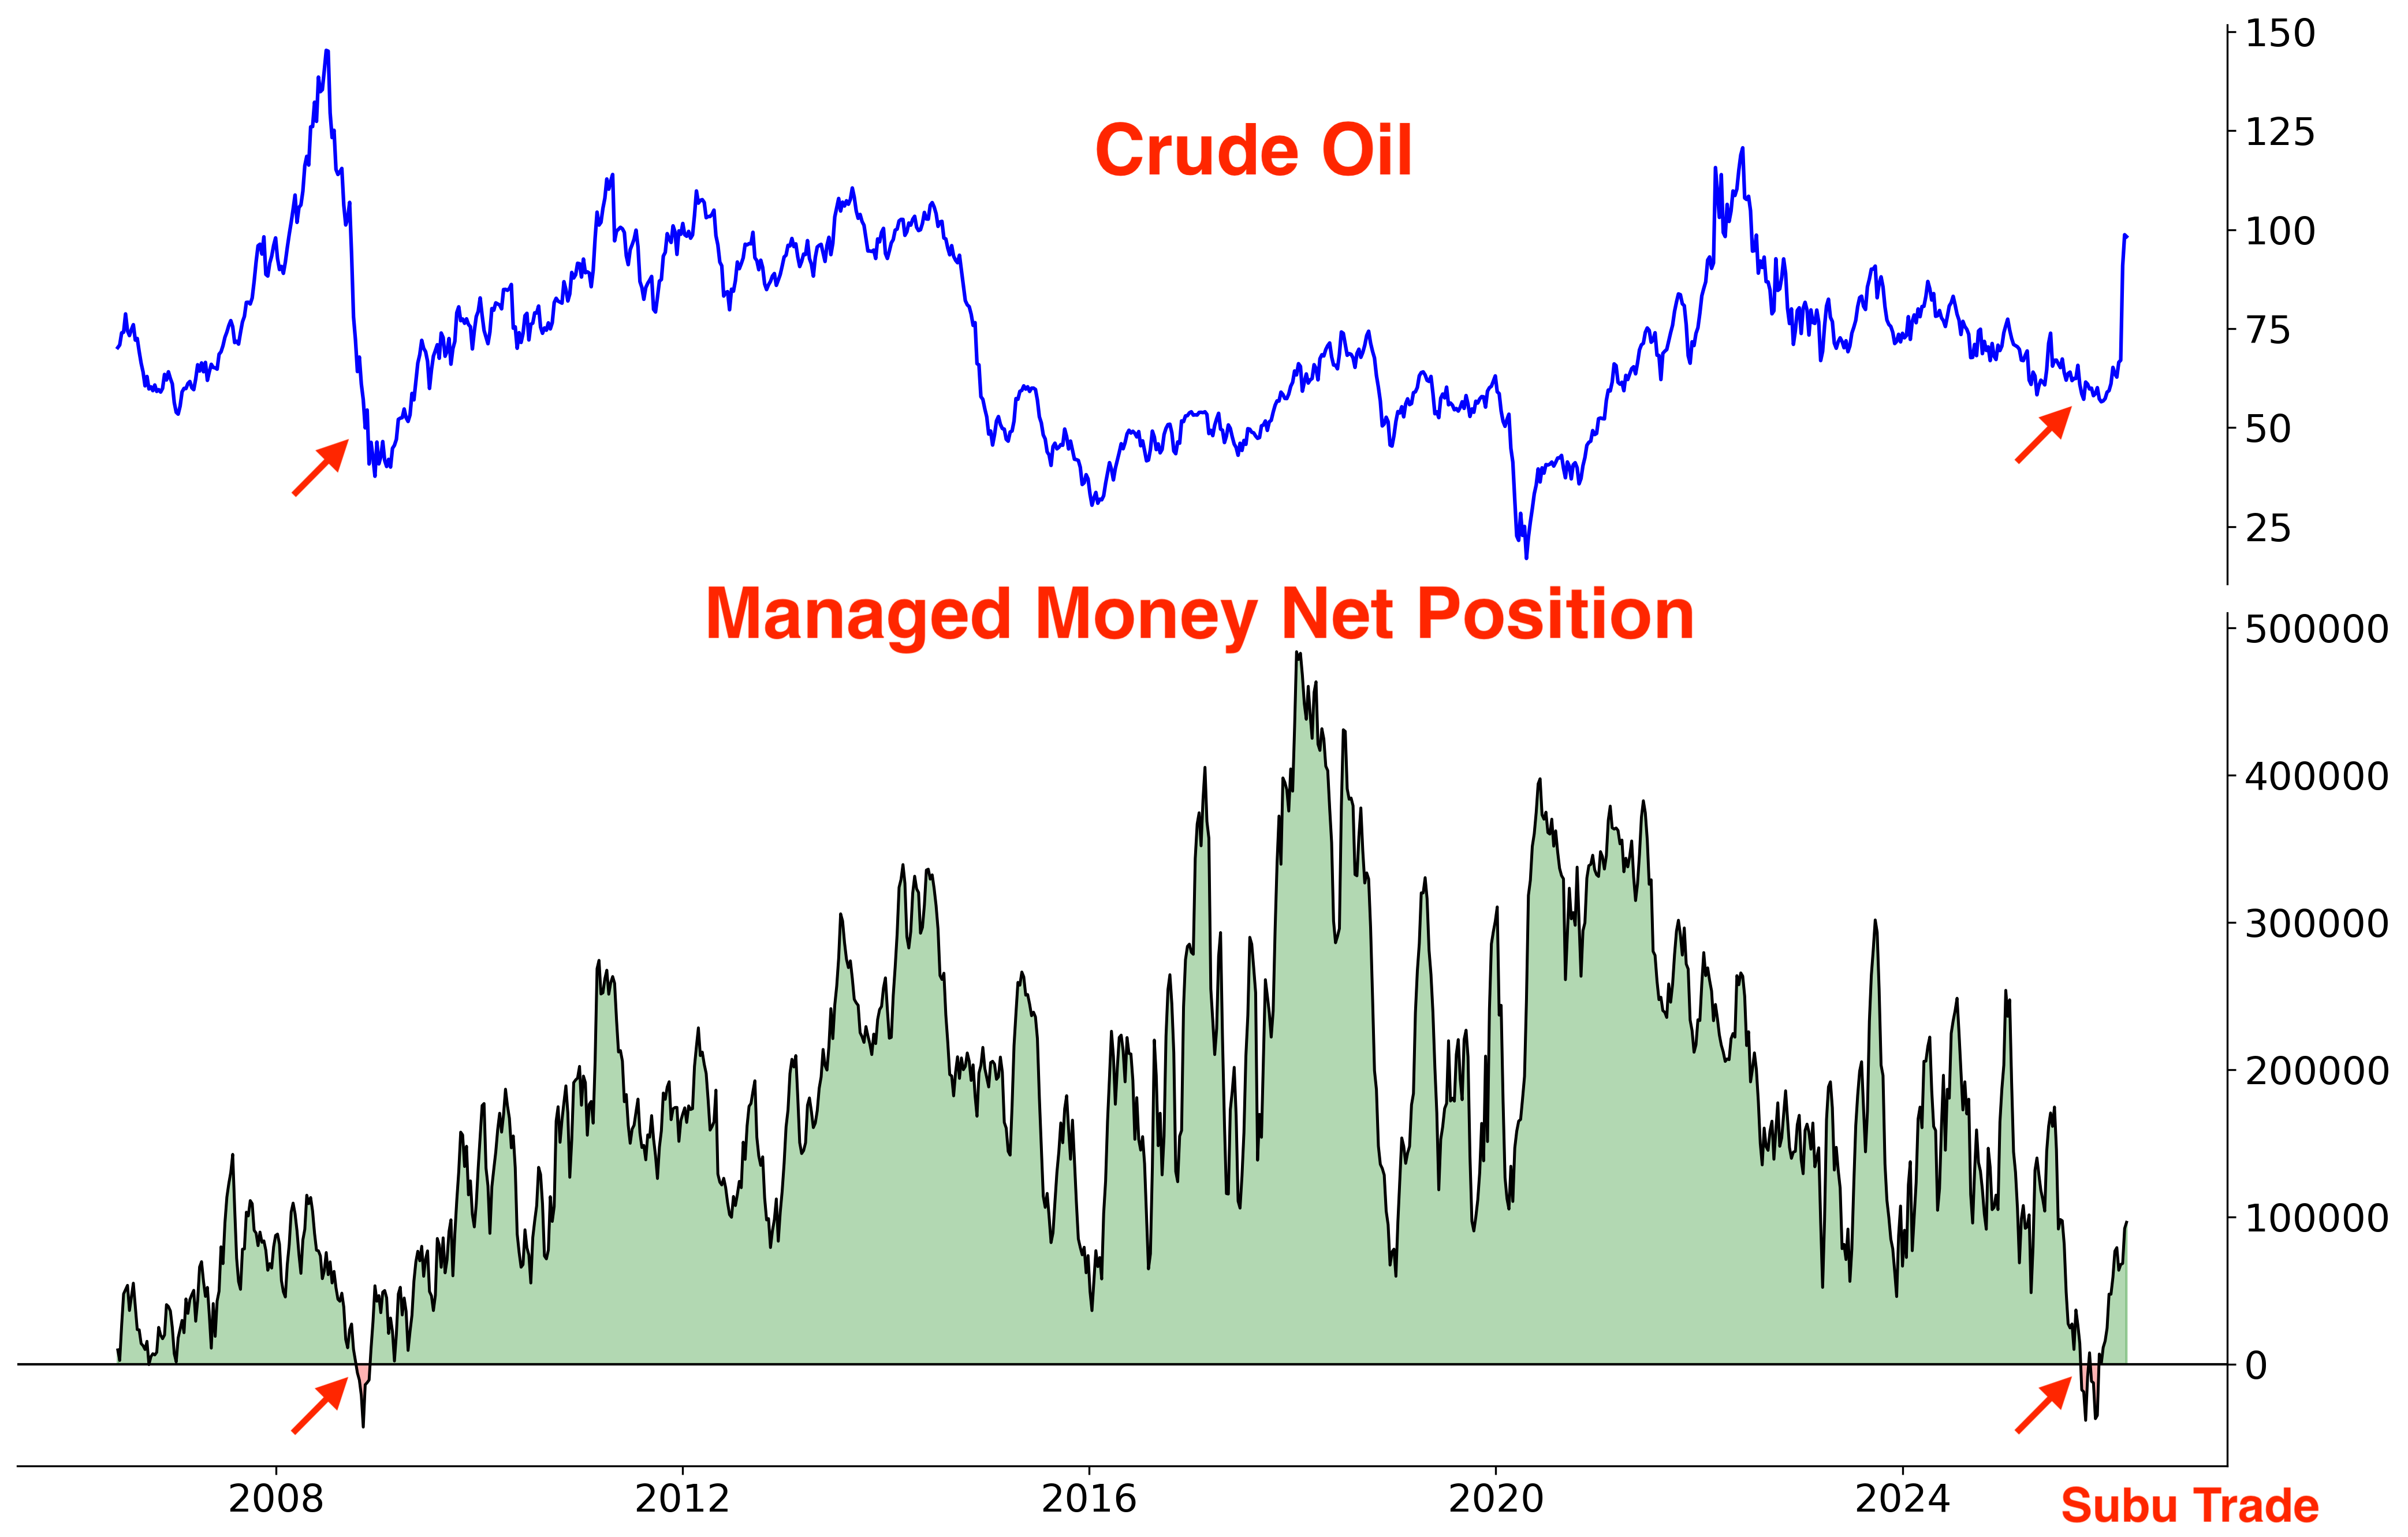
Markets are increasingly pricing in a “higher for longer” oil regime. This shift carries wide-ranging implications across asset classes and global economies, with the heaviest burden falling on major energy importers in Europe and Asia.
As I said before, energy went from being hated, to being loved. Last year saw Hedge Funds net-short Crude for the first time since 2008!
From the COT Report: Small Speculators are record net-long Gasoline:
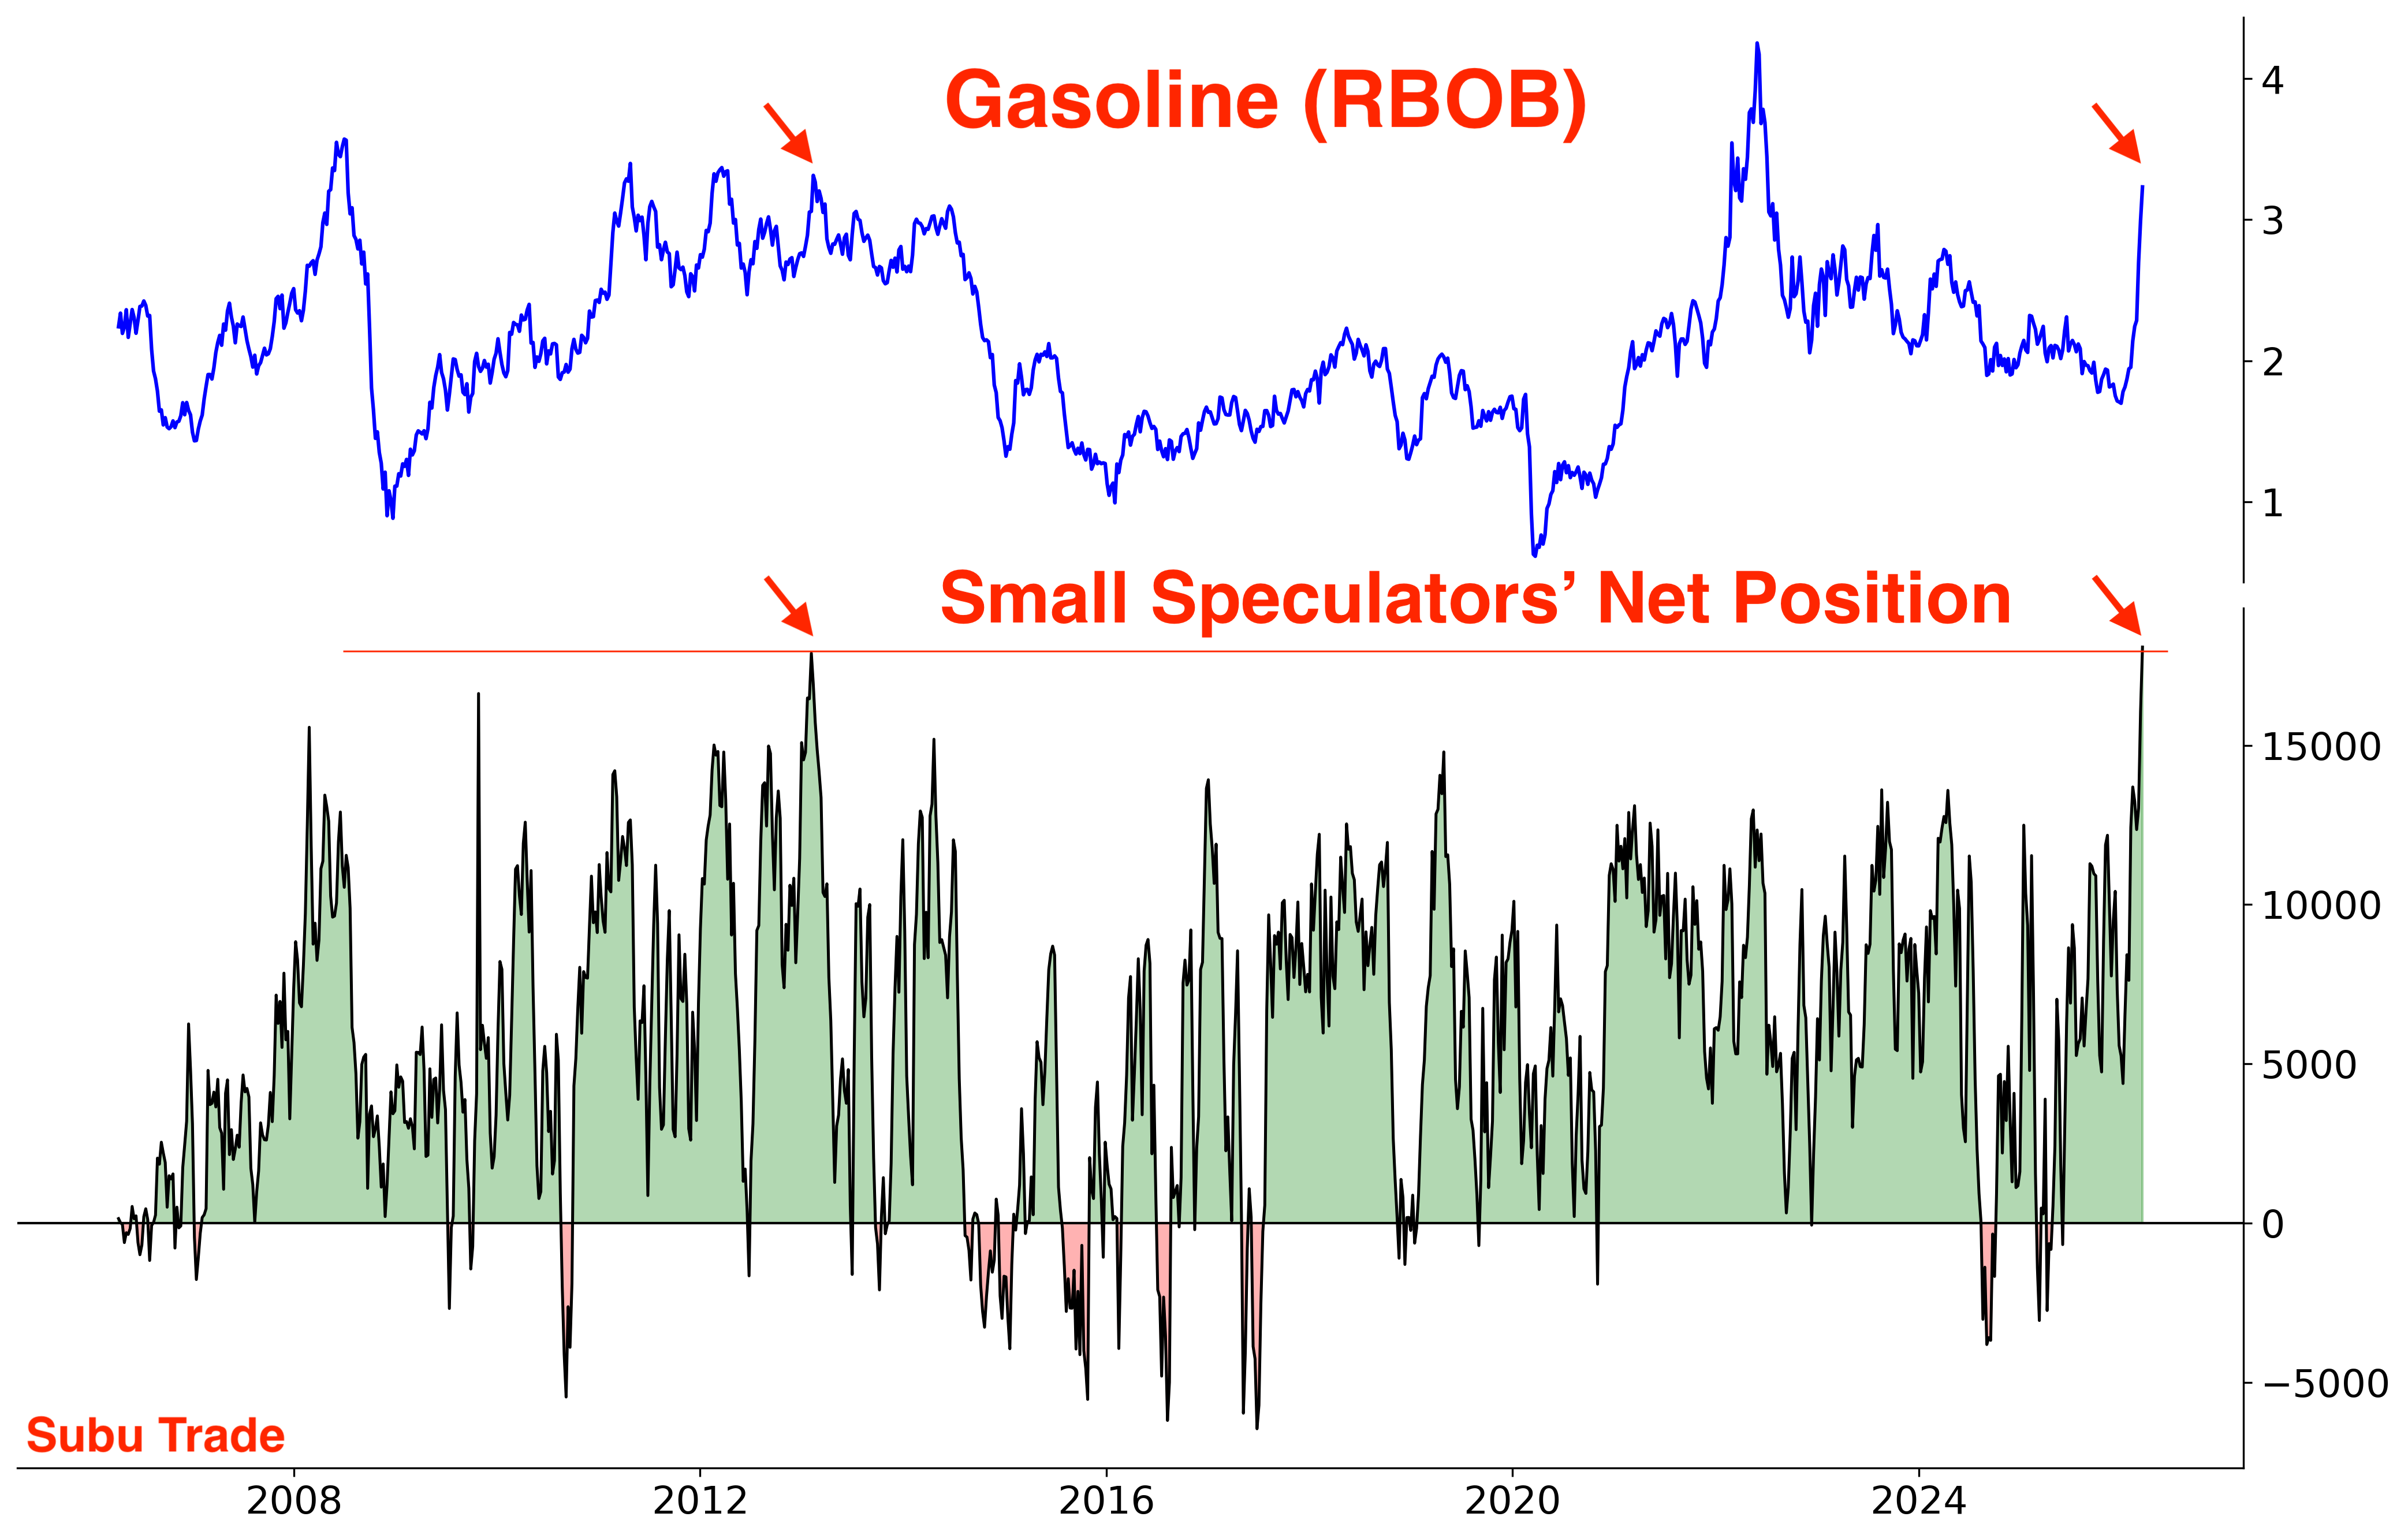
The longer the Iran conflict drags on, the more this will benefit U.S. energy producers:
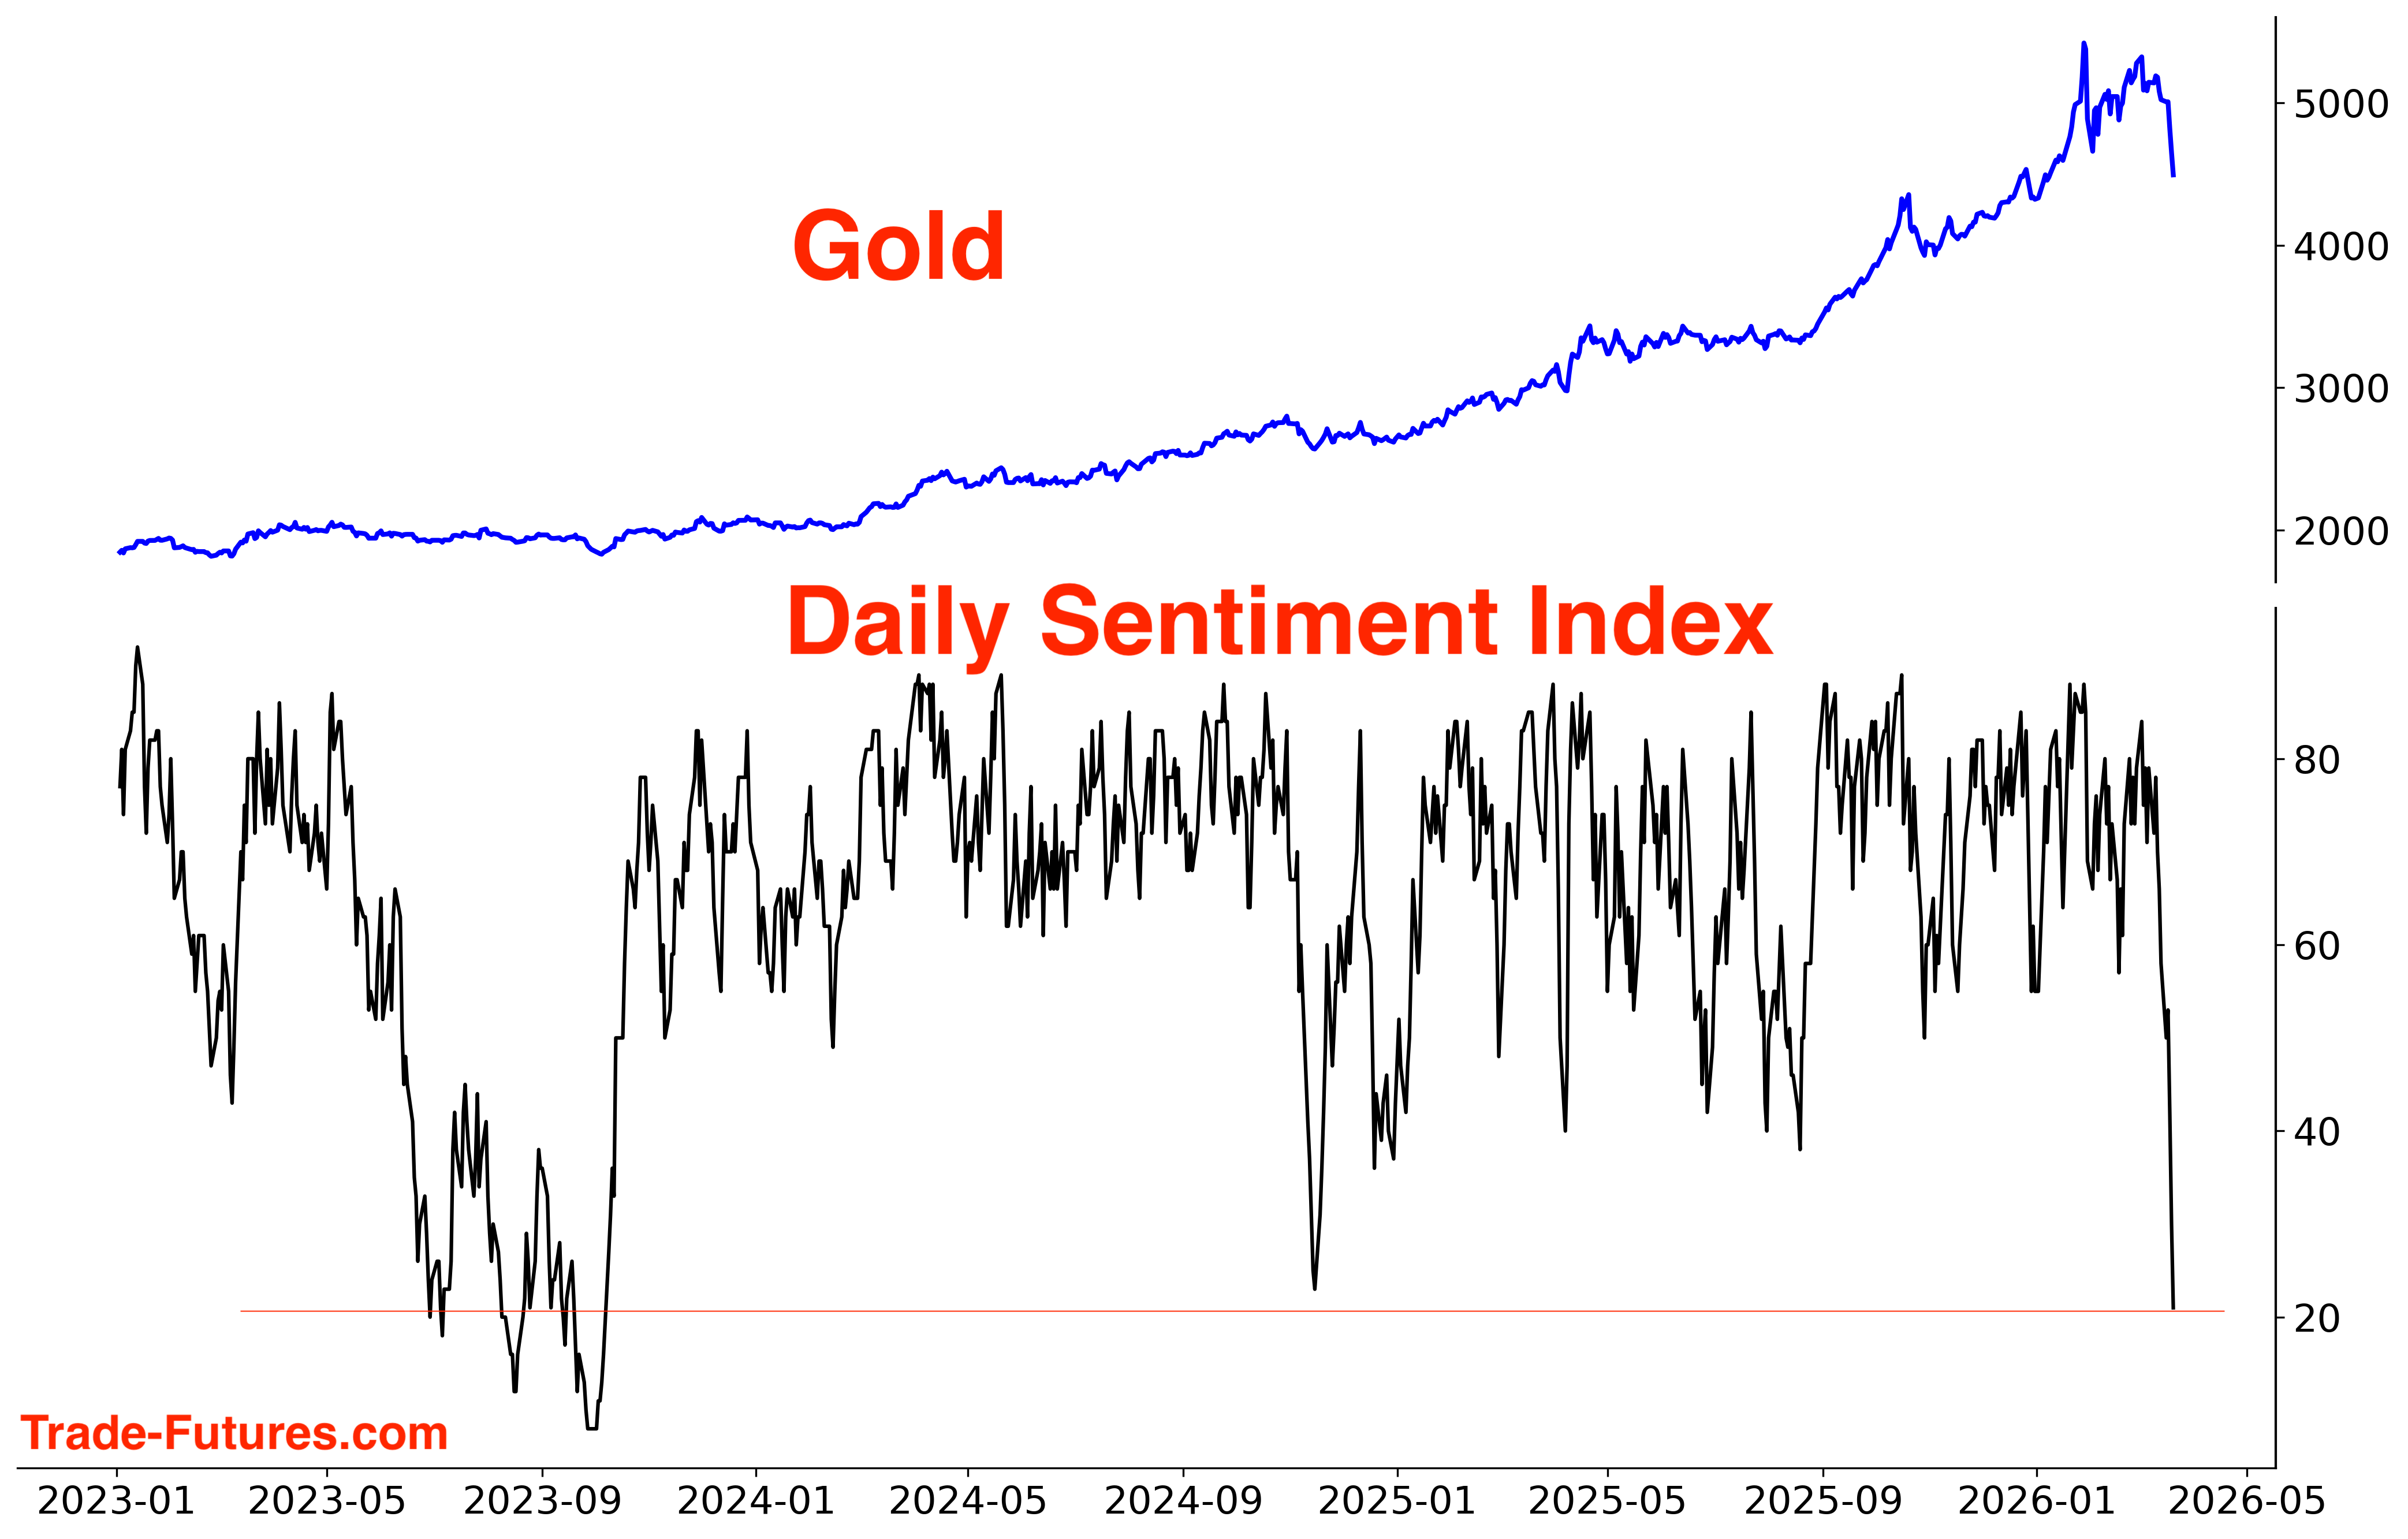
While energy prices soared, precious metals got crushed.
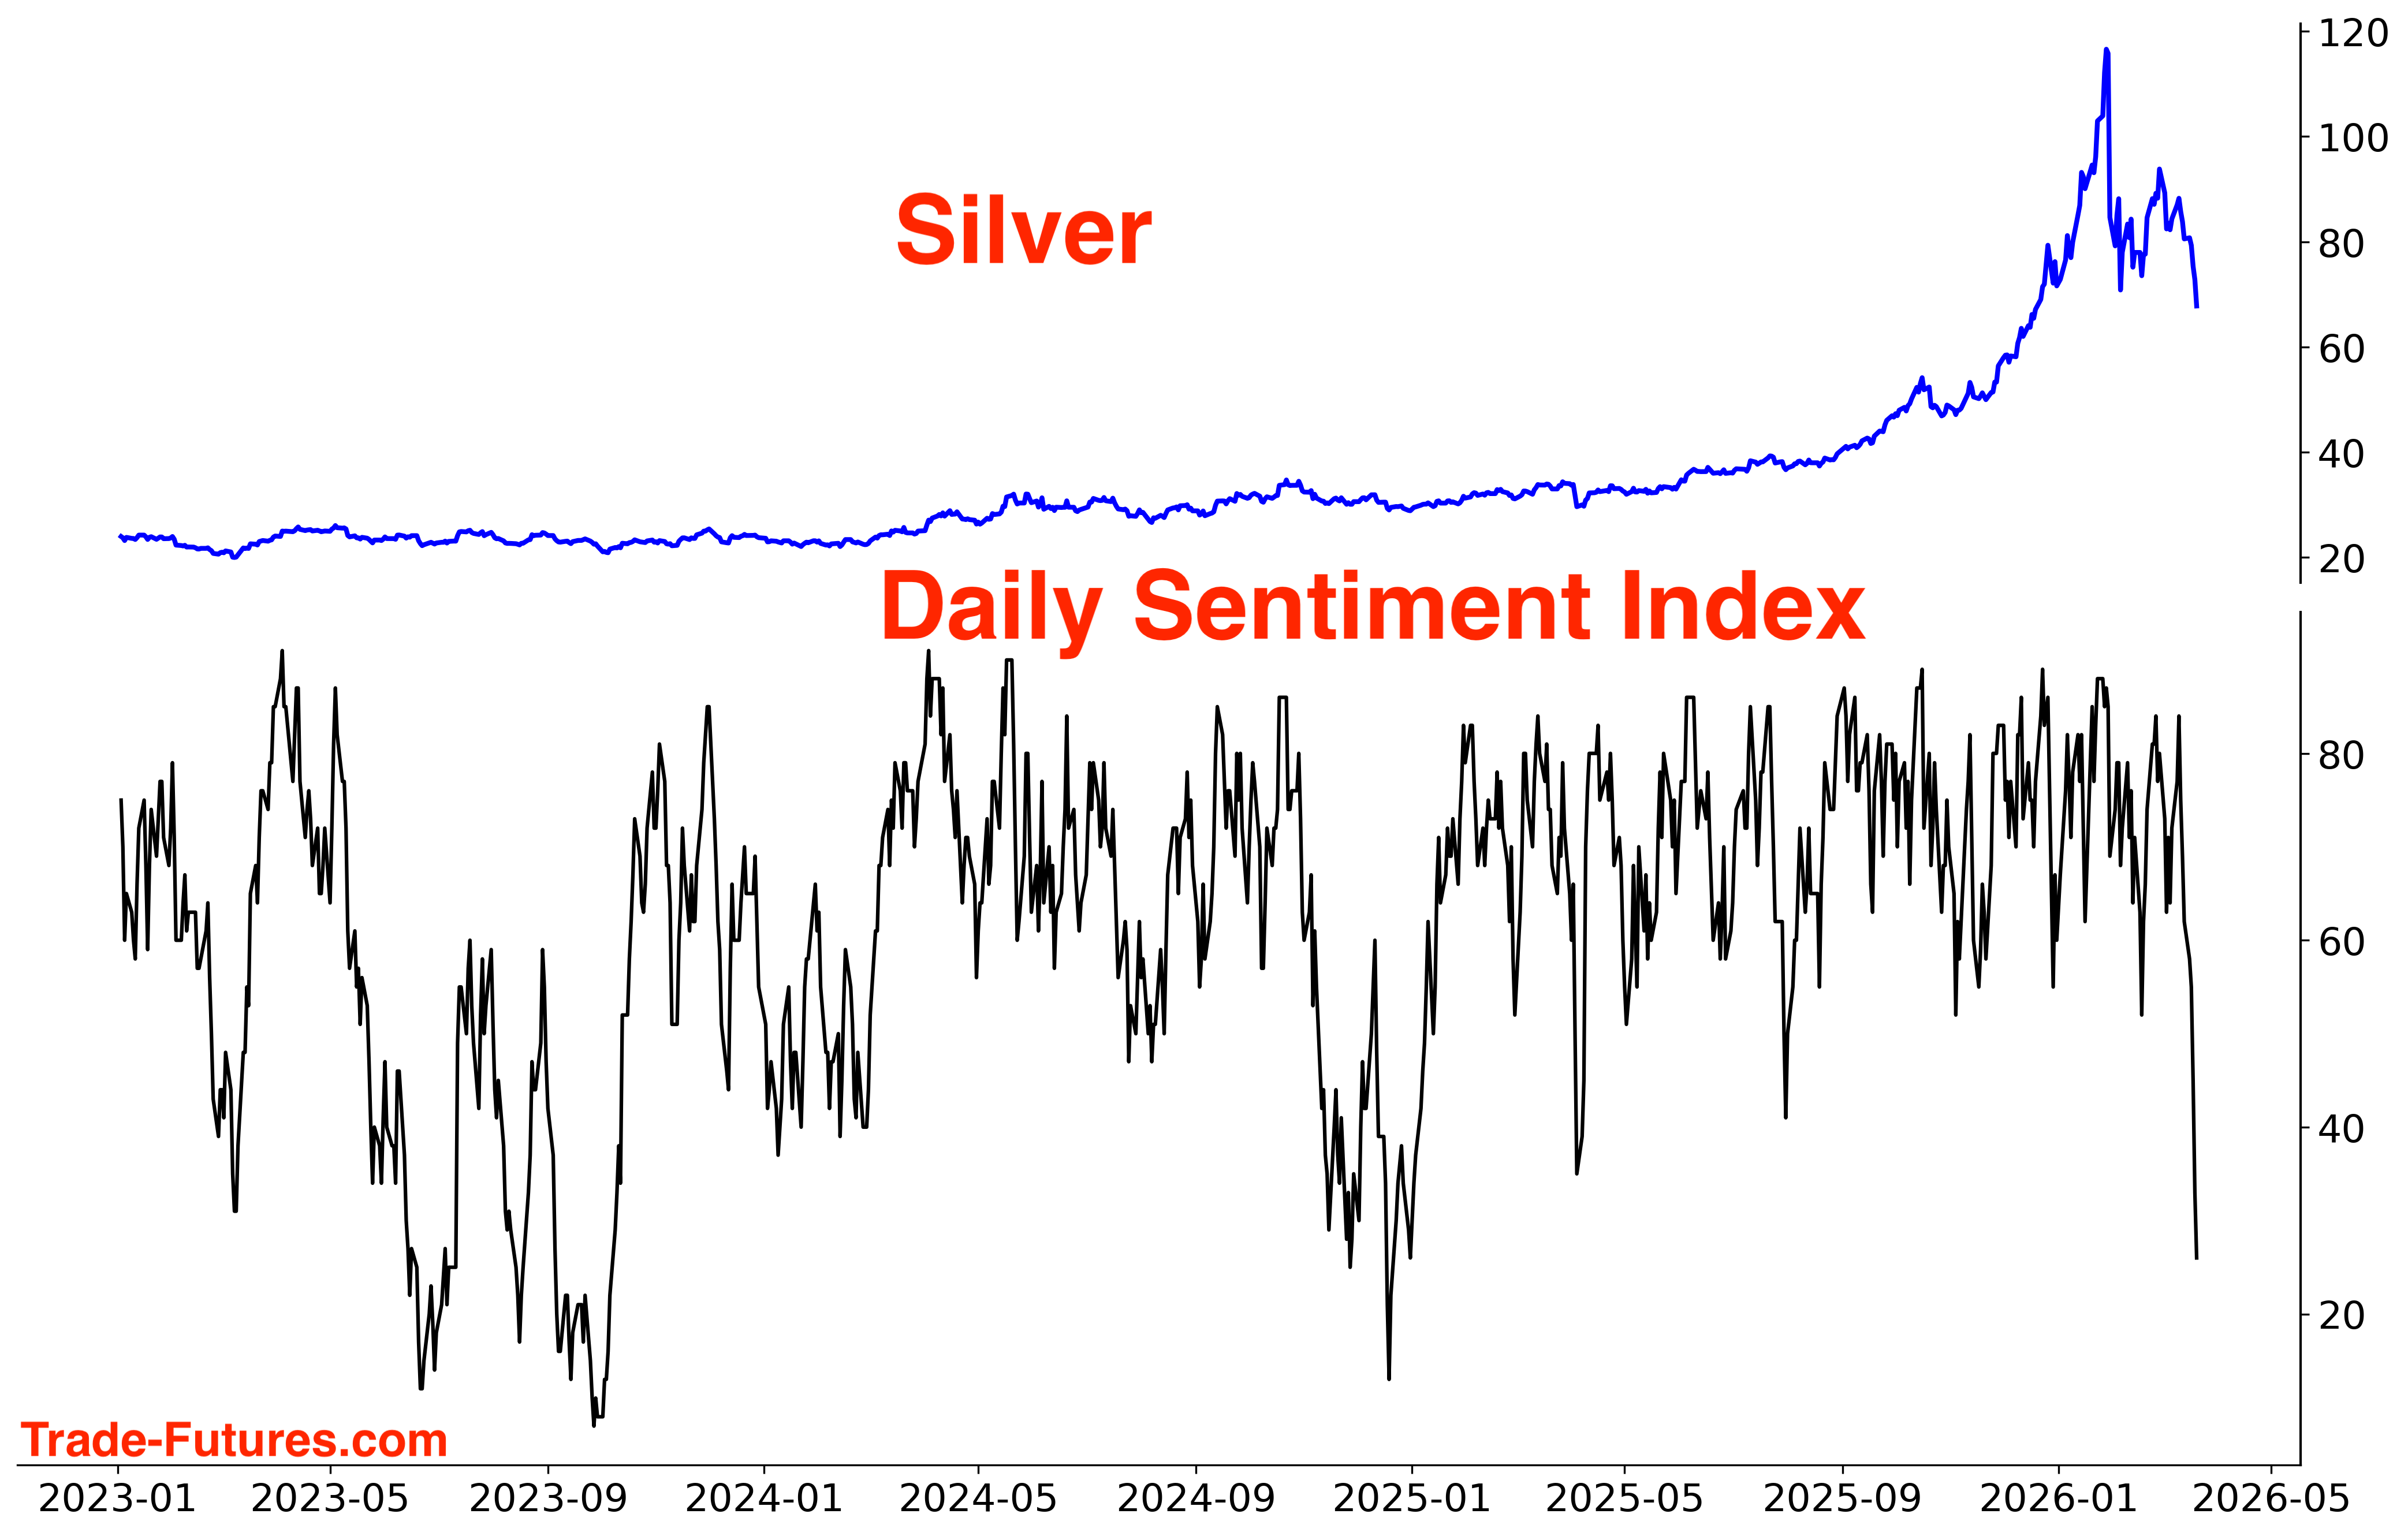
Gold, Silver
Gold plunged this week. Gold sentiment:
Silver sentiment:
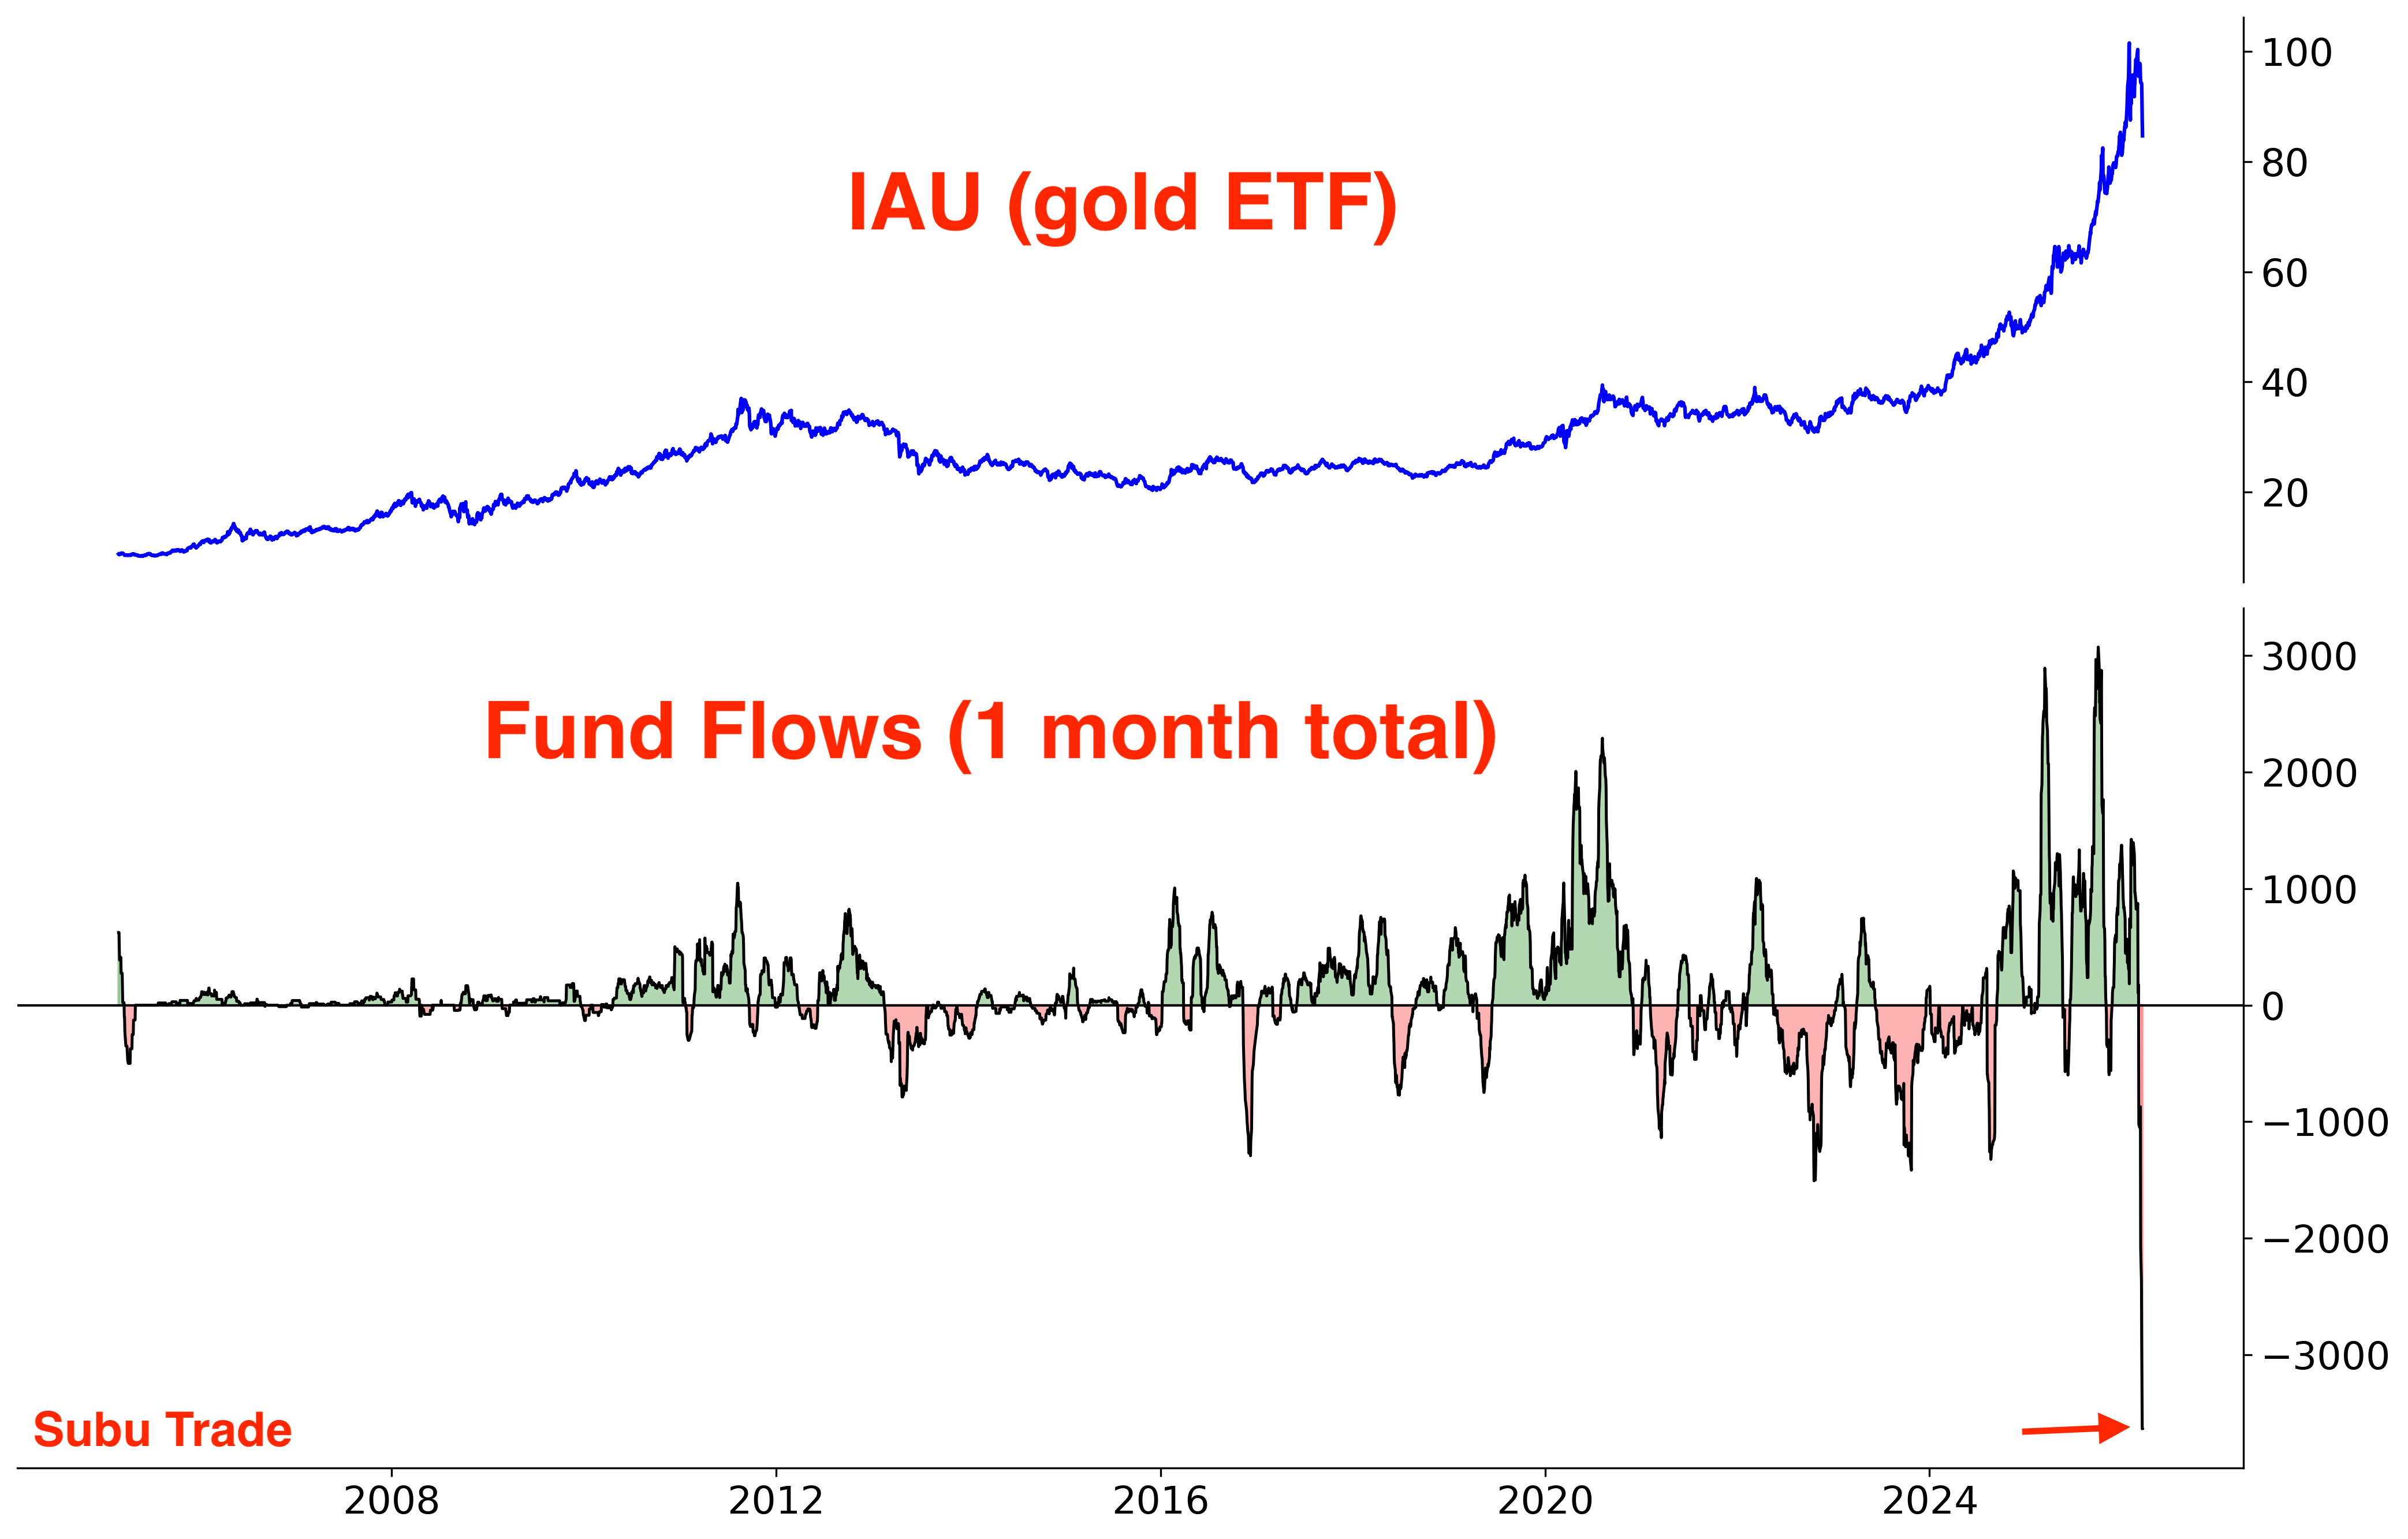
IAU saw massive outflows this month. All those precious metals investors who bought at the top are un-winding their positions:
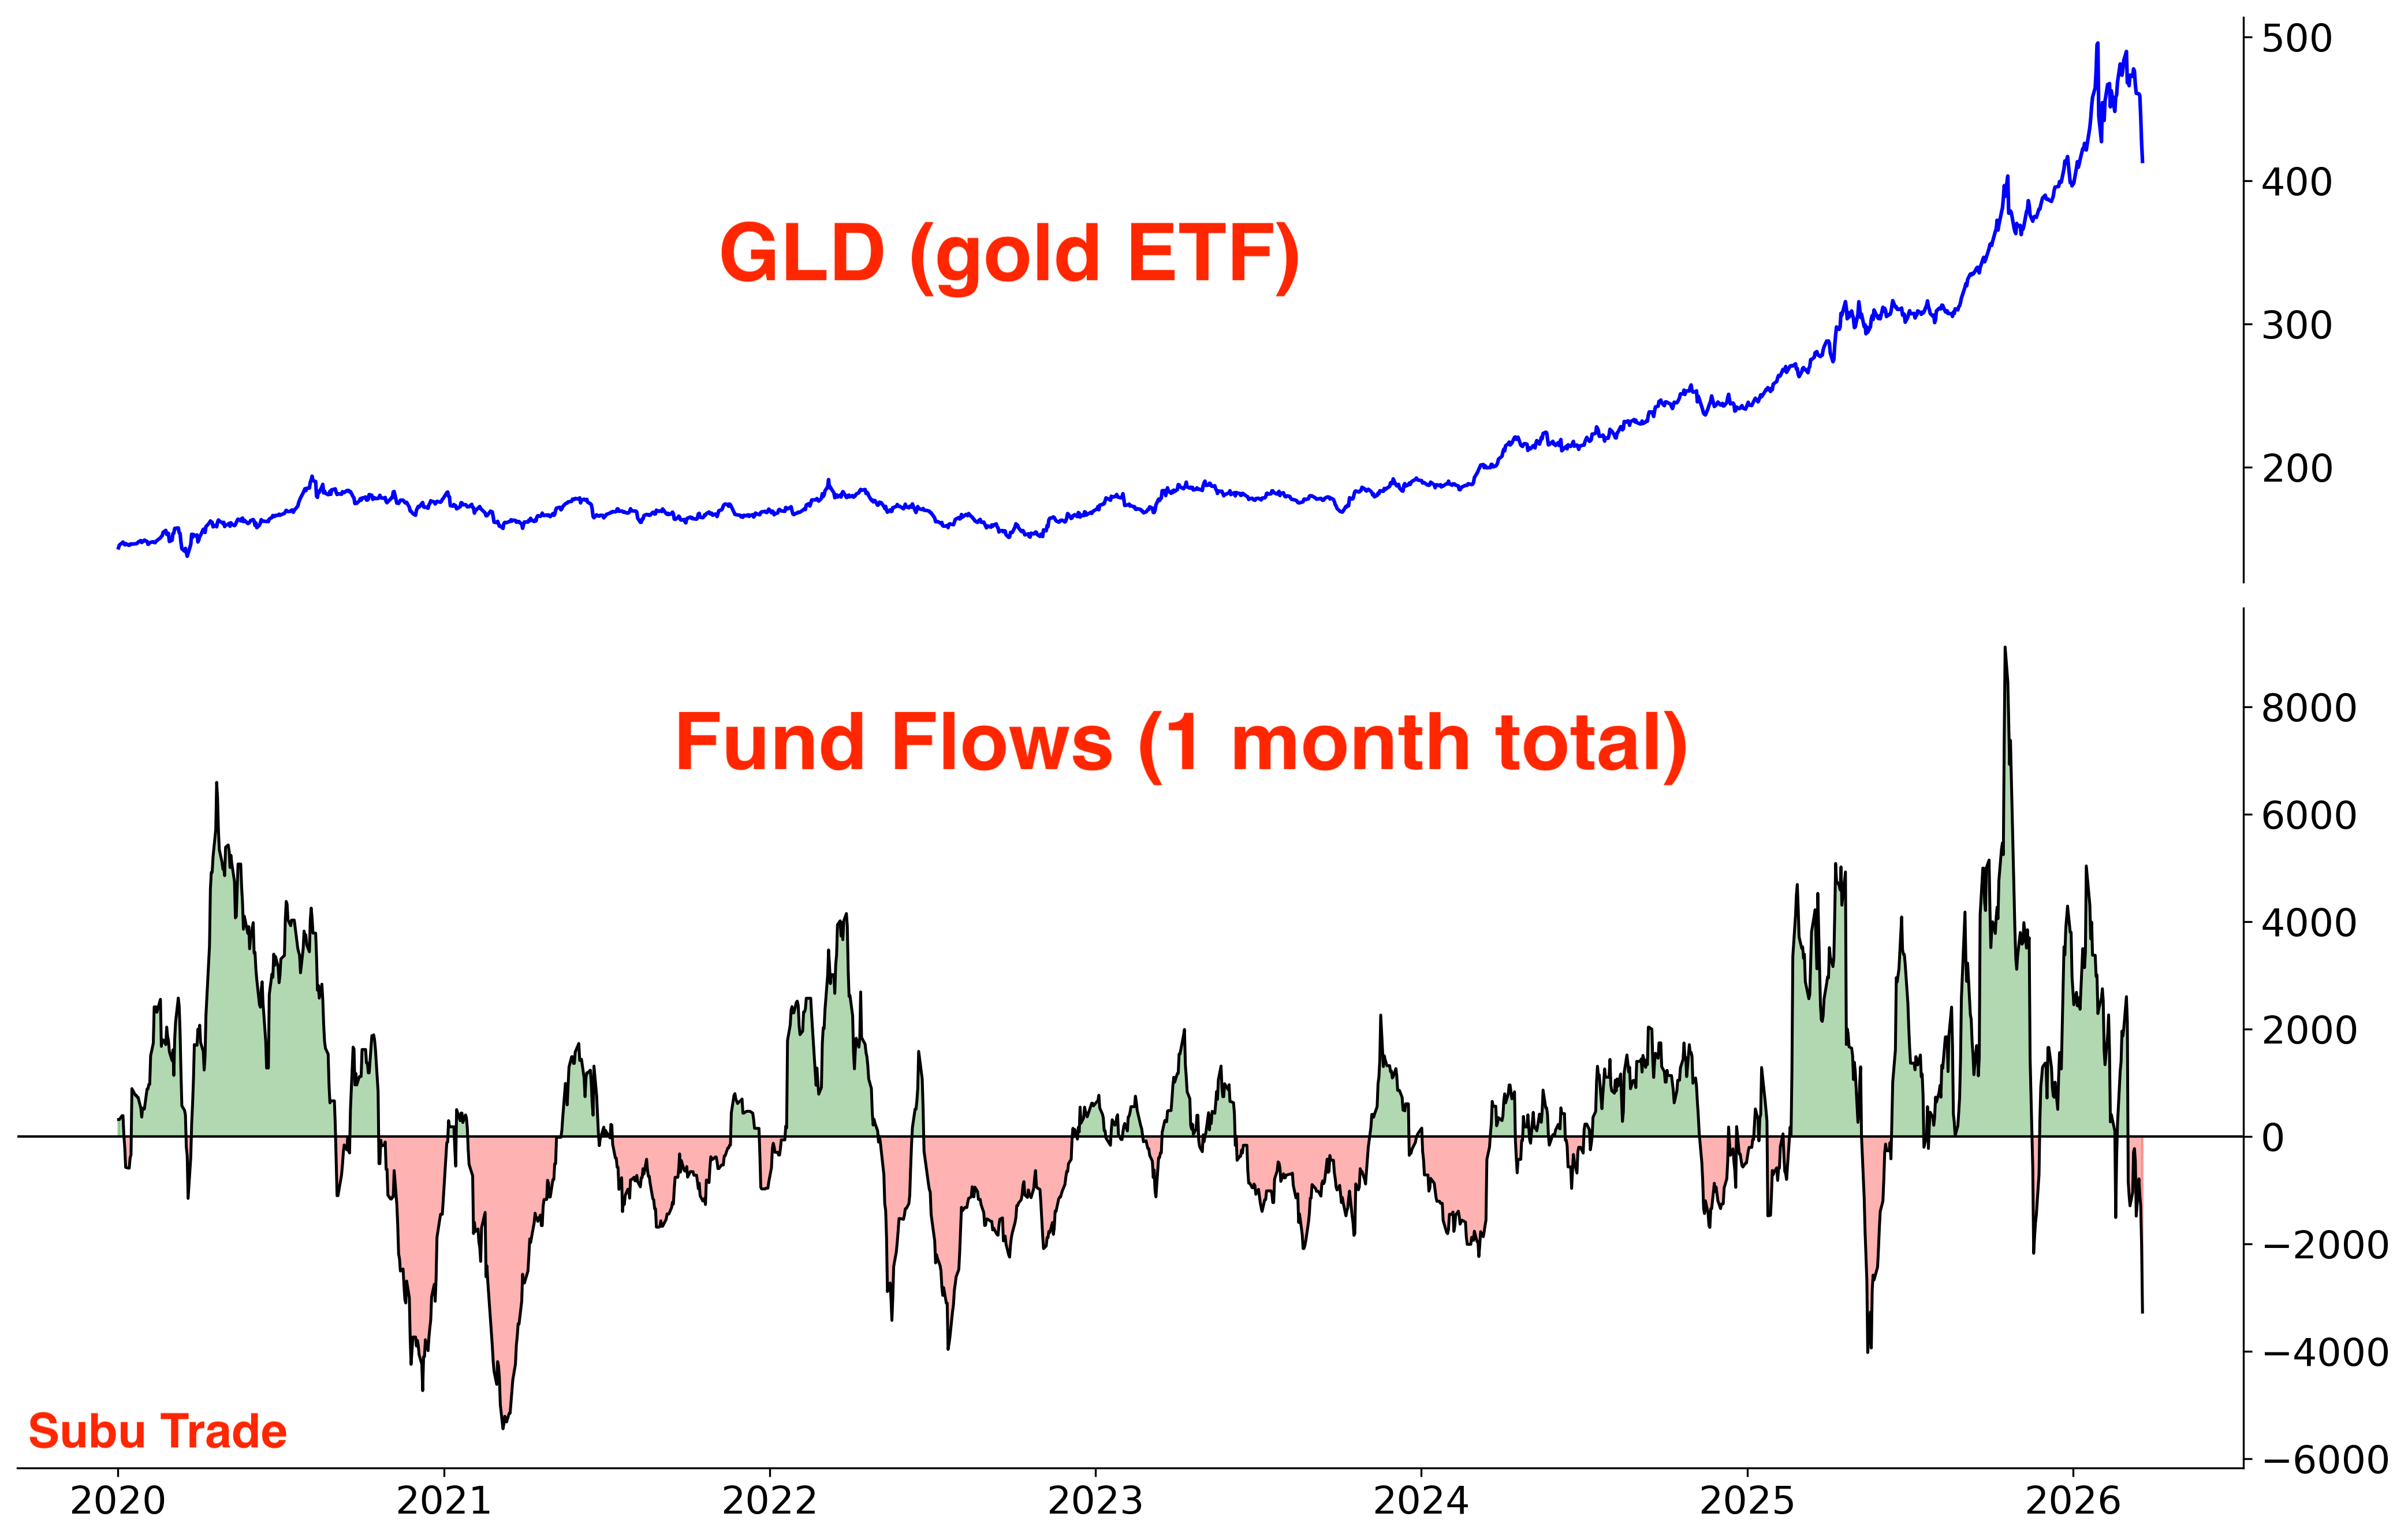
GLD outflows:
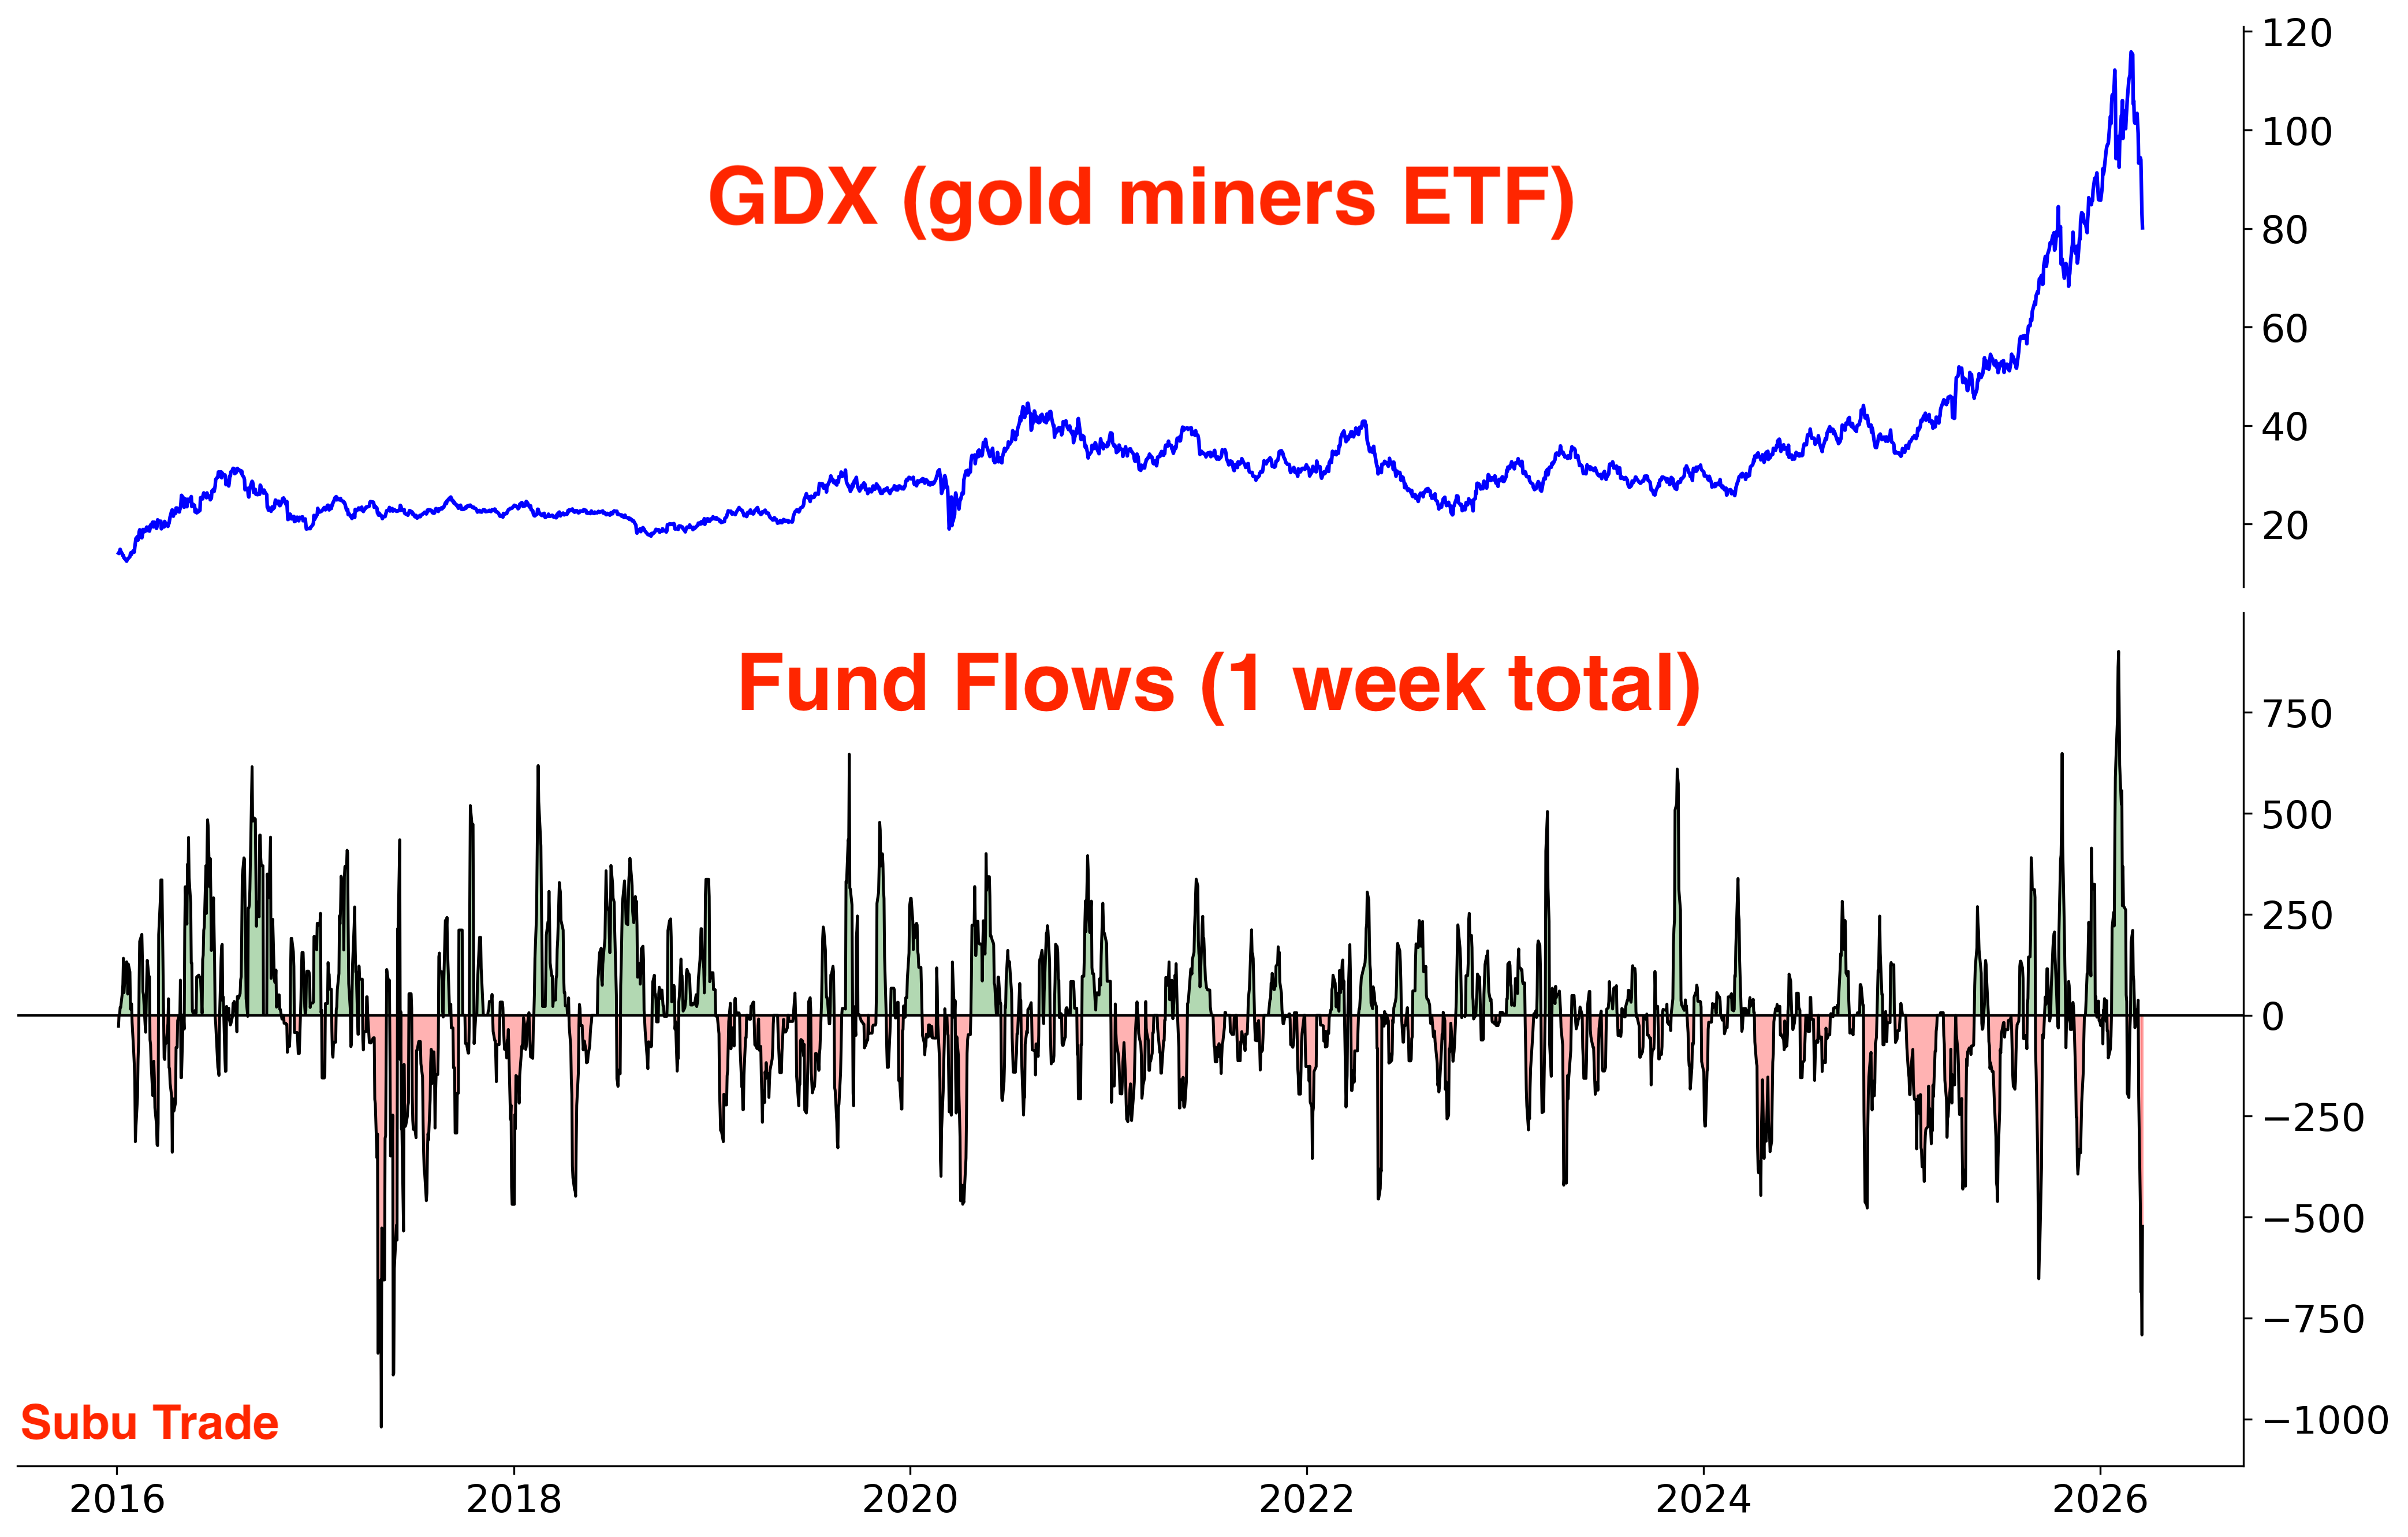
GDX outflows:
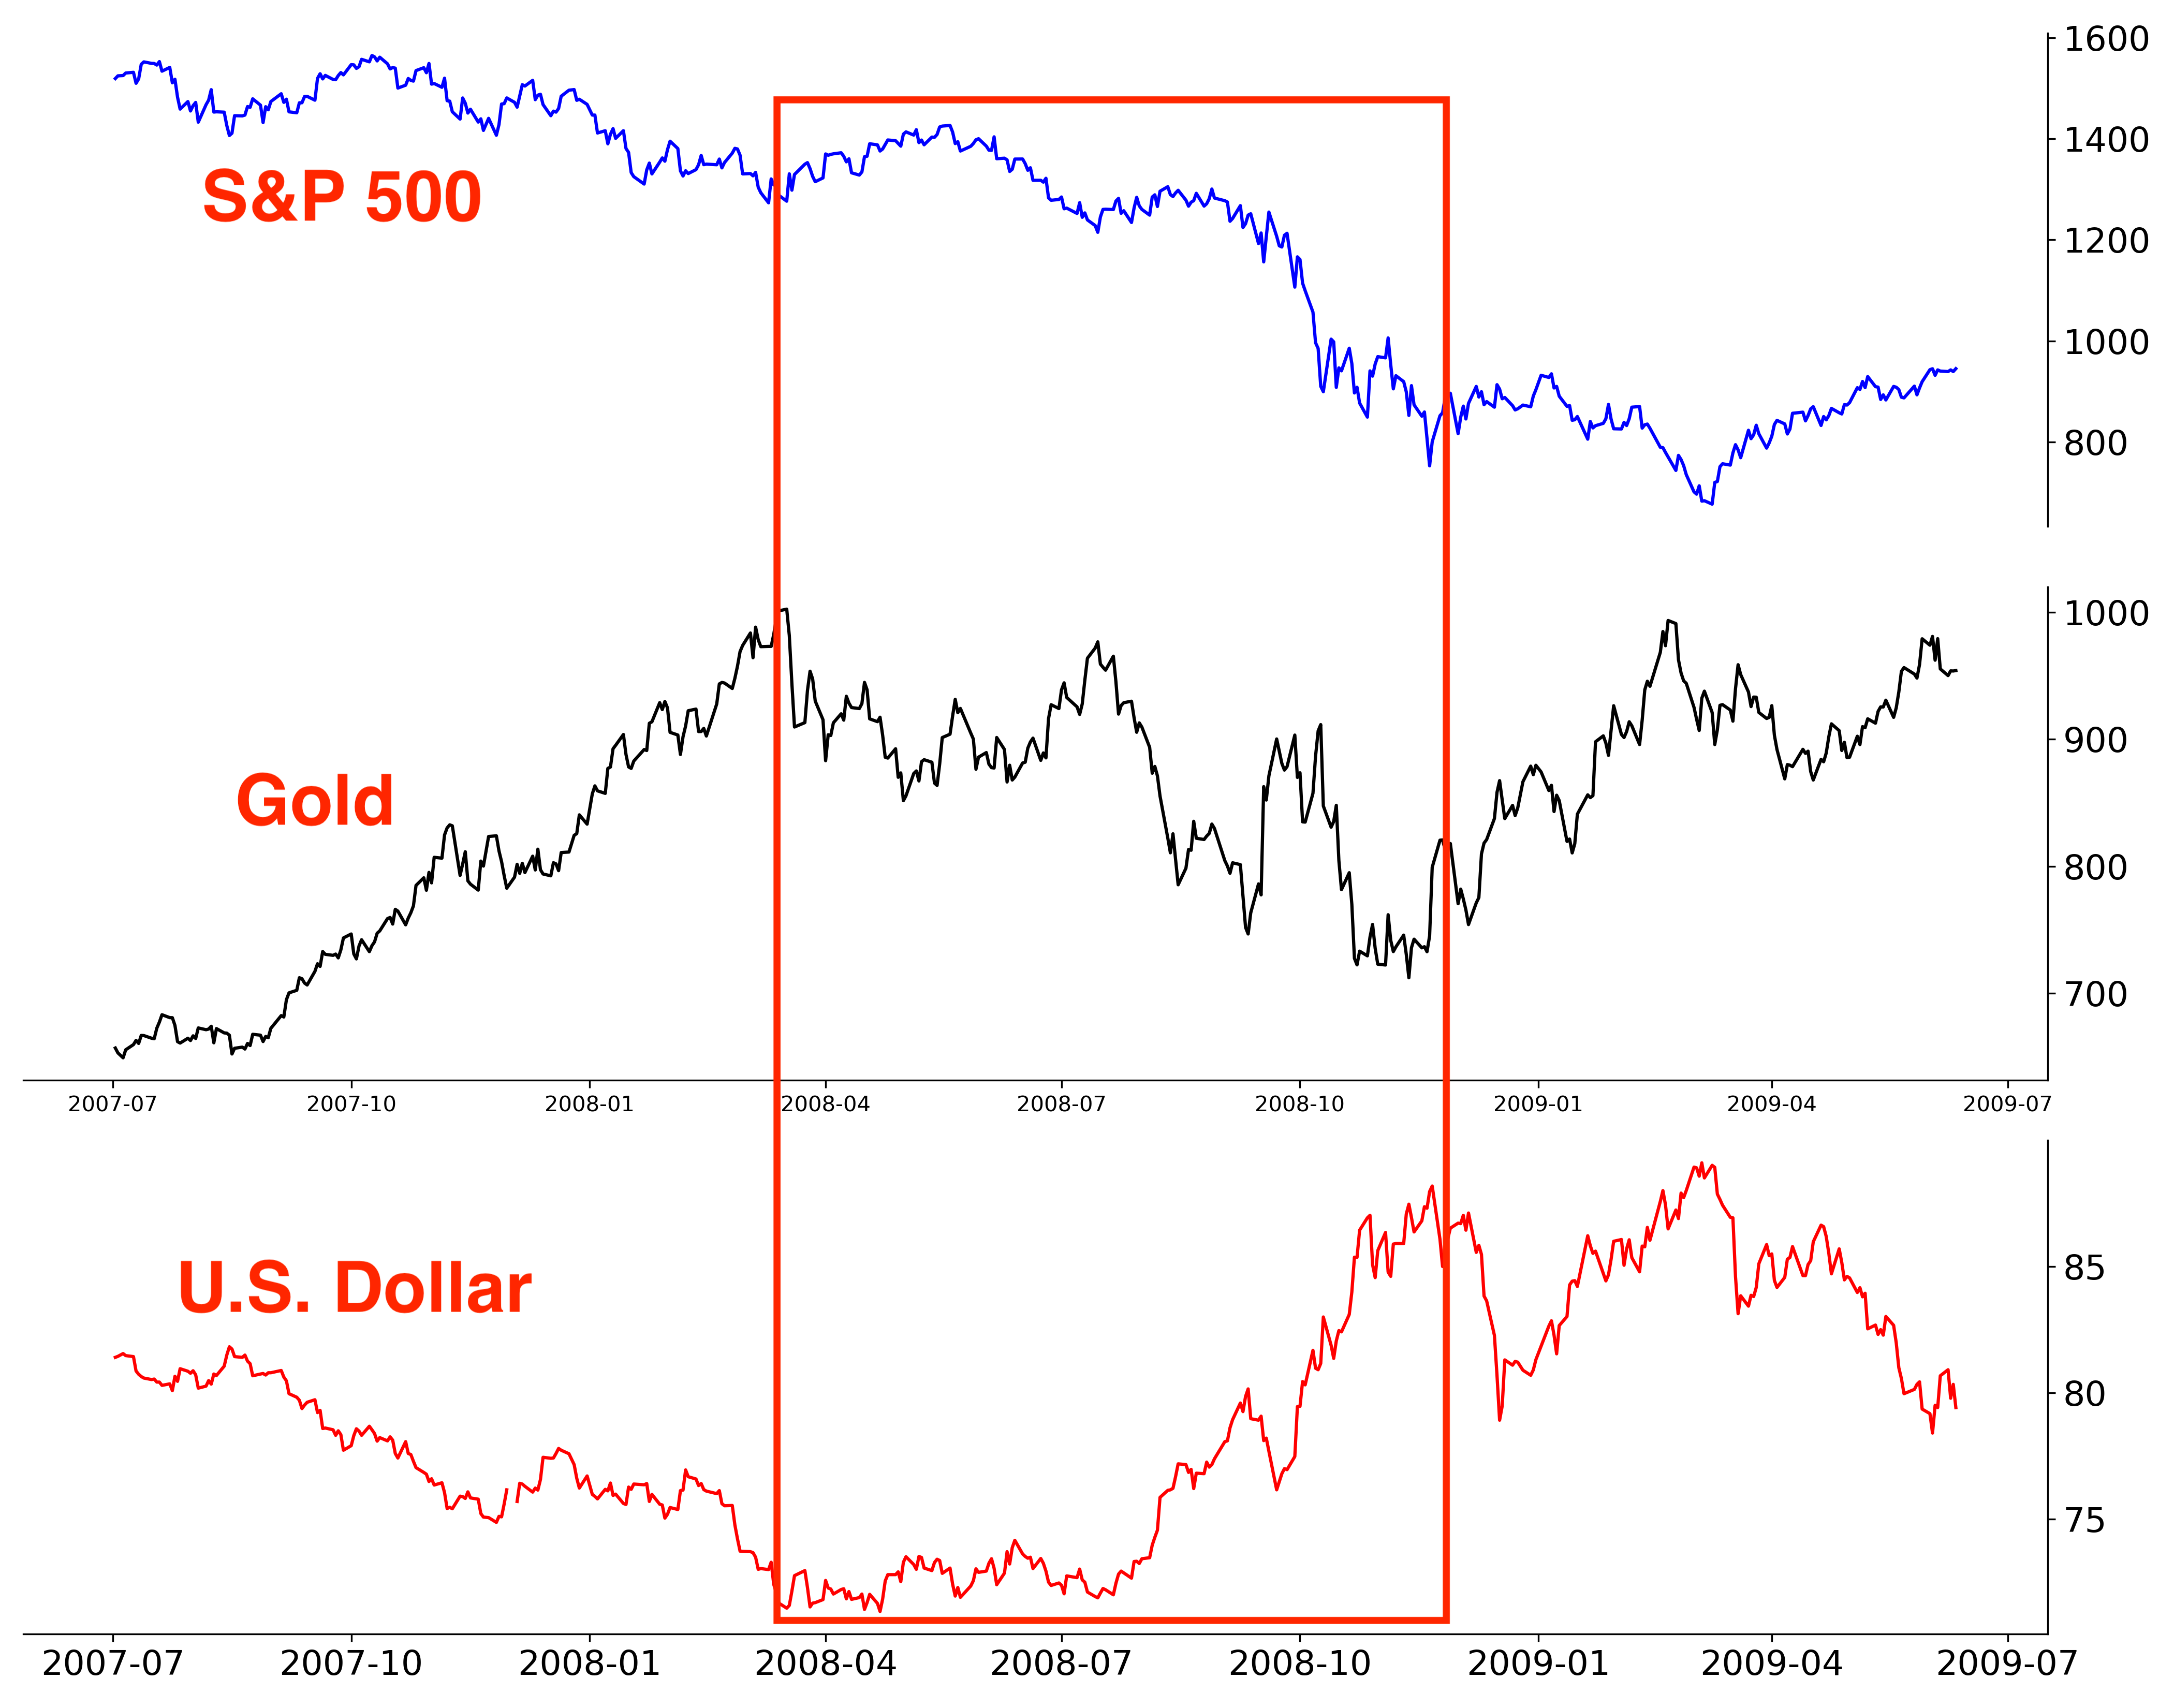
While gold is often seen as a “Safe Haven” during periods of extreme stress, traders who went through 2008 learned an important lesson: in true crisis conditions, the U.S. Dollar remains the ultimate safe haven. Such a scenario is unfolding today, especially with the U.S. as a net-exporter of energy.
This dynamic continues to catch investors off guard today just as it caught investors off guard in 2008. During the GFC - despite being centered in the U.S. - the USD strengthened significantly, defying widespread expectations that the Dollar would weaken given the domestic origins of the GFC.
Speaking of currencies…
Currencies
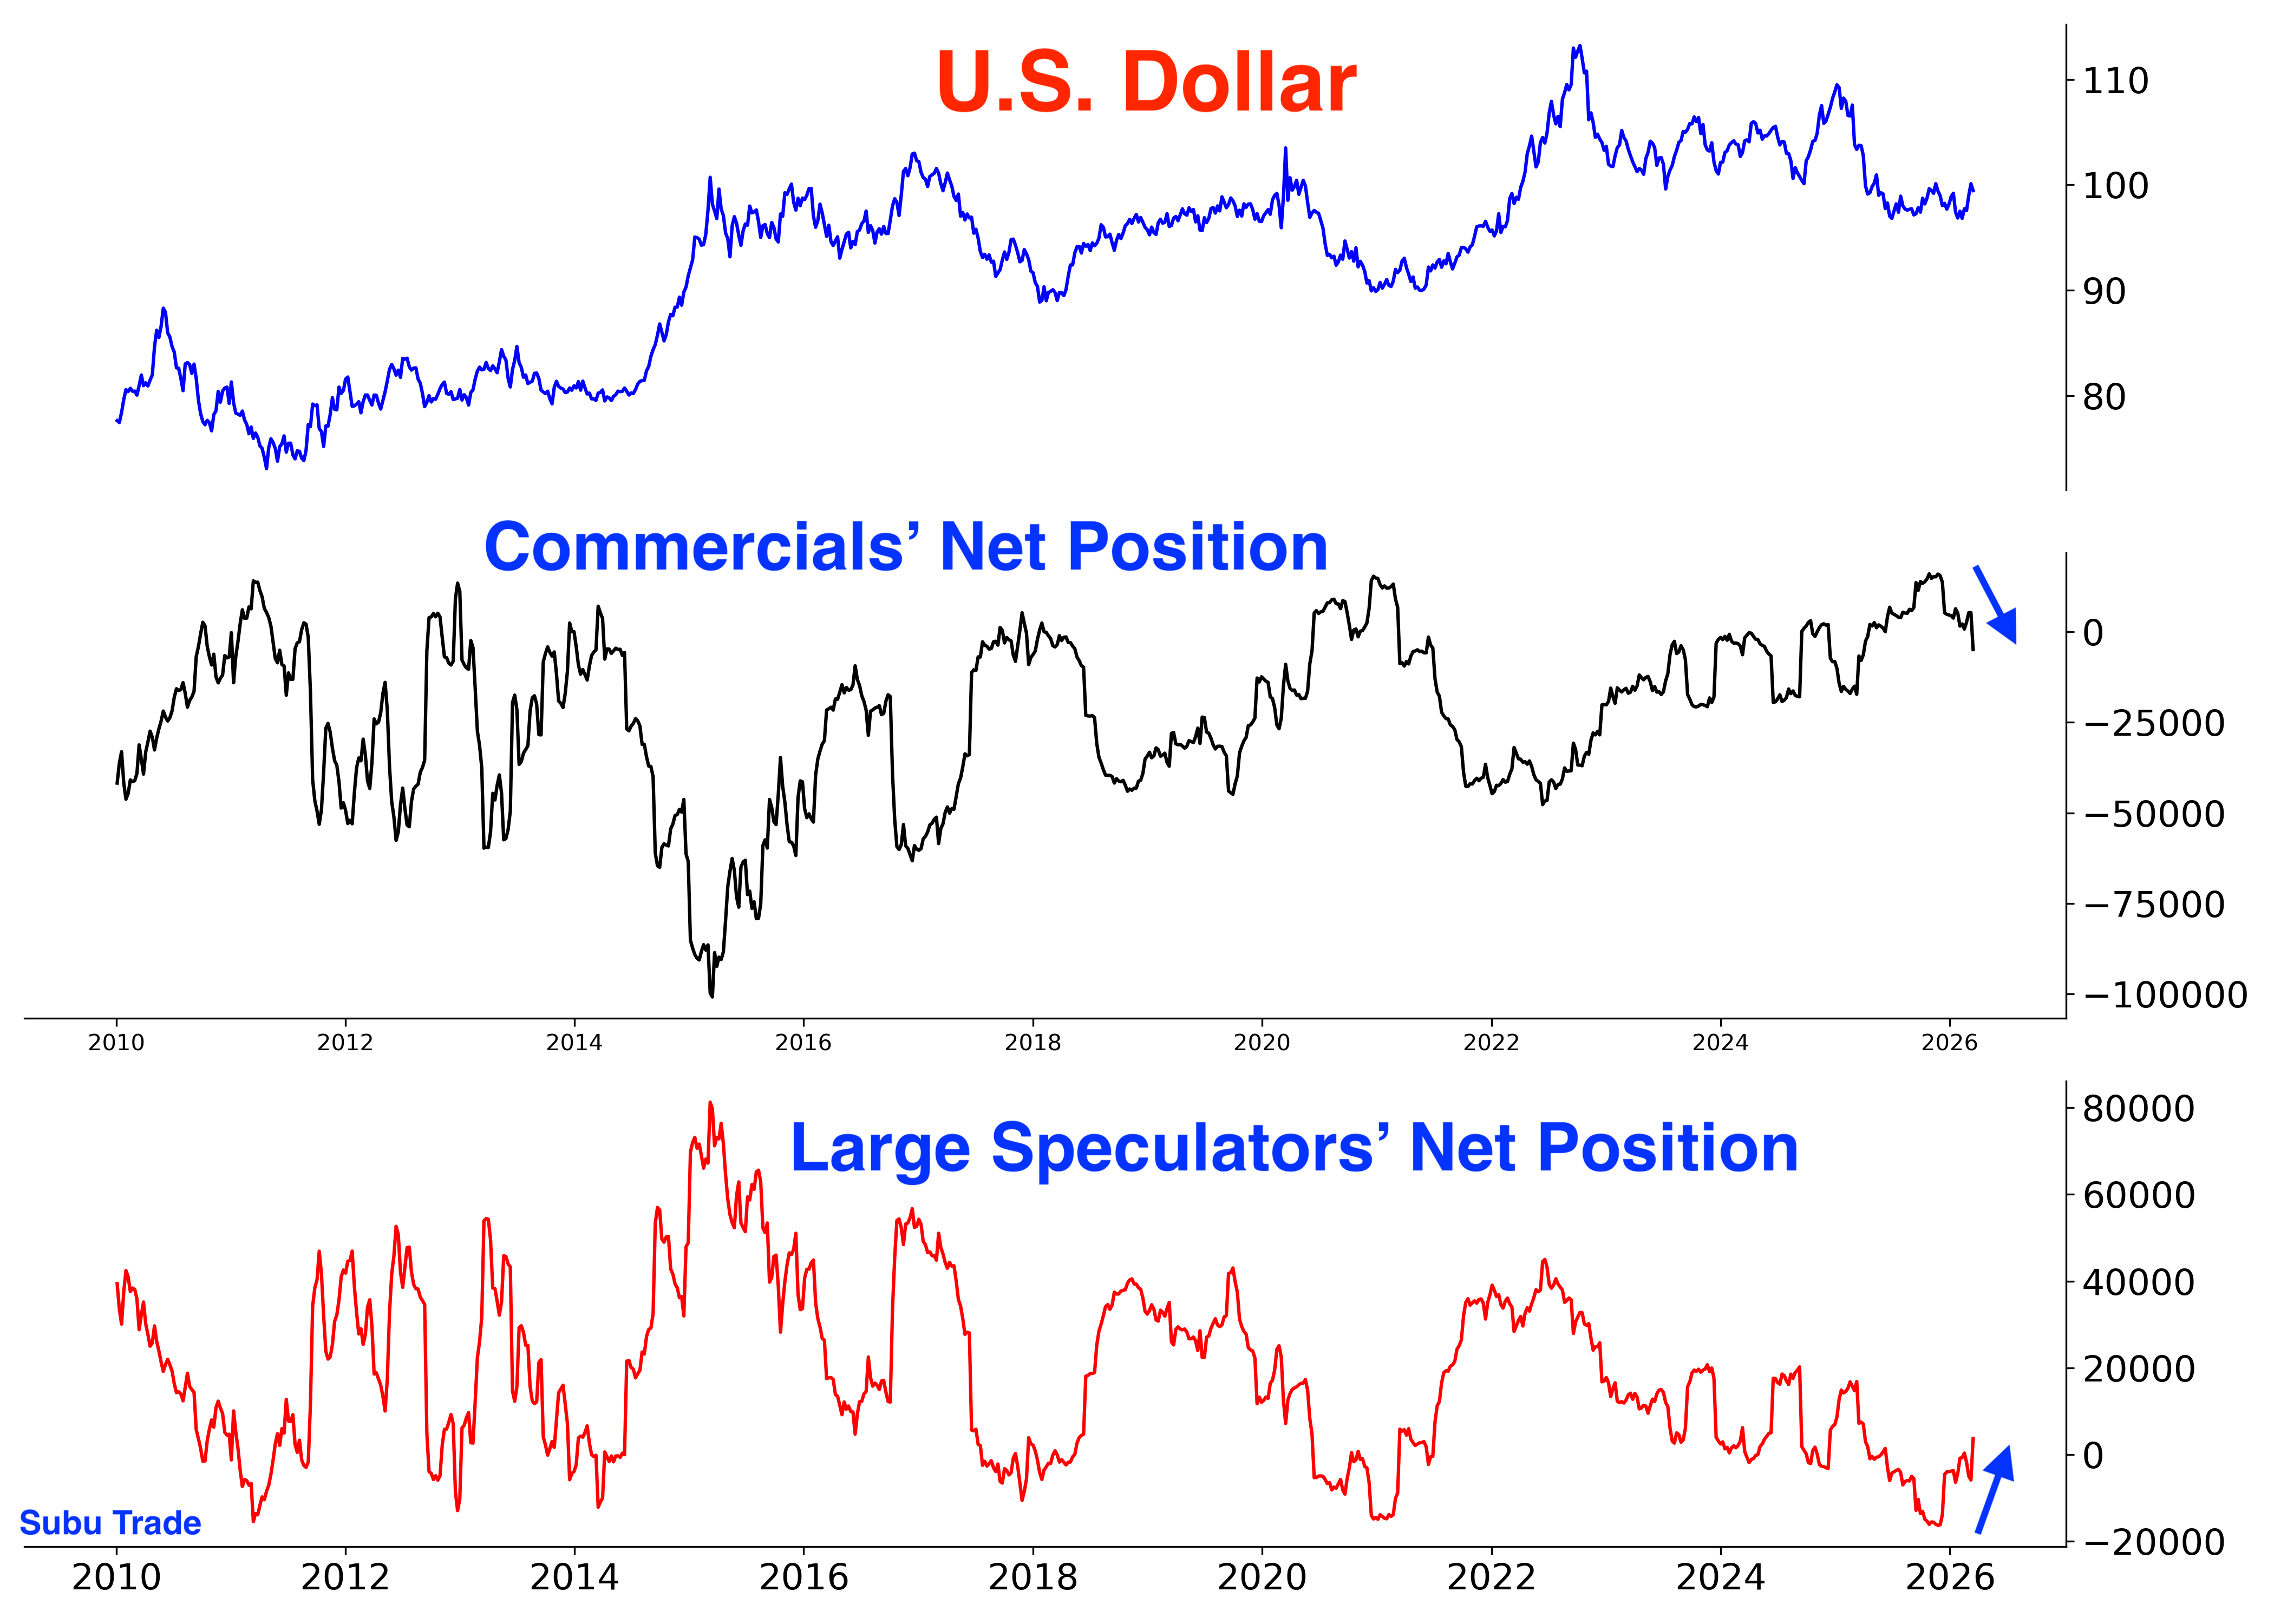
Commercials are still extremely net-long the Dollar and Large Speculators are still extremely net-short. These positions are starting to unwind as the USD rallies:
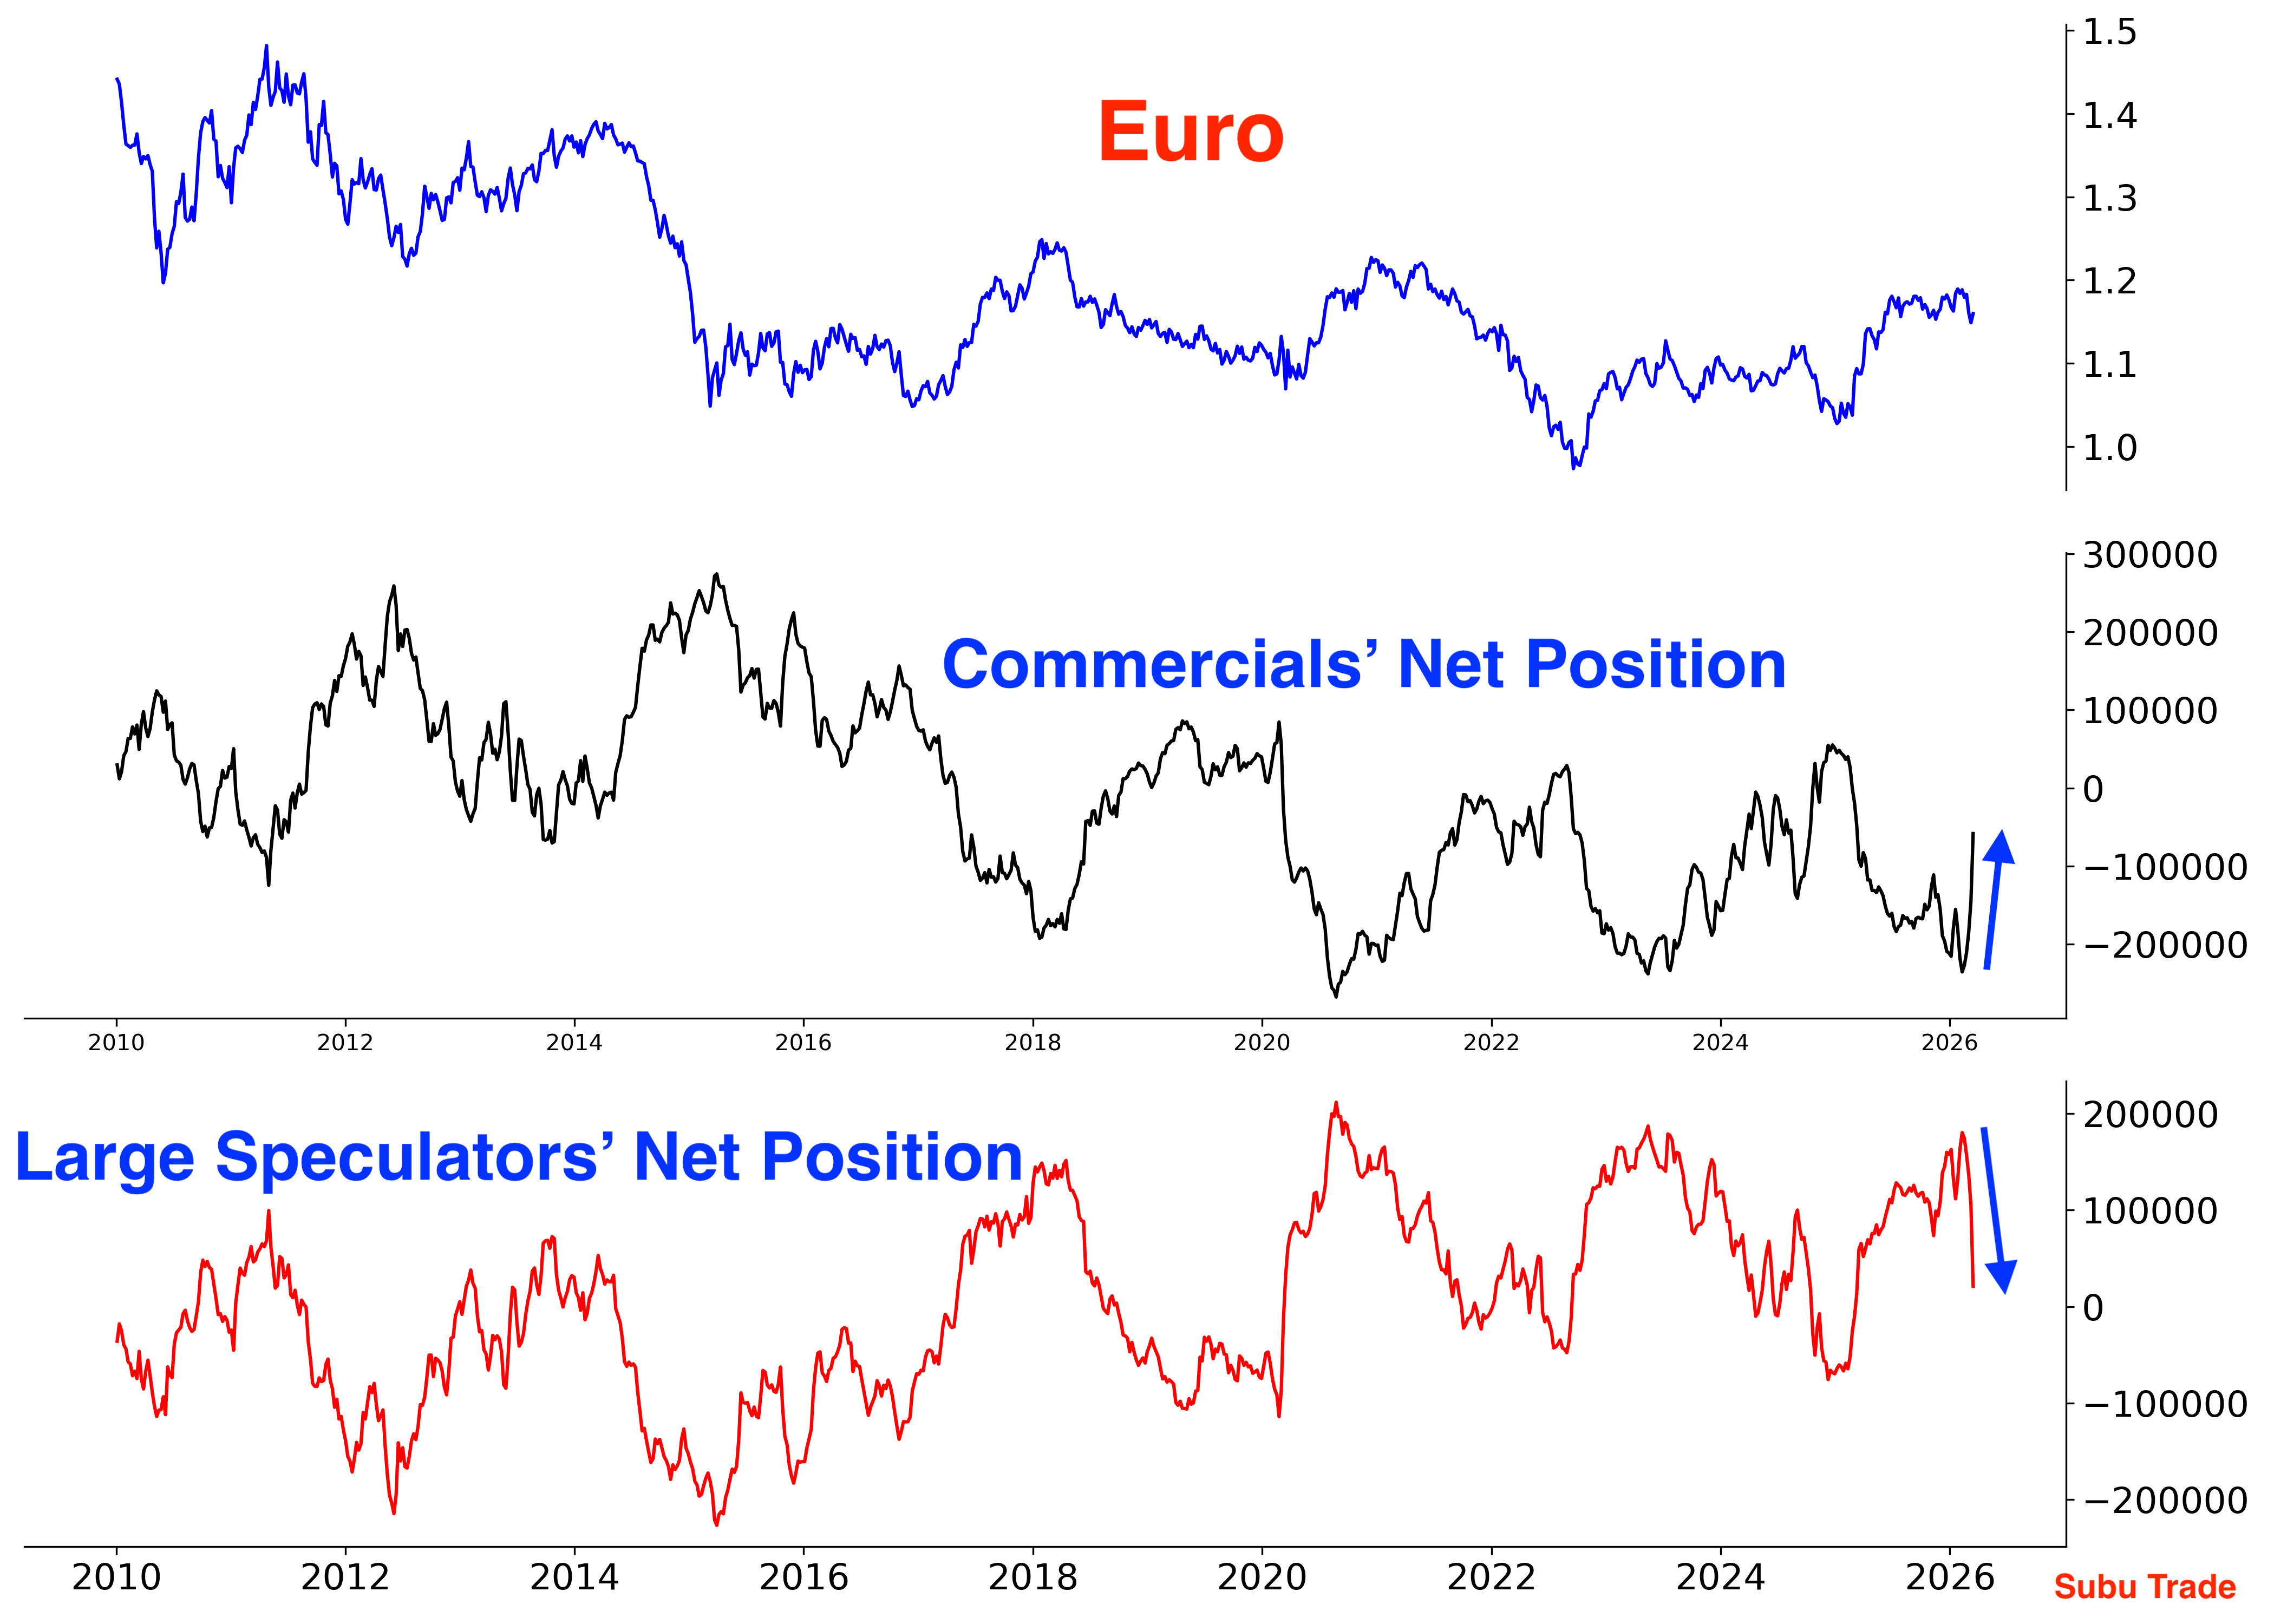
The biggest component of the U.S. Dollar Index is the Euro, so it’s no surprise that Commercials are net-short the Euro and Large Speculators are net-long:
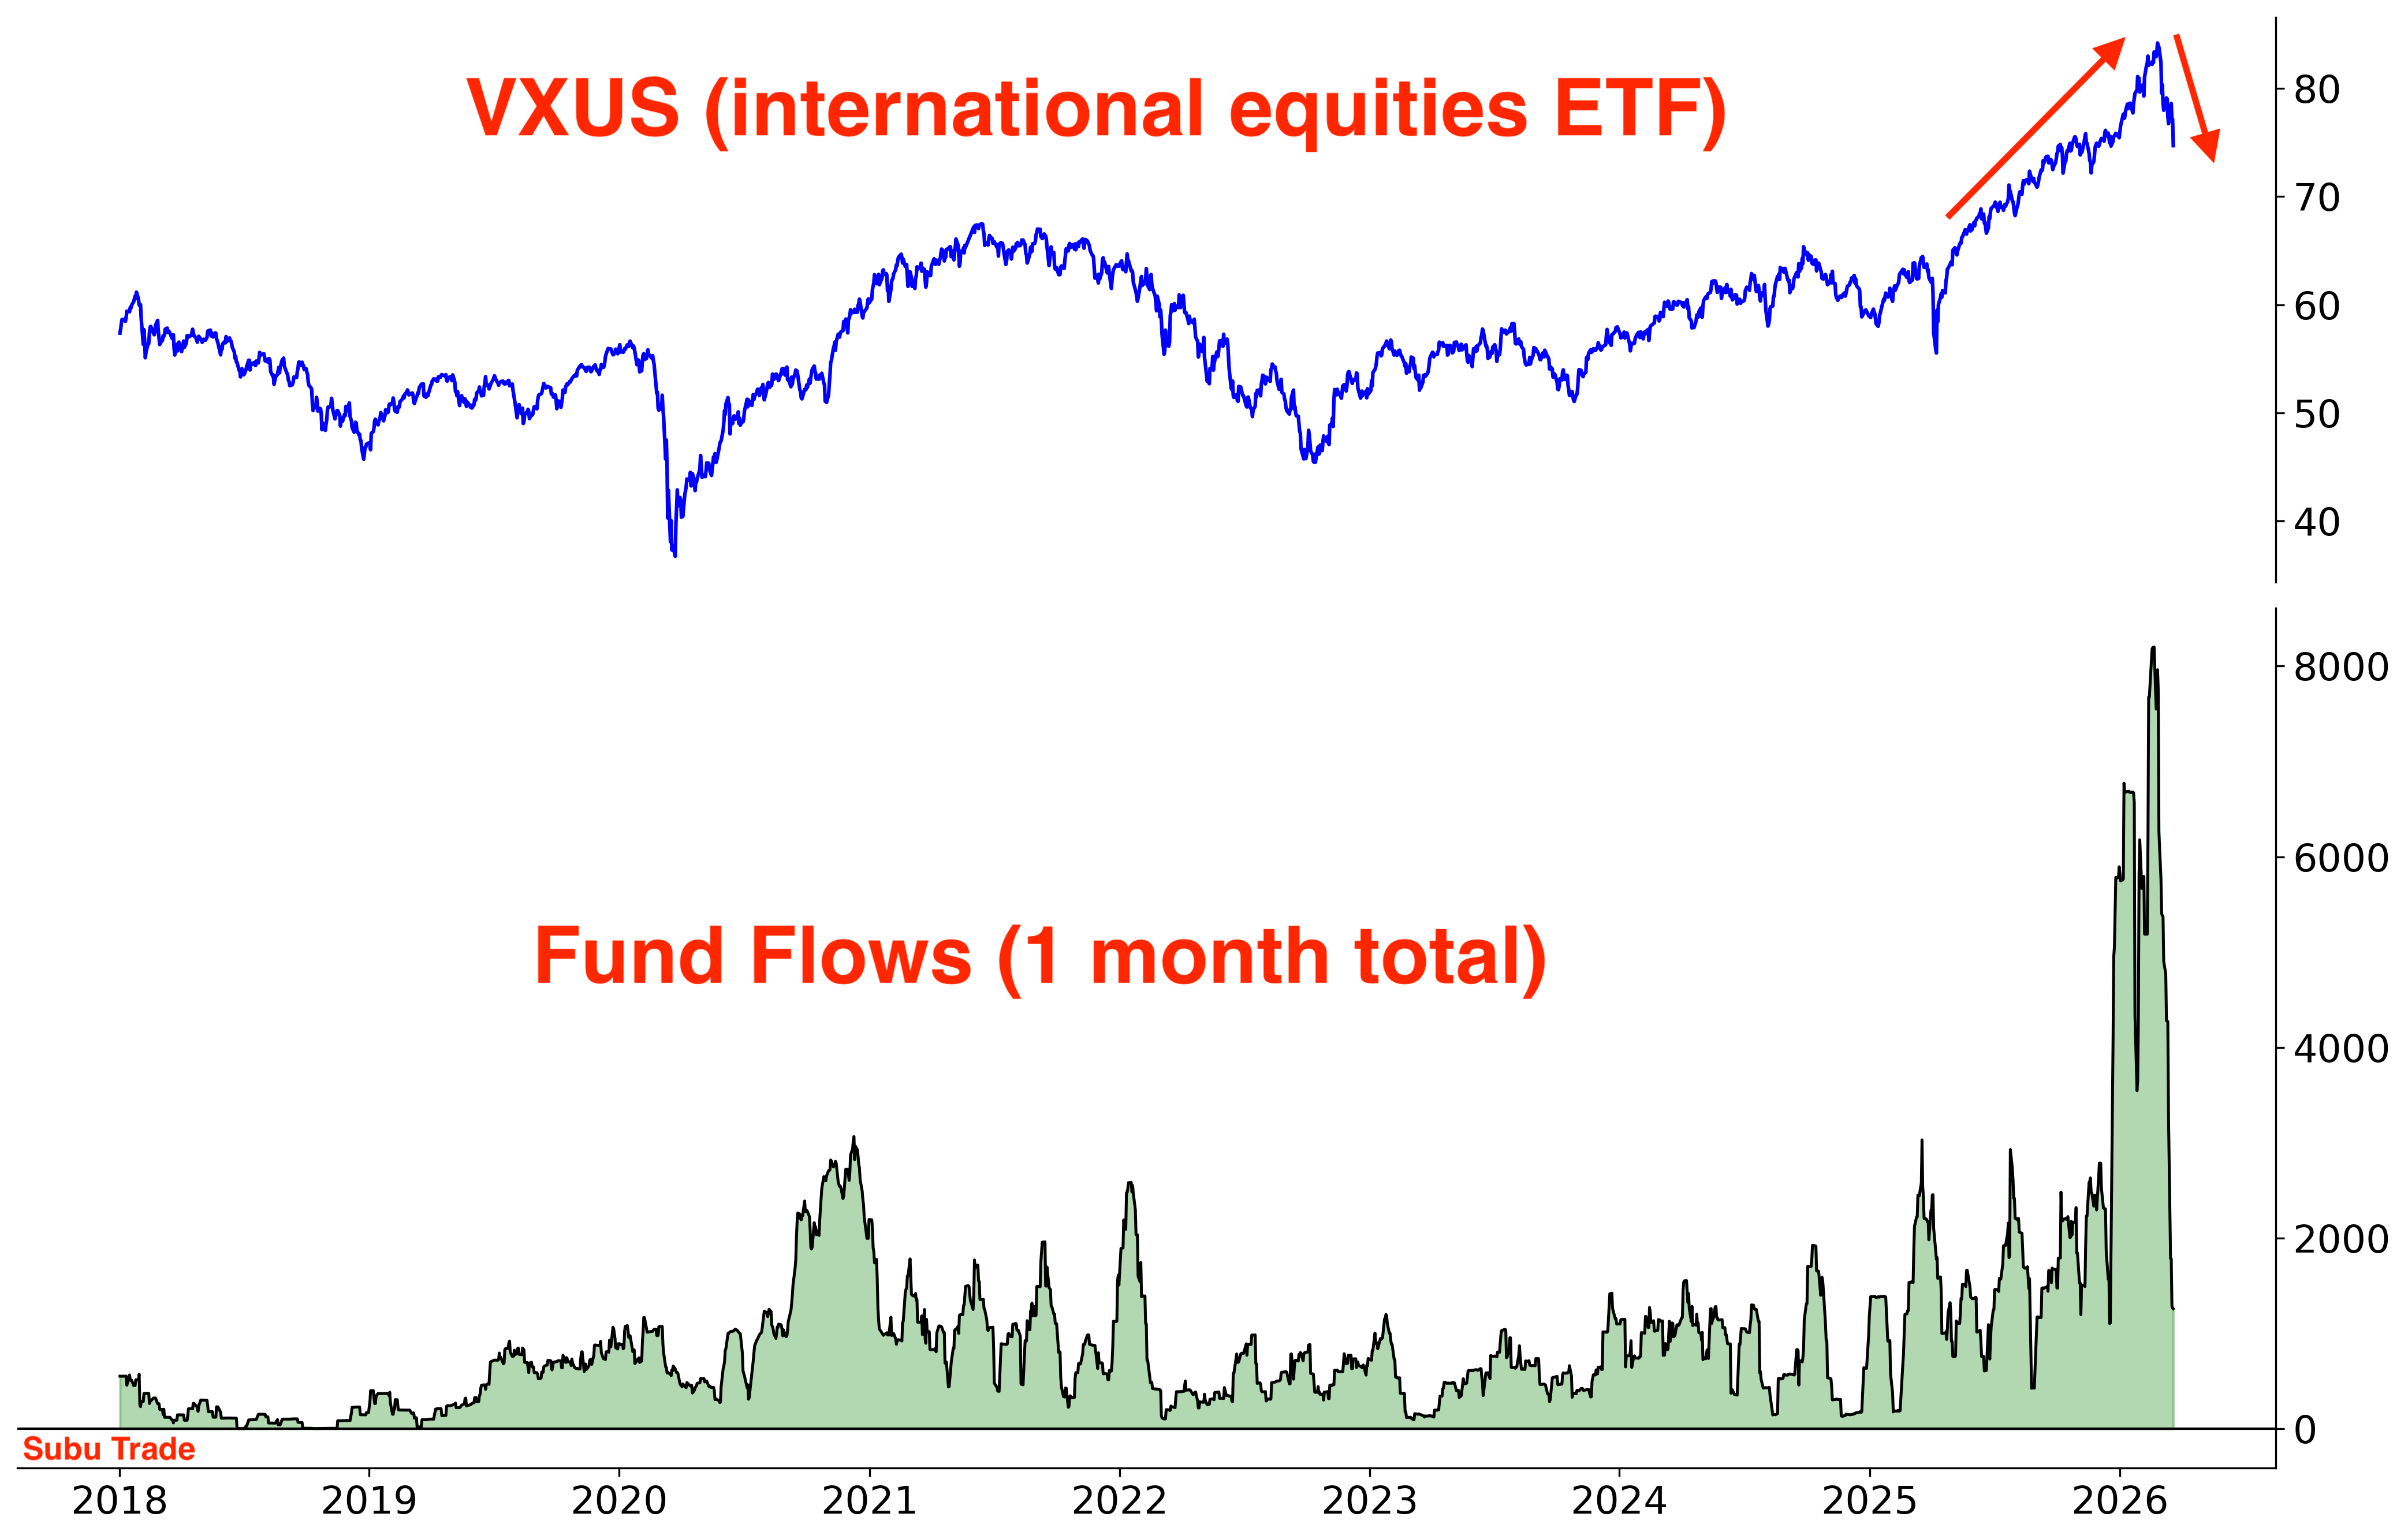
The Dollar rally could still have a ways to go as traders unwind 2025’s short-Dollar trade. A higher Dollar will hurt international equities when priced in USD.
International Equities
Every crisis reinforces one of Warren Buffett’s most enduring principles: “don’t bet against America.”
The U.S. remains the world’s most innovative economy, underpinned by abundant natural resources. These advantages become especially valuable during periods of geopolitical turmoil.
In contrast, nations that lack natural resources, particularly in Europe and Asia (the “Old World”), face disproportionate pressure. One of the most popular trades from 2 months ago - long international equities - is coming crashing down.
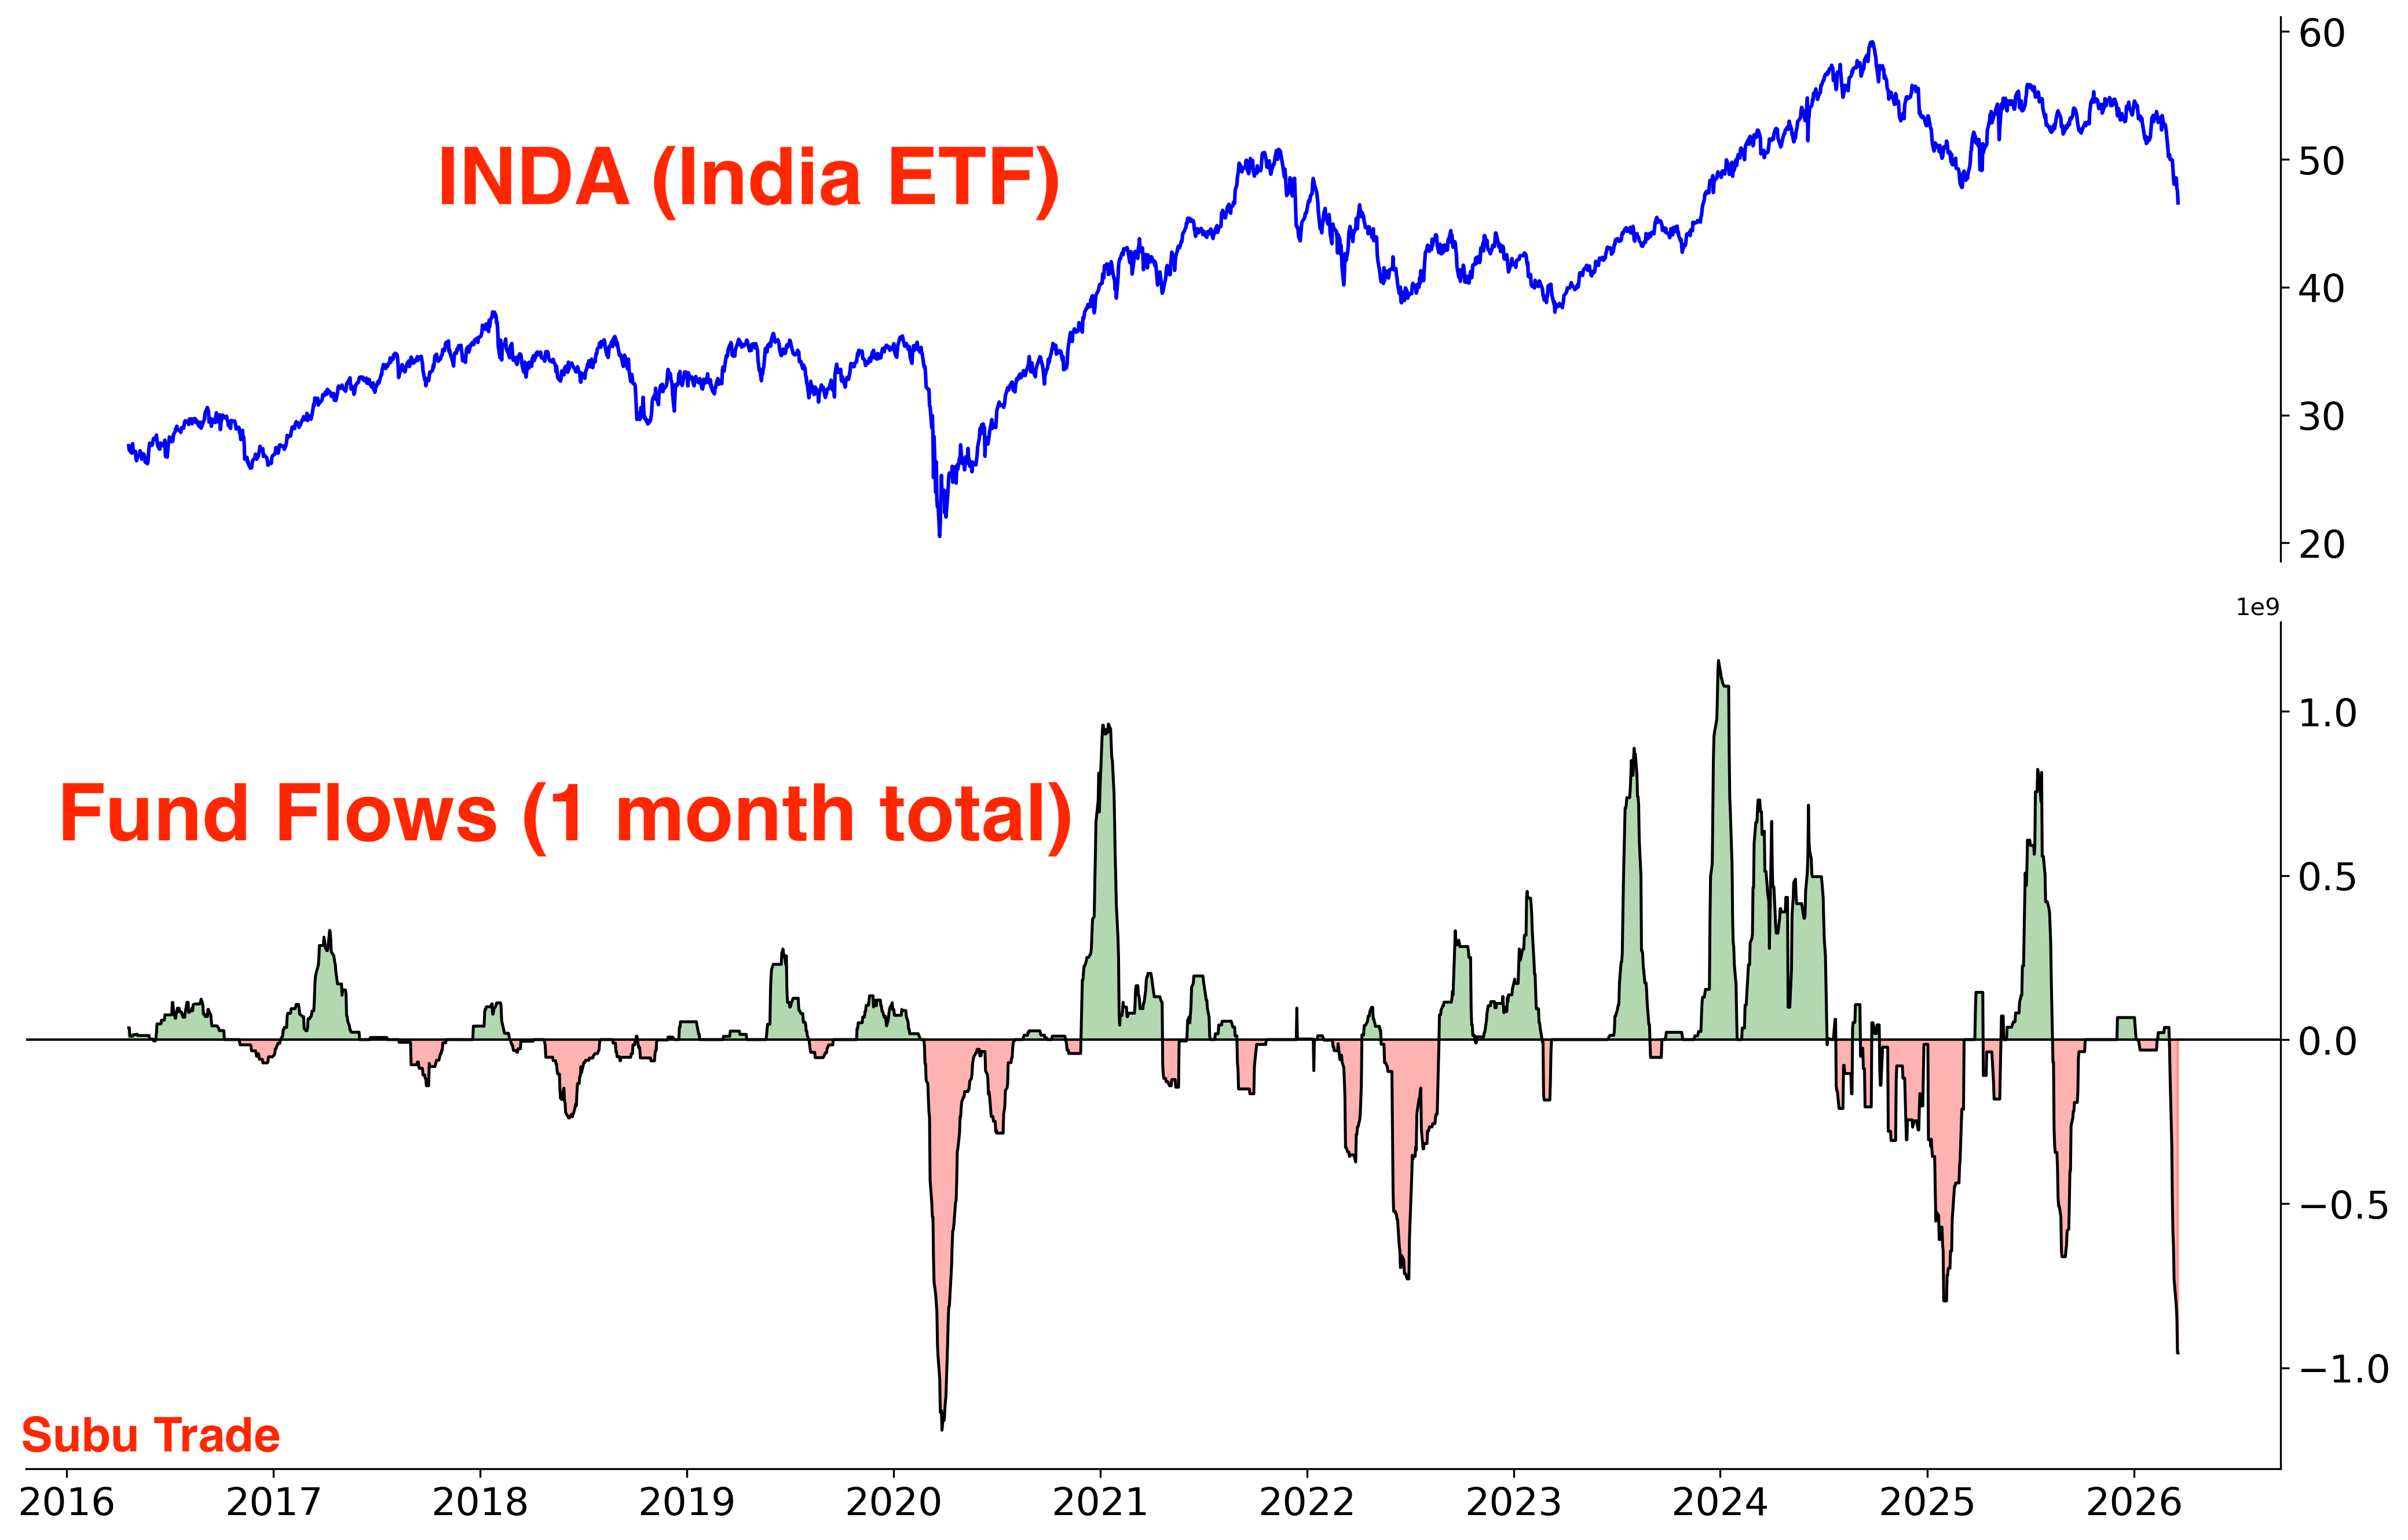
In Asia, Indian equities are under pressure by dual headwinds: mounting concerns that AI could disrupt India’s Services exports, alongside rising oil prices weighing on a major energy importer like India.
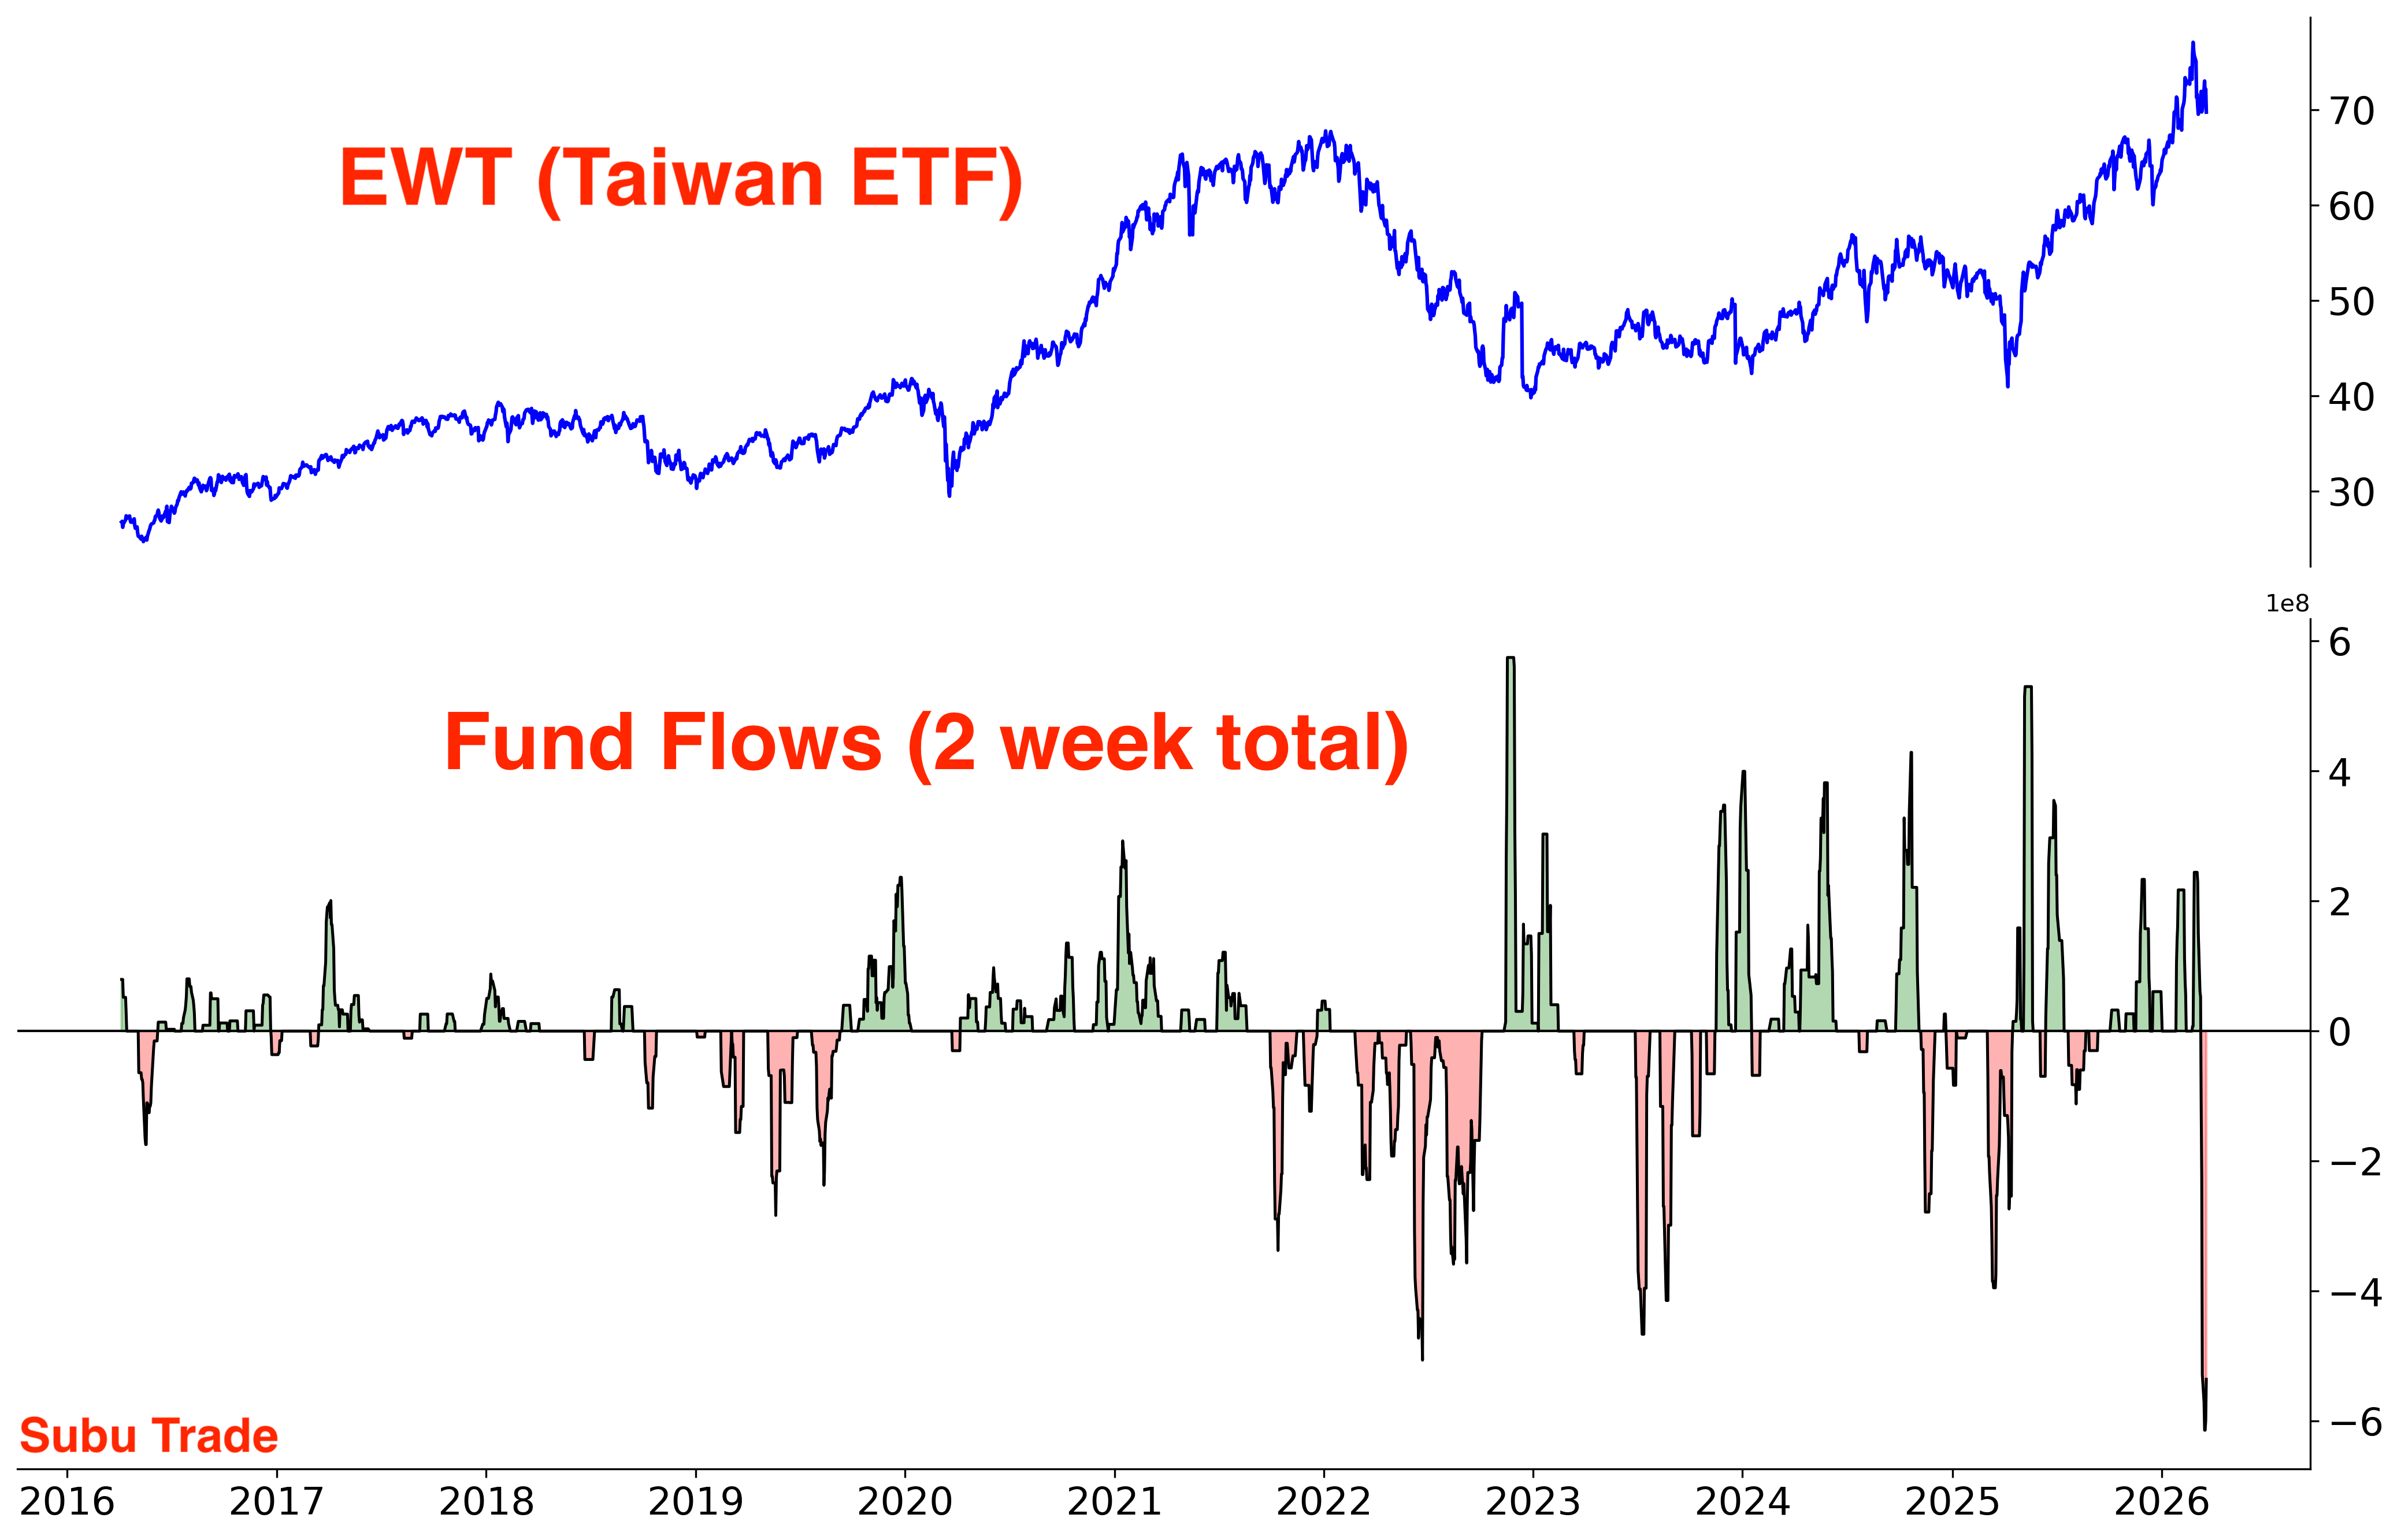
In East Asia, Taiwanese stocks are seeing record outflows. Taiwan is the poster child of the AI boom, since 21% of Taiwan’s GDP comes from the semiconductor industry:
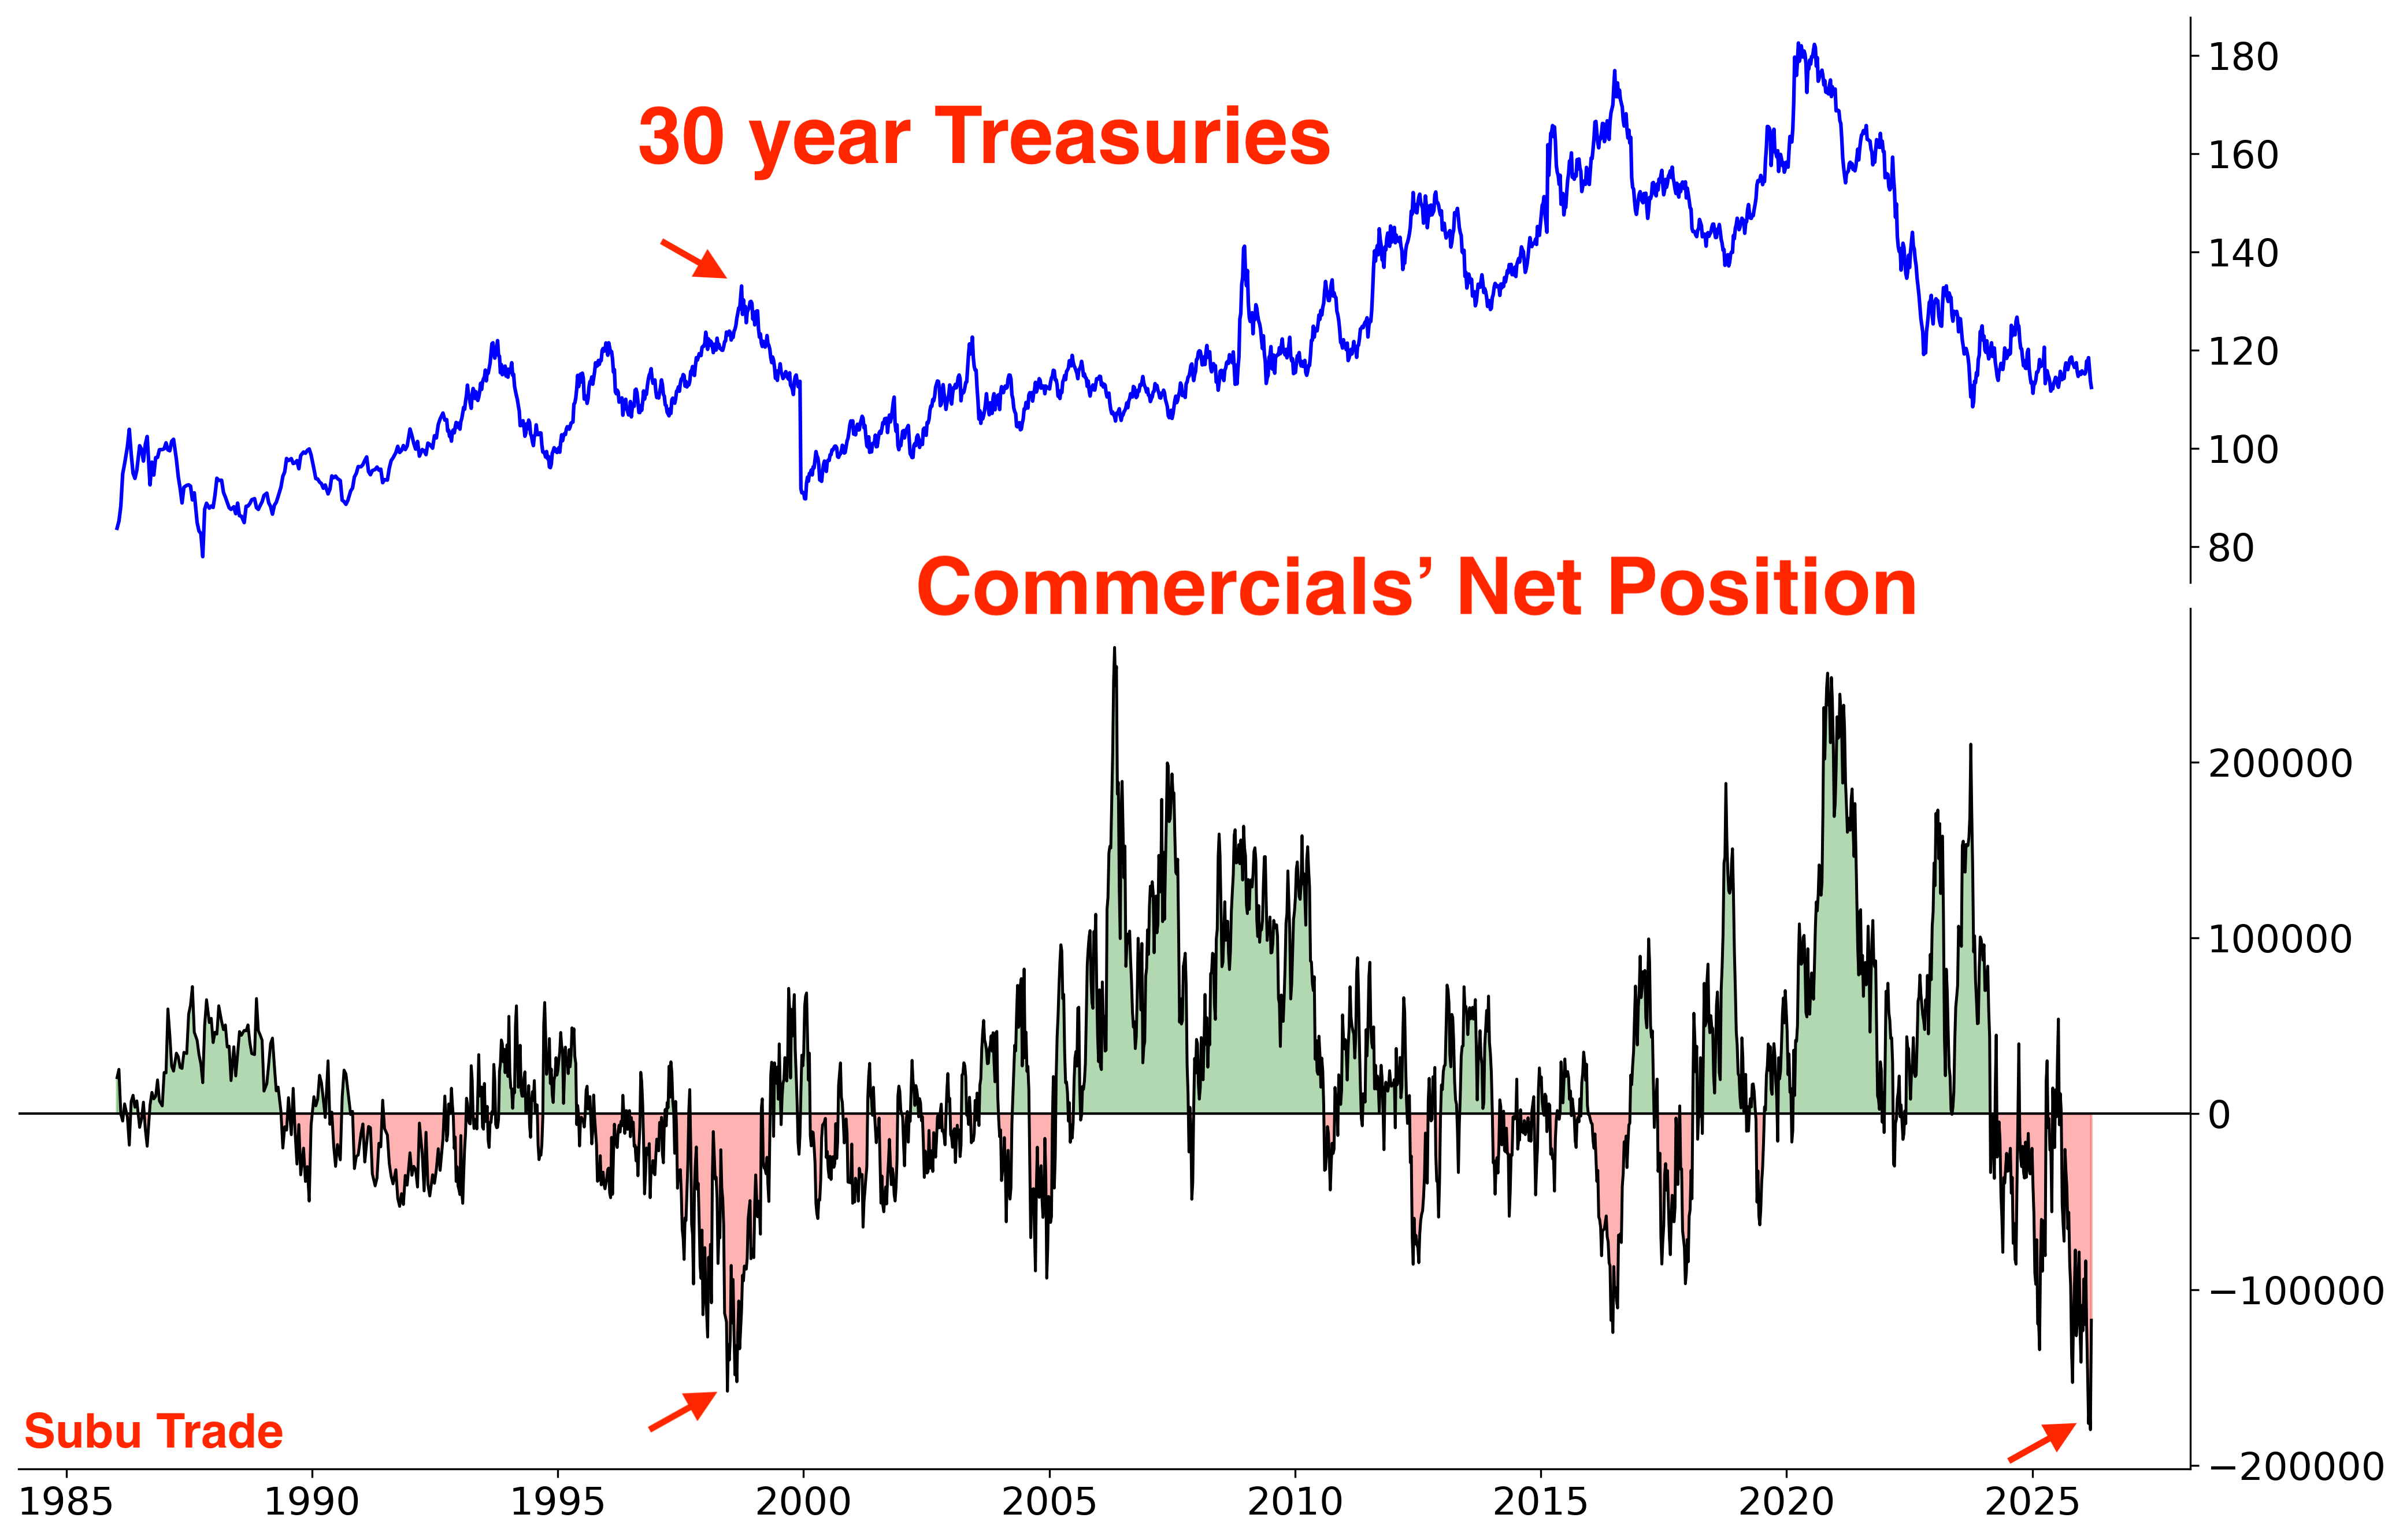
Bonds
The Iran war is triggering fears of higher inflation, which could hurt bond prices. According to the COT Report, Commercials are extremely short 30 year Treasuries:
Conclusion
The Iran war gives us an important reminder: when positioning gets crowded, any catalyst (including Black Swans) can trigger a violent unwind.
Since the Liberation Day lows, markets have gone nearly straight up. Everything was bid: U.S. growth (tech), small caps, Dow, defensives, precious metals etc. Speculation flooded every corner.
Now comes the unwind.
We’re getting closer to levels where risk/reward turns favorable to bulls, but we’re not there yet.
As always stay nimble, stay humble, or be humbled.
Keep an open mind, especially to scenarios that challenge your opinion.
This is the time to let markets, as Jerry Maguire said, “SHOW ME THE MONEY”!

Thank you so much Sir. Great report. I enjoyed this valuable material a lot.